Zip Codes with the Highest Percentage of Population Employed in Legal Services & Support in Philadelphia, PA
RELATED REPORTS & OPTIONS
Legal Services & Support
Philadelphia
Compare Zip Codes
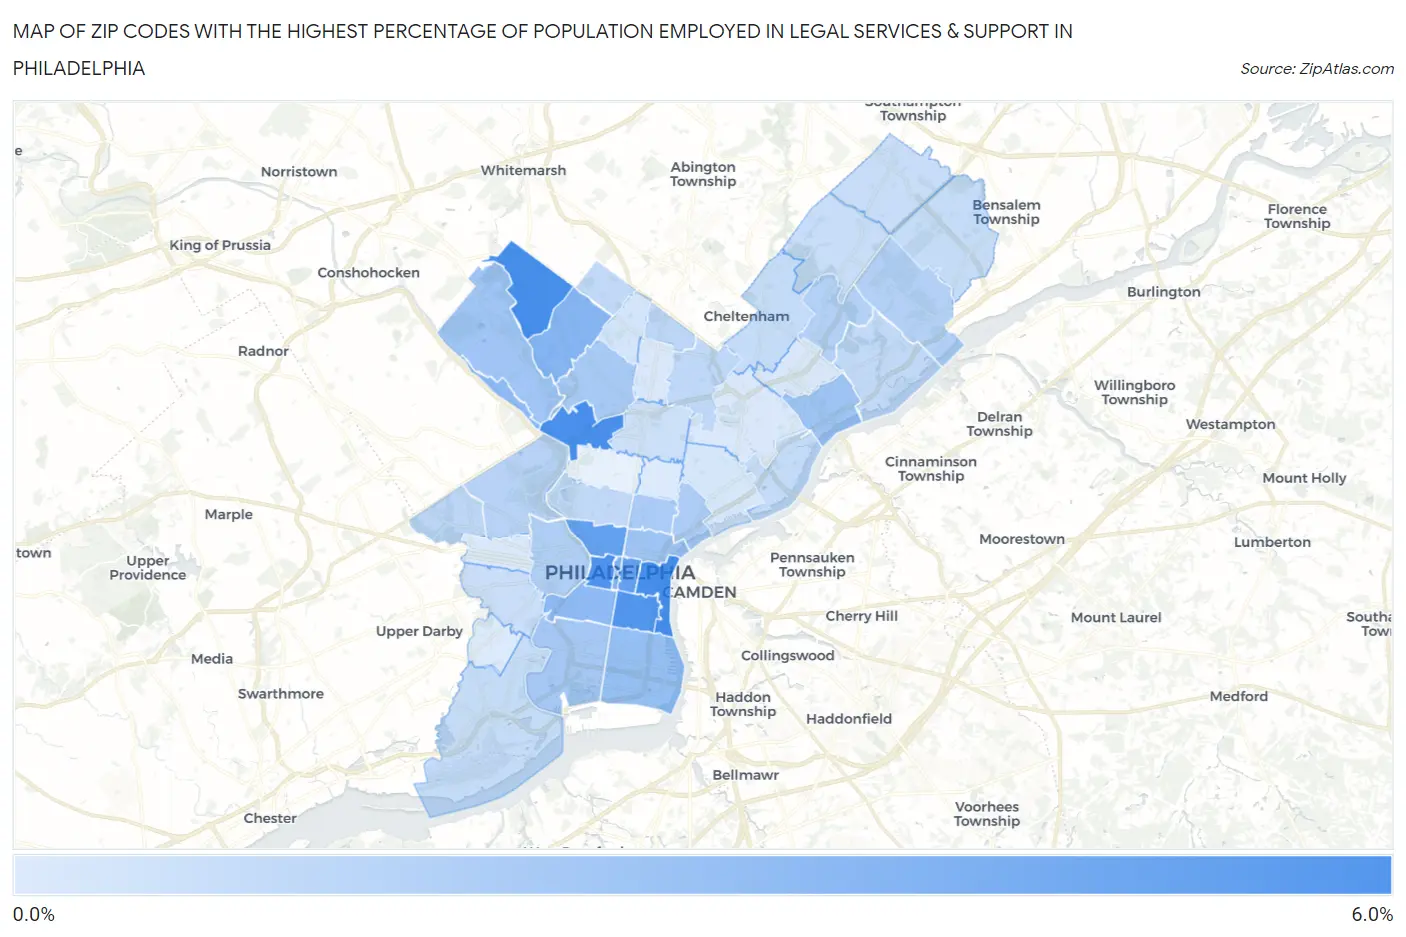
Map of Zip Codes with the Highest Percentage of Population Employed in Legal Services & Support in Philadelphia
0.052%
5.9%
Zip Codes with the Highest Percentage of Population Employed in Legal Services & Support in Philadelphia, PA
| Zip Code | % Employed | vs State | vs National | |
| 1. | 19106 | 5.9% | 1.1%(+4.74)#23 | 1.2%(+4.70)#503 |
| 2. | 19118 | 5.9% | 1.1%(+4.72)#24 | 1.2%(+4.69)#512 |
| 3. | 19129 | 5.8% | 1.1%(+4.61)#26 | 1.2%(+4.57)#540 |
| 4. | 19103 | 5.6% | 1.1%(+4.42)#29 | 1.2%(+4.39)#588 |
| 5. | 19147 | 5.5% | 1.1%(+4.31)#30 | 1.2%(+4.27)#610 |
| 6. | 19130 | 4.8% | 1.1%(+3.65)#39 | 1.2%(+3.62)#776 |
| 7. | 19107 | 4.8% | 1.1%(+3.63)#40 | 1.2%(+3.59)#787 |
| 8. | 19102 | 3.6% | 1.1%(+2.40)#63 | 1.2%(+2.37)#1,388 |
| 9. | 19119 | 3.5% | 1.1%(+2.30)#67 | 1.2%(+2.27)#1,468 |
| 10. | 19146 | 3.1% | 1.1%(+1.93)#81 | 1.2%(+1.89)#1,773 |
| 11. | 19127 | 3.0% | 1.1%(+1.90)#84 | 1.2%(+1.87)#1,801 |
| 12. | 19148 | 2.8% | 1.1%(+1.67)#90 | 1.2%(+1.64)#2,056 |
| 13. | 19123 | 2.5% | 1.1%(+1.30)#118 | 1.2%(+1.27)#2,596 |
| 14. | 19135 | 2.4% | 1.1%(+1.28)#120 | 1.2%(+1.25)#2,622 |
| 15. | 19128 | 2.4% | 1.1%(+1.21)#125 | 1.2%(+1.17)#2,741 |
| 16. | 19145 | 2.1% | 1.1%(+0.994)#147 | 1.2%(+0.957)#3,157 |
| 17. | 19144 | 2.1% | 1.1%(+0.935)#149 | 1.2%(+0.899)#3,265 |
| 18. | 19122 | 2.0% | 1.1%(+0.874)#155 | 1.2%(+0.837)#3,414 |
| 19. | 19125 | 1.9% | 1.1%(+0.766)#168 | 1.2%(+0.729)#3,695 |
| 20. | 19104 | 1.7% | 1.1%(+0.535)#195 | 1.2%(+0.498)#4,369 |
| 21. | 19114 | 1.7% | 1.1%(+0.522)#199 | 1.2%(+0.485)#4,429 |
| 22. | 19152 | 1.6% | 1.1%(+0.488)#203 | 1.2%(+0.452)#4,545 |
| 23. | 19131 | 1.4% | 1.1%(+0.283)#239 | 1.2%(+0.246)#5,331 |
| 24. | 19151 | 1.3% | 1.1%(+0.122)#273 | 1.2%(+0.085)#6,106 |
| 25. | 19126 | 1.3% | 1.1%(+0.107)#277 | 1.2%(+0.071)#6,177 |
| 26. | 19120 | 1.2% | 1.1%(+0.085)#282 | 1.2%(+0.048)#6,312 |
| 27. | 19121 | 1.1% | 1.1%(-0.028)#320 | 1.2%(-0.065)#7,026 |
| 28. | 19150 | 1.1% | 1.1%(-0.054)#330 | 1.2%(-0.091)#7,221 |
| 29. | 19136 | 1.1% | 1.1%(-0.071)#338 | 1.2%(-0.108)#7,334 |
| 30. | 19137 | 0.97% | 1.1%(-0.173)#374 | 1.2%(-0.210)#8,005 |
| 31. | 19153 | 0.95% | 1.1%(-0.201)#389 | 1.2%(-0.237)#8,229 |
| 32. | 19111 | 0.90% | 1.1%(-0.243)#401 | 1.2%(-0.279)#8,561 |
| 33. | 19154 | 0.90% | 1.1%(-0.243)#402 | 1.2%(-0.279)#8,562 |
| 34. | 19115 | 0.87% | 1.1%(-0.280)#422 | 1.2%(-0.317)#8,882 |
| 35. | 19116 | 0.80% | 1.1%(-0.348)#456 | 1.2%(-0.384)#9,448 |
| 36. | 19143 | 0.73% | 1.1%(-0.414)#492 | 1.2%(-0.450)#10,074 |
| 37. | 19140 | 0.67% | 1.1%(-0.482)#516 | 1.2%(-0.518)#10,771 |
| 38. | 19138 | 0.41% | 1.1%(-0.735)#683 | 1.2%(-0.772)#13,709 |
| 39. | 19134 | 0.27% | 1.1%(-0.875)#777 | 1.2%(-0.912)#15,362 |
| 40. | 19149 | 0.22% | 1.1%(-0.928)#806 | 1.2%(-0.964)#15,984 |
| 41. | 19124 | 0.14% | 1.1%(-1.01)#857 | 1.2%(-1.04)#16,779 |
| 42. | 19139 | 0.13% | 1.1%(-1.02)#864 | 1.2%(-1.06)#16,892 |
| 43. | 19141 | 0.097% | 1.1%(-1.05)#877 | 1.2%(-1.09)#17,148 |
| 44. | 19133 | 0.060% | 1.1%(-1.09)#894 | 1.2%(-1.12)#17,392 |
| 45. | 19142 | 0.052% | 1.1%(-1.10)#898 | 1.2%(-1.13)#17,421 |
1
Common Questions
What are the Top 10 Zip Codes with the Highest Percentage of Population Employed in Legal Services & Support in Philadelphia, PA?
Top 10 Zip Codes with the Highest Percentage of Population Employed in Legal Services & Support in Philadelphia, PA are:
What zip code has the Highest Percentage of Population Employed in Legal Services & Support in Philadelphia, PA?
19106 has the Highest Percentage of Population Employed in Legal Services & Support in Philadelphia, PA with 5.9%.
What is the Percentage of Population Employed in Legal Services & Support in Philadelphia, PA?
Percentage of Population Employed in Legal Services & Support in Philadelphia is 1.8%.
What is the Percentage of Population Employed in Legal Services & Support in Pennsylvania?
Percentage of Population Employed in Legal Services & Support in Pennsylvania is 1.1%.
What is the Percentage of Population Employed in Legal Services & Support in the United States?
Percentage of Population Employed in Legal Services & Support in the United States is 1.2%.