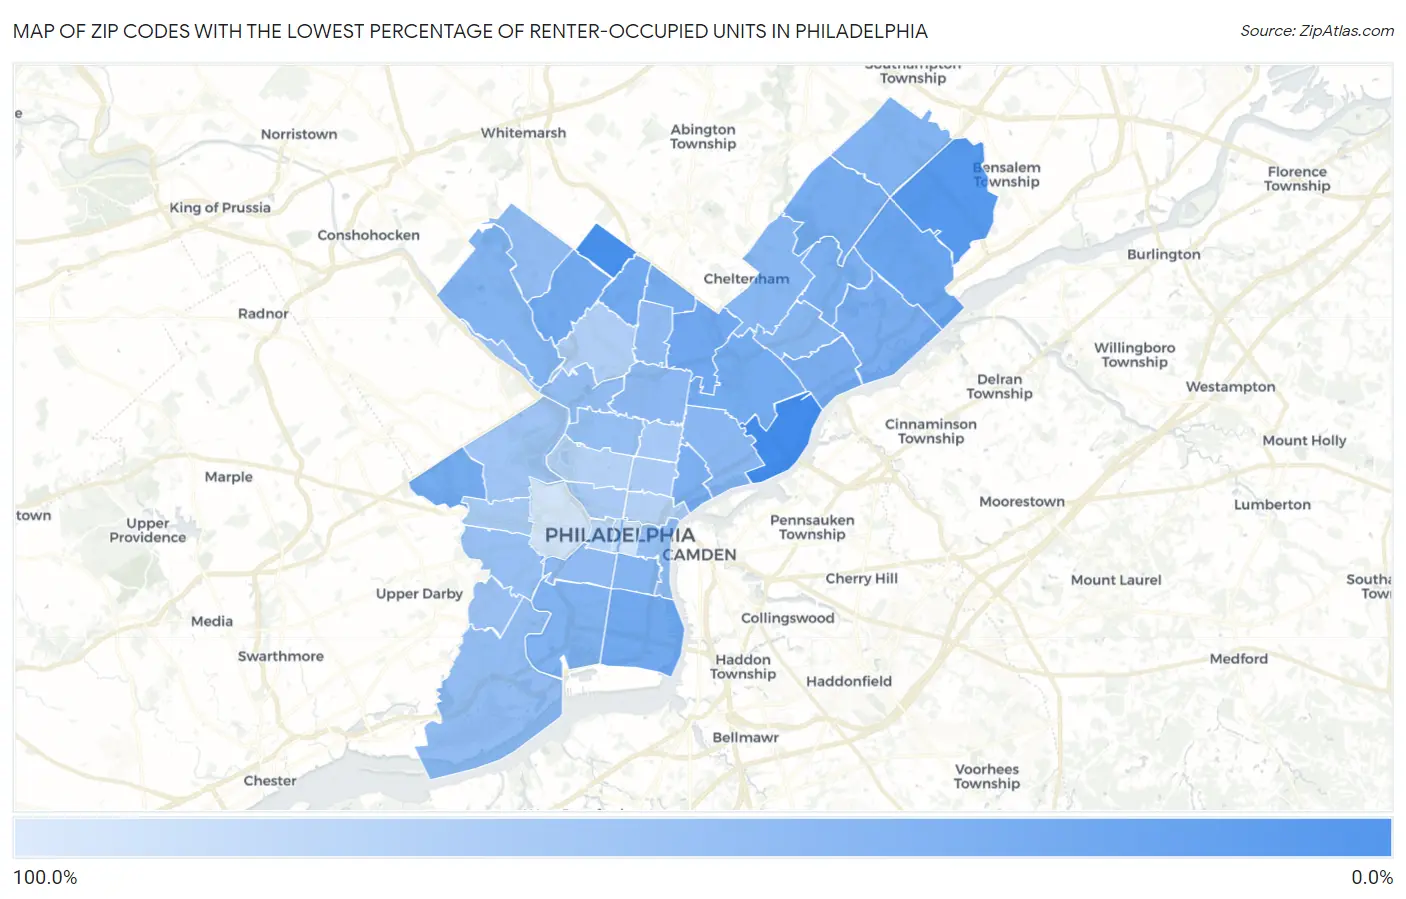
Zip Codes with the Lowest Percentage of Renter-Occupied Units in Philadelphia, PA
RELATED REPORTS & OPTIONS
Lowest Renter-Occupied
Philadelphia
Compare Zip Codes
Map of Zip Codes with the Lowest Percentage of Renter-Occupied Units in Philadelphia
81.5%
14.7%
Zip Codes with the Lowest Percentage of Renter-Occupied Units in Philadelphia, PA
| Zip Code | % Renter-Occupied | vs State | vs National | |
| 1. | 19108 | 14.7% | 30.8%(-16.1)#450 | 35.2%(-20.5)#7,699 |
| 2. | 19137 | 17.3% | 30.8%(-13.5)#614 | 35.2%(-17.9)#10,219 |
| 3. | 19150 | 19.2% | 30.8%(-11.6)#736 | 35.2%(-16.0)#12,084 |
| 4. | 19154 | 24.4% | 30.8%(-6.39)#1,008 | 35.2%(-10.8)#16,954 |
| 5. | 19114 | 32.9% | 30.8%(+2.10)#1,333 | 35.2%(-2.27)#22,737 |
| 6. | 19120 | 34.9% | 30.8%(+4.13)#1,371 | 35.2%(-0.239)#23,717 |
| 7. | 19119 | 35.4% | 30.8%(+4.61)#1,383 | 35.2%(+0.234)#23,947 |
| 8. | 19148 | 35.4% | 30.8%(+4.63)#1,385 | 35.2%(+0.255)#23,952 |
| 9. | 19138 | 35.7% | 30.8%(+4.93)#1,390 | 35.2%(+0.561)#24,093 |
| 10. | 19124 | 36.5% | 30.8%(+5.65)#1,408 | 35.2%(+1.27)#24,368 |
| 11. | 19151 | 37.1% | 30.8%(+6.26)#1,423 | 35.2%(+1.89)#24,654 |
| 12. | 19115 | 37.4% | 30.8%(+6.62)#1,433 | 35.2%(+2.25)#24,808 |
| 13. | 19126 | 37.9% | 30.8%(+7.12)#1,441 | 35.2%(+2.75)#24,980 |
| 14. | 19135 | 38.8% | 30.8%(+7.99)#1,454 | 35.2%(+3.62)#25,306 |
| 15. | 19136 | 38.9% | 30.8%(+8.06)#1,456 | 35.2%(+3.68)#25,332 |
| 16. | 19152 | 40.4% | 30.8%(+9.54)#1,474 | 35.2%(+5.17)#25,801 |
| 17. | 19125 | 40.9% | 30.8%(+10.1)#1,477 | 35.2%(+5.74)#25,962 |
| 18. | 19145 | 41.4% | 30.8%(+10.6)#1,480 | 35.2%(+6.20)#26,103 |
| 19. | 19116 | 42.2% | 30.8%(+11.4)#1,492 | 35.2%(+6.99)#26,312 |
| 20. | 19128 | 43.2% | 30.8%(+12.4)#1,501 | 35.2%(+8.04)#26,578 |
| 21. | 19147 | 43.3% | 30.8%(+12.5)#1,504 | 35.2%(+8.11)#26,601 |
| 22. | 19149 | 44.6% | 30.8%(+13.7)#1,519 | 35.2%(+9.37)#26,930 |
| 23. | 19111 | 45.1% | 30.8%(+14.3)#1,525 | 35.2%(+9.90)#27,066 |
| 24. | 19134 | 46.0% | 30.8%(+15.2)#1,533 | 35.2%(+10.8)#27,253 |
| 25. | 19140 | 46.9% | 30.8%(+16.1)#1,542 | 35.2%(+11.7)#27,449 |
| 26. | 19146 | 48.9% | 30.8%(+18.1)#1,555 | 35.2%(+13.7)#27,812 |
| 27. | 19141 | 49.2% | 30.8%(+18.4)#1,556 | 35.2%(+14.1)#27,885 |
| 28. | 19118 | 49.4% | 30.8%(+18.6)#1,558 | 35.2%(+14.3)#27,915 |
| 29. | 19129 | 50.1% | 30.8%(+19.3)#1,560 | 35.2%(+14.9)#28,031 |
| 30. | 19153 | 50.2% | 30.8%(+19.4)#1,561 | 35.2%(+15.0)#28,052 |
| 31. | 19132 | 50.6% | 30.8%(+19.8)#1,566 | 35.2%(+15.4)#28,111 |
| 32. | 19143 | 52.2% | 30.8%(+21.4)#1,577 | 35.2%(+17.0)#28,364 |
| 33. | 19106 | 52.2% | 30.8%(+21.4)#1,578 | 35.2%(+17.1)#28,367 |
| 34. | 19142 | 53.4% | 30.8%(+22.6)#1,585 | 35.2%(+18.2)#28,547 |
| 35. | 19127 | 54.6% | 30.8%(+23.8)#1,591 | 35.2%(+19.4)#28,717 |
| 36. | 19131 | 56.0% | 30.8%(+25.2)#1,599 | 35.2%(+20.8)#28,898 |
| 37. | 19133 | 58.9% | 30.8%(+28.1)#1,610 | 35.2%(+23.7)#29,197 |
| 38. | 19139 | 60.3% | 30.8%(+29.5)#1,616 | 35.2%(+25.1)#29,330 |
| 39. | 19122 | 61.5% | 30.8%(+30.7)#1,621 | 35.2%(+26.3)#29,423 |
| 40. | 19130 | 61.5% | 30.8%(+30.7)#1,622 | 35.2%(+26.3)#29,426 |
| 41. | 19144 | 63.4% | 30.8%(+32.5)#1,629 | 35.2%(+28.2)#29,580 |
| 42. | 19121 | 66.8% | 30.8%(+35.9)#1,637 | 35.2%(+31.6)#29,855 |
| 43. | 19123 | 67.1% | 30.8%(+36.2)#1,639 | 35.2%(+31.9)#29,867 |
| 44. | 19103 | 69.7% | 30.8%(+38.9)#1,643 | 35.2%(+34.5)#30,022 |
| 45. | 19102 | 76.9% | 30.8%(+46.1)#1,657 | 35.2%(+41.7)#30,326 |
| 46. | 19104 | 81.0% | 30.8%(+50.2)#1,662 | 35.2%(+45.8)#30,456 |
| 47. | 19107 | 81.5% | 30.8%(+50.7)#1,663 | 35.2%(+46.3)#30,469 |
1
Common Questions
What are the Top 10 Zip Codes with the Lowest Percentage of Renter-Occupied Units in Philadelphia, PA?
Top 10 Zip Codes with the Lowest Percentage of Renter-Occupied Units in Philadelphia, PA are:
What zip code has the Lowest Percentage of Renter-Occupied Units in Philadelphia, PA?
19108 has the Lowest Percentage of Renter-Occupied Units in Philadelphia, PA with 14.7%.
What is the Percentage of Renter-Occupied Units in Philadelphia, PA?
Percentage of Renter-Occupied Units in Philadelphia is 47.8%.
What is the Percentage of Renter-Occupied Units in Pennsylvania?
Percentage of Renter-Occupied Units in Pennsylvania is 30.8%.
What is the Percentage of Renter-Occupied Units in the United States?
Percentage of Renter-Occupied Units in the United States is 35.2%.