Zip Codes with the Highest Percentage of Not-for-profit Organizations in Philadelphia, PA
RELATED REPORTS & OPTIONS
Not-for-profit Organizations
Philadelphia
Compare Zip Codes
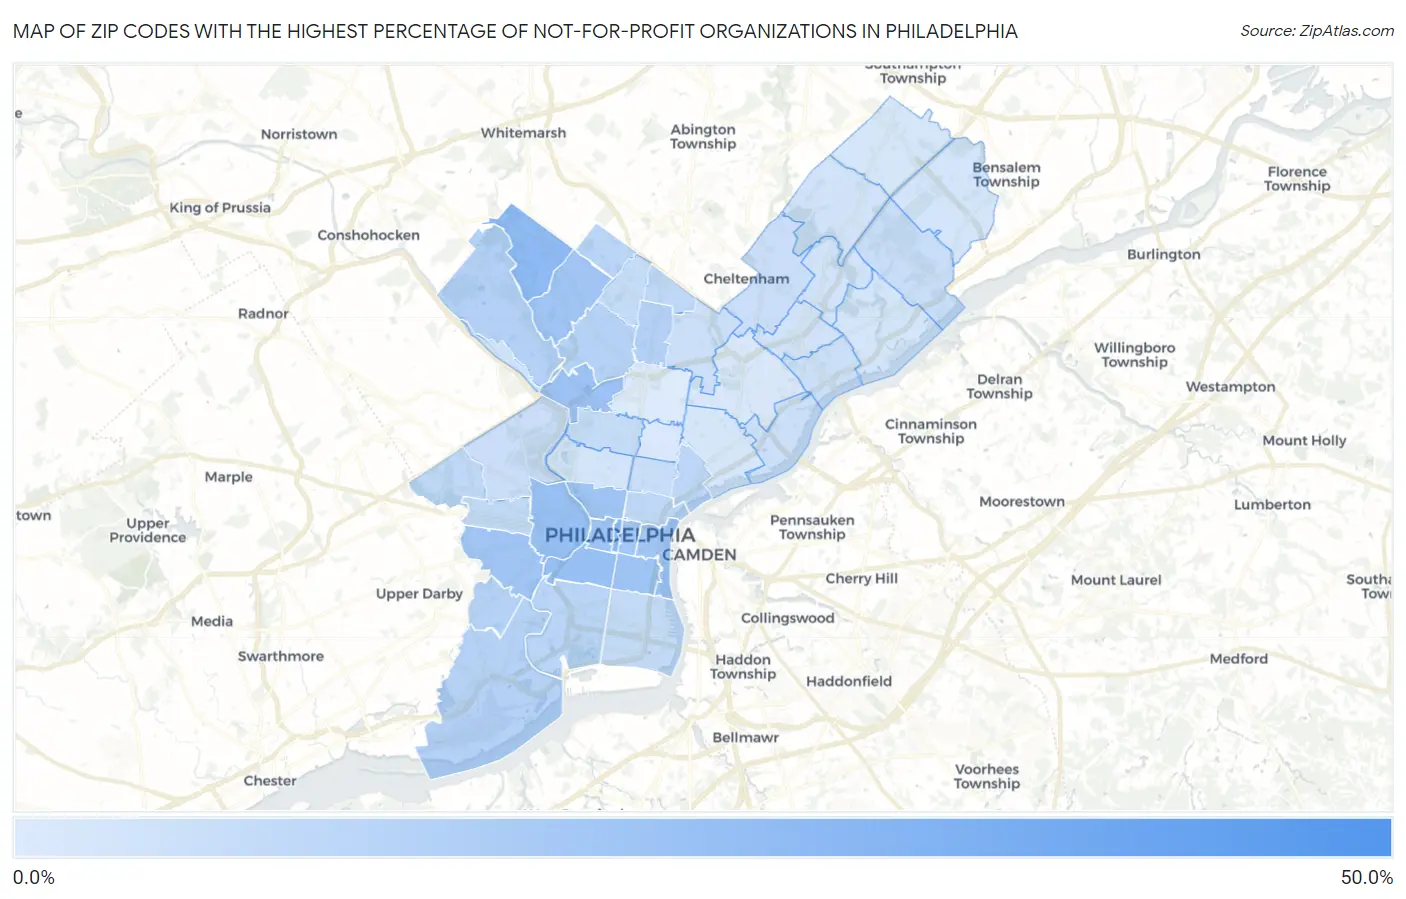
Map of Zip Codes with the Highest Percentage of Not-for-profit Organizations in Philadelphia
9.3%
43.5%
Zip Codes with the Highest Percentage of Not-for-profit Organizations in Philadelphia, PA
| Zip Code | % Employed in Not-for-profit | vs State | vs National | |
| 1. | 19108 | 43.5% | 12.4%(+31.1)#21 | 8.4%(+35.0)#199 |
| 2. | 19102 | 26.6% | 12.4%(+14.2)#51 | 8.4%(+18.2)#595 |
| 3. | 19118 | 25.8% | 12.4%(+13.4)#53 | 8.4%(+17.4)#640 |
| 4. | 19104 | 24.0% | 12.4%(+11.6)#71 | 8.4%(+15.6)#778 |
| 5. | 19146 | 23.9% | 12.4%(+11.5)#74 | 8.4%(+15.5)#791 |
| 6. | 19129 | 22.9% | 12.4%(+10.5)#85 | 8.4%(+14.5)#890 |
| 7. | 19130 | 22.5% | 12.4%(+10.1)#92 | 8.4%(+14.0)#954 |
| 8. | 19147 | 22.4% | 12.4%(+9.99)#94 | 8.4%(+14.0)#963 |
| 9. | 19103 | 22.2% | 12.4%(+9.79)#96 | 8.4%(+13.8)#989 |
| 10. | 19119 | 22.0% | 12.4%(+9.54)#99 | 8.4%(+13.5)#1,009 |
| 11. | 19143 | 21.8% | 12.4%(+9.41)#101 | 8.4%(+13.4)#1,029 |
| 12. | 19107 | 21.6% | 12.4%(+9.15)#104 | 8.4%(+13.1)#1,065 |
| 13. | 19106 | 21.1% | 12.4%(+8.71)#110 | 8.4%(+12.7)#1,128 |
| 14. | 19141 | 17.8% | 12.4%(+5.39)#160 | 8.4%(+9.37)#1,757 |
| 15. | 19128 | 17.8% | 12.4%(+5.35)#162 | 8.4%(+9.33)#1,767 |
| 16. | 19144 | 17.5% | 12.4%(+5.07)#174 | 8.4%(+9.05)#1,863 |
| 17. | 19142 | 17.5% | 12.4%(+5.06)#175 | 8.4%(+9.04)#1,868 |
| 18. | 19153 | 17.3% | 12.4%(+4.90)#187 | 8.4%(+8.88)#1,927 |
| 19. | 19145 | 16.6% | 12.4%(+4.16)#226 | 8.4%(+8.14)#2,194 |
| 20. | 19150 | 16.5% | 12.4%(+4.12)#227 | 8.4%(+8.10)#2,210 |
| 21. | 19125 | 15.9% | 12.4%(+3.47)#263 | 8.4%(+7.45)#2,490 |
| 22. | 19123 | 15.5% | 12.4%(+3.08)#286 | 8.4%(+7.06)#2,680 |
| 23. | 19151 | 15.5% | 12.4%(+3.04)#291 | 8.4%(+7.02)#2,696 |
| 24. | 19126 | 15.3% | 12.4%(+2.85)#303 | 8.4%(+6.83)#2,791 |
| 25. | 19139 | 14.8% | 12.4%(+2.39)#330 | 8.4%(+6.37)#3,045 |
| 26. | 19148 | 14.6% | 12.4%(+2.18)#344 | 8.4%(+6.16)#3,176 |
| 27. | 19132 | 14.1% | 12.4%(+1.65)#385 | 8.4%(+5.63)#3,527 |
| 28. | 19138 | 14.0% | 12.4%(+1.61)#389 | 8.4%(+5.59)#3,565 |
| 29. | 19122 | 13.6% | 12.4%(+1.20)#429 | 8.4%(+5.18)#3,913 |
| 30. | 19114 | 13.3% | 12.4%(+0.837)#459 | 8.4%(+4.82)#4,254 |
| 31. | 19111 | 12.8% | 12.4%(+0.375)#507 | 8.4%(+4.36)#4,712 |
| 32. | 19131 | 12.8% | 12.4%(+0.367)#509 | 8.4%(+4.35)#4,723 |
| 33. | 19135 | 12.7% | 12.4%(+0.300)#515 | 8.4%(+4.28)#4,804 |
| 34. | 19120 | 12.7% | 12.4%(+0.281)#521 | 8.4%(+4.26)#4,830 |
| 35. | 19137 | 12.4% | 12.4%(-0.058)#554 | 8.4%(+3.92)#5,187 |
| 36. | 19152 | 11.8% | 12.4%(-0.640)#634 | 8.4%(+3.34)#5,916 |
| 37. | 19127 | 11.6% | 12.4%(-0.839)#651 | 8.4%(+3.14)#6,202 |
| 38. | 19115 | 11.6% | 12.4%(-0.873)#659 | 8.4%(+3.11)#6,248 |
| 39. | 19149 | 11.4% | 12.4%(-0.993)#679 | 8.4%(+2.99)#6,411 |
| 40. | 19136 | 11.3% | 12.4%(-1.13)#692 | 8.4%(+2.85)#6,584 |
| 41. | 19121 | 11.3% | 12.4%(-1.14)#695 | 8.4%(+2.84)#6,616 |
| 42. | 19154 | 11.1% | 12.4%(-1.36)#734 | 8.4%(+2.62)#6,958 |
| 43. | 19134 | 10.8% | 12.4%(-1.67)#773 | 8.4%(+2.31)#7,446 |
| 44. | 19116 | 10.6% | 12.4%(-1.86)#799 | 8.4%(+2.12)#7,793 |
| 45. | 19124 | 10.3% | 12.4%(-2.14)#840 | 8.4%(+1.84)#8,321 |
| 46. | 19133 | 9.6% | 12.4%(-2.85)#950 | 8.4%(+1.13)#9,796 |
| 47. | 19140 | 9.3% | 12.4%(-3.16)#988 | 8.4%(+0.815)#10,443 |
1
Common Questions
What are the Top 10 Zip Codes with the Highest Percentage of Not-for-profit Organizations in Philadelphia, PA?
Top 10 Zip Codes with the Highest Percentage of Not-for-profit Organizations in Philadelphia, PA are:
What zip code has the Highest Percentage of Not-for-profit Organizations in Philadelphia, PA?
19108 has the Highest Percentage of Not-for-profit Organizations in Philadelphia, PA with 43.5%.
What is the Percentage of Not-for-profit Organizations in Philadelphia, PA?
Percentage of Not-for-profit Organizations in Philadelphia is 15.8%.
What is the Percentage of Not-for-profit Organizations in Pennsylvania?
Percentage of Not-for-profit Organizations in Pennsylvania is 12.4%.
What is the Percentage of Not-for-profit Organizations in the United States?
Percentage of Not-for-profit Organizations in the United States is 8.4%.