Zip Codes with the Most Immigrants from Western Asia in Philadelphia, PA
RELATED REPORTS & OPTIONS
Western Asia
Philadelphia
Compare Zip Codes
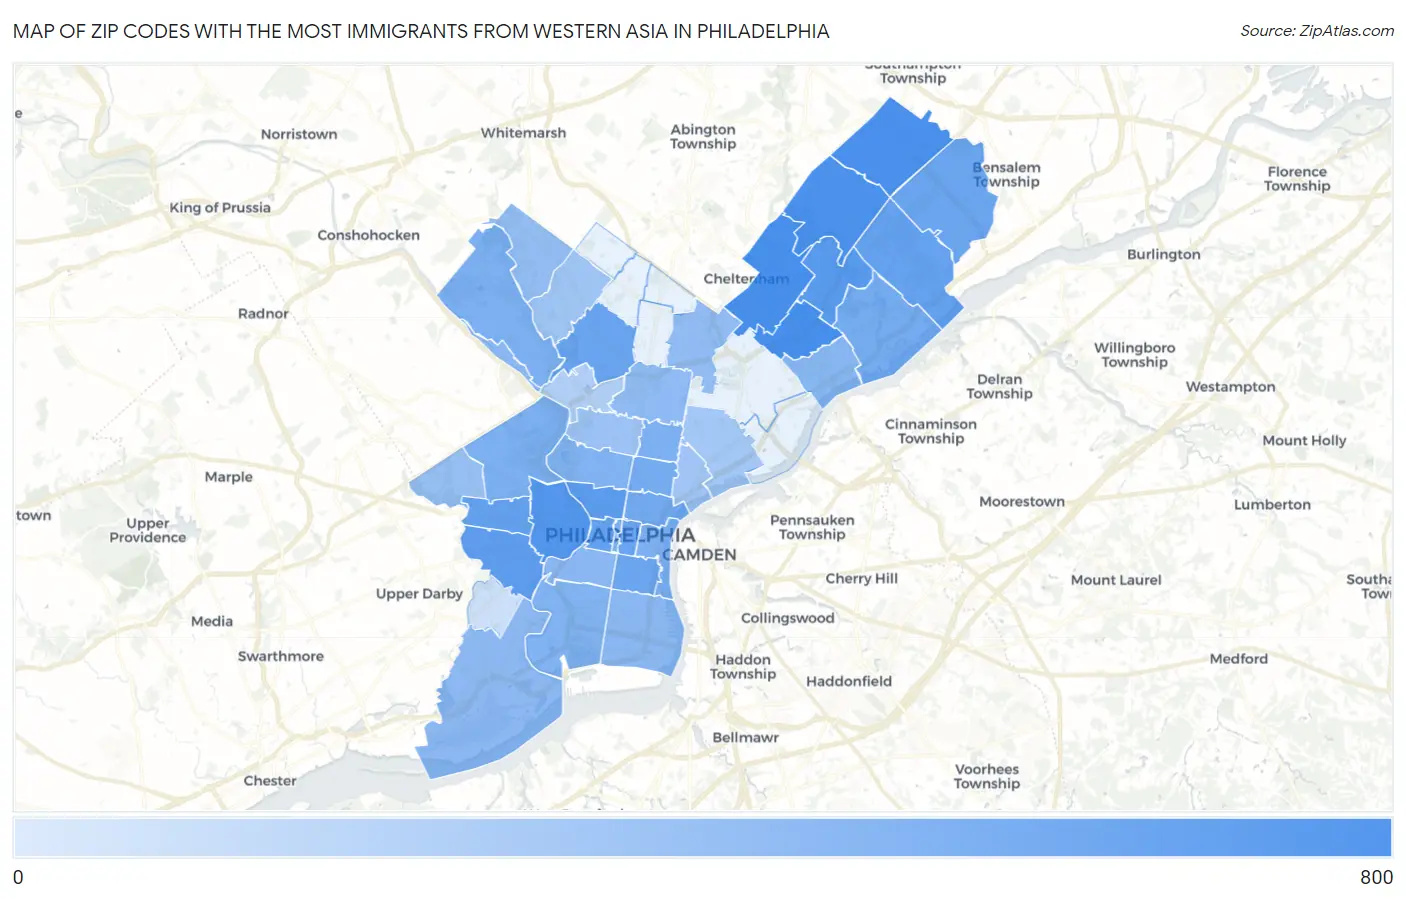
Map of Zip Codes with the Most Immigrants from Western Asia in Philadelphia
1
763
Zip Codes with the Most Immigrants from Western Asia in Philadelphia, PA
| Zip Code | Western Asia | vs State | vs National | |
| 1. | 19149 | 763 | 27,662(2.76%)#2 | 1,204,112(0.06%)#214 |
| 2. | 19111 | 731 | 27,662(2.64%)#3 | 1,204,112(0.06%)#238 |
| 3. | 19116 | 687 | 27,662(2.48%)#5 | 1,204,112(0.06%)#264 |
| 4. | 19115 | 614 | 27,662(2.22%)#6 | 1,204,112(0.05%)#319 |
| 5. | 19104 | 461 | 27,662(1.67%)#9 | 1,204,112(0.04%)#506 |
| 6. | 19152 | 384 | 27,662(1.39%)#11 | 1,204,112(0.03%)#664 |
| 7. | 19130 | 324 | 27,662(1.17%)#16 | 1,204,112(0.03%)#837 |
| 8. | 19143 | 267 | 27,662(0.97%)#19 | 1,204,112(0.02%)#1,079 |
| 9. | 19139 | 222 | 27,662(0.80%)#23 | 1,204,112(0.02%)#1,343 |
| 10. | 19103 | 213 | 27,662(0.77%)#27 | 1,204,112(0.02%)#1,407 |
| 11. | 19114 | 206 | 27,662(0.74%)#31 | 1,204,112(0.02%)#1,461 |
| 12. | 19107 | 164 | 27,662(0.59%)#42 | 1,204,112(0.01%)#1,853 |
| 13. | 19144 | 163 | 27,662(0.59%)#43 | 1,204,112(0.01%)#1,856 |
| 14. | 19154 | 147 | 27,662(0.53%)#49 | 1,204,112(0.01%)#2,009 |
| 15. | 19147 | 145 | 27,662(0.52%)#51 | 1,204,112(0.01%)#2,039 |
| 16. | 19123 | 104 | 27,662(0.38%)#70 | 1,204,112(0.01%)#2,675 |
| 17. | 19136 | 101 | 27,662(0.37%)#72 | 1,204,112(0.01%)#2,717 |
| 18. | 19122 | 94 | 27,662(0.34%)#80 | 1,204,112(0.01%)#2,866 |
| 19. | 19131 | 75 | 27,662(0.27%)#96 | 1,204,112(0.01%)#3,323 |
| 20. | 19128 | 75 | 27,662(0.27%)#97 | 1,204,112(0.01%)#3,328 |
| 21. | 19133 | 71 | 27,662(0.26%)#100 | 1,204,112(0.01%)#3,422 |
| 22. | 19106 | 68 | 27,662(0.25%)#105 | 1,204,112(0.01%)#3,505 |
| 23. | 19102 | 68 | 27,662(0.25%)#107 | 1,204,112(0.01%)#3,512 |
| 24. | 19145 | 60 | 27,662(0.22%)#123 | 1,204,112(0.00%)#3,756 |
| 25. | 19121 | 58 | 27,662(0.21%)#125 | 1,204,112(0.00%)#3,830 |
| 26. | 19135 | 43 | 27,662(0.16%)#154 | 1,204,112(0.00%)#4,411 |
| 27. | 19148 | 40 | 27,662(0.14%)#161 | 1,204,112(0.00%)#4,546 |
| 28. | 19146 | 39 | 27,662(0.14%)#165 | 1,204,112(0.00%)#4,609 |
| 29. | 19127 | 37 | 27,662(0.13%)#170 | 1,204,112(0.00%)#4,733 |
| 30. | 19153 | 35 | 27,662(0.13%)#174 | 1,204,112(0.00%)#4,822 |
| 31. | 19140 | 30 | 27,662(0.11%)#190 | 1,204,112(0.00%)#5,088 |
| 32. | 19120 | 29 | 27,662(0.10%)#195 | 1,204,112(0.00%)#5,147 |
| 33. | 19118 | 26 | 27,662(0.09%)#201 | 1,204,112(0.00%)#5,395 |
| 34. | 19151 | 21 | 27,662(0.08%)#219 | 1,204,112(0.00%)#5,728 |
| 35. | 19132 | 16 | 27,662(0.06%)#245 | 1,204,112(0.00%)#6,176 |
| 36. | 19119 | 14 | 27,662(0.05%)#257 | 1,204,112(0.00%)#6,388 |
| 37. | 19125 | 13 | 27,662(0.05%)#274 | 1,204,112(0.00%)#6,522 |
| 38. | 19134 | 12 | 27,662(0.04%)#277 | 1,204,112(0.00%)#6,611 |
| 39. | 19129 | 6 | 27,662(0.02%)#323 | 1,204,112(0.00%)#7,446 |
| 40. | 19142 | 1 | 27,662(0.00%)#357 | 1,204,112(0.00%)#8,012 |
1
Common Questions
What are the Top 10 Zip Codes with the Most Immigrants from Western Asia in Philadelphia, PA?
Top 10 Zip Codes with the Most Immigrants from Western Asia in Philadelphia, PA are:
What zip code has the Most Immigrants from Western Asia in Philadelphia, PA?
19149 has the Most Immigrants from Western Asia in Philadelphia, PA with 763.
What is the Total Immigrants from Western Asia in Philadelphia, PA?
Total Immigrants from Western Asia in Philadelphia is 6,627.
What is the Total Immigrants from Western Asia in Pennsylvania?
Total Immigrants from Western Asia in Pennsylvania is 27,662.
What is the Total Immigrants from Western Asia in the United States?
Total Immigrants from Western Asia in the United States is 1,204,112.