Zip Codes with the Highest Percentage of Population with a Degree in Literature and Languages in Philadelphia, PA
RELATED REPORTS & OPTIONS
Literature and Languages
Philadelphia
Compare Zip Codes
Map of Zip Codes with the Highest Percentage of Population with a Degree in Literature and Languages in Philadelphia
0.55%
10.6%
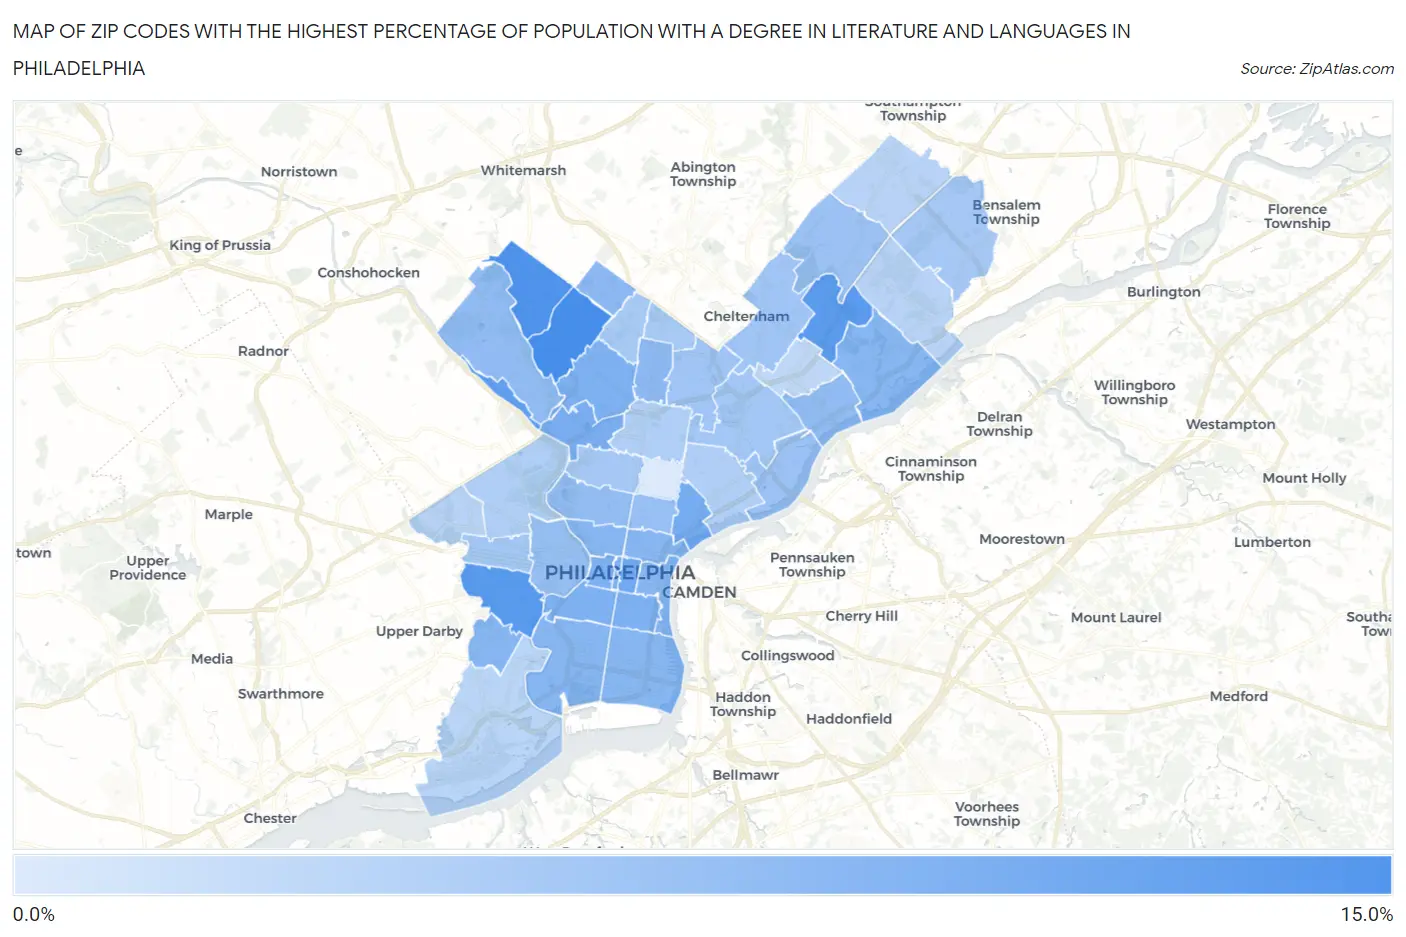
Zip Codes with the Highest Percentage of Population with a Degree in Literature and Languages in Philadelphia, PA
| Zip Code | % Graduates | vs State | vs National | |
| 1. | 19119 | 10.6% | 4.3%(+6.34)#71 | 4.4%(+6.22)#1,583 |
| 2. | 19118 | 10.1% | 4.3%(+5.84)#77 | 4.4%(+5.72)#1,771 |
| 3. | 19143 | 9.5% | 4.3%(+5.19)#89 | 4.4%(+5.07)#2,052 |
| 4. | 19152 | 9.4% | 4.3%(+5.09)#92 | 4.4%(+4.97)#2,100 |
| 5. | 19127 | 8.9% | 4.3%(+4.61)#104 | 4.4%(+4.49)#2,371 |
| 6. | 19107 | 7.5% | 4.3%(+3.22)#144 | 4.4%(+3.10)#3,424 |
| 7. | 19125 | 7.4% | 4.3%(+3.11)#150 | 4.4%(+2.99)#3,556 |
| 8. | 19129 | 7.0% | 4.3%(+2.75)#171 | 4.4%(+2.63)#3,949 |
| 9. | 19146 | 6.8% | 4.3%(+2.49)#188 | 4.4%(+2.37)#4,263 |
| 10. | 19144 | 6.8% | 4.3%(+2.48)#190 | 4.4%(+2.36)#4,280 |
| 11. | 19147 | 6.8% | 4.3%(+2.47)#191 | 4.4%(+2.35)#4,287 |
| 12. | 19103 | 6.7% | 4.3%(+2.44)#195 | 4.4%(+2.32)#4,330 |
| 13. | 19102 | 6.6% | 4.3%(+2.30)#205 | 4.4%(+2.18)#4,512 |
| 14. | 19130 | 6.2% | 4.3%(+1.94)#231 | 4.4%(+1.82)#5,046 |
| 15. | 19145 | 6.2% | 4.3%(+1.94)#232 | 4.4%(+1.82)#5,049 |
| 16. | 19136 | 6.2% | 4.3%(+1.89)#236 | 4.4%(+1.77)#5,120 |
| 17. | 19148 | 6.2% | 4.3%(+1.86)#239 | 4.4%(+1.74)#5,172 |
| 18. | 19142 | 6.1% | 4.3%(+1.85)#242 | 4.4%(+1.73)#5,201 |
| 19. | 19123 | 6.1% | 4.3%(+1.82)#243 | 4.4%(+1.70)#5,265 |
| 20. | 19106 | 6.1% | 4.3%(+1.77)#246 | 4.4%(+1.65)#5,335 |
| 21. | 19150 | 5.9% | 4.3%(+1.62)#255 | 4.4%(+1.50)#5,581 |
| 22. | 19141 | 5.8% | 4.3%(+1.52)#265 | 4.4%(+1.40)#5,747 |
| 23. | 19128 | 5.5% | 4.3%(+1.25)#289 | 4.4%(+1.13)#6,245 |
| 24. | 19135 | 5.5% | 4.3%(+1.21)#295 | 4.4%(+1.09)#6,315 |
| 25. | 19121 | 5.4% | 4.3%(+1.08)#308 | 4.4%(+0.958)#6,588 |
| 26. | 19104 | 5.3% | 4.3%(+1.02)#314 | 4.4%(+0.902)#6,698 |
| 27. | 19122 | 5.1% | 4.3%(+0.767)#345 | 4.4%(+0.647)#7,218 |
| 28. | 19115 | 4.9% | 4.3%(+0.587)#370 | 4.4%(+0.466)#7,686 |
| 29. | 19137 | 4.8% | 4.3%(+0.508)#375 | 4.4%(+0.387)#7,893 |
| 30. | 19111 | 4.5% | 4.3%(+0.202)#428 | 4.4%(+0.081)#8,739 |
| 31. | 19120 | 4.5% | 4.3%(+0.190)#430 | 4.4%(+0.070)#8,766 |
| 32. | 19124 | 4.4% | 4.3%(+0.101)#445 | 4.4%(-0.019)#9,017 |
| 33. | 19139 | 4.3% | 4.3%(-0.002)#458 | 4.4%(-0.122)#9,347 |
| 34. | 19132 | 4.2% | 4.3%(-0.066)#468 | 4.4%(-0.186)#9,534 |
| 35. | 19154 | 4.2% | 4.3%(-0.121)#479 | 4.4%(-0.242)#9,701 |
| 36. | 19126 | 4.0% | 4.3%(-0.293)#517 | 4.4%(-0.414)#10,188 |
| 37. | 19138 | 4.0% | 4.3%(-0.331)#522 | 4.4%(-0.451)#10,308 |
| 38. | 19140 | 3.4% | 4.3%(-0.904)#628 | 4.4%(-1.02)#12,236 |
| 39. | 19134 | 3.4% | 4.3%(-0.912)#629 | 4.4%(-1.03)#12,255 |
| 40. | 19131 | 3.3% | 4.3%(-0.958)#638 | 4.4%(-1.08)#12,424 |
| 41. | 19151 | 3.0% | 4.3%(-1.30)#705 | 4.4%(-1.42)#13,616 |
| 42. | 19116 | 3.0% | 4.3%(-1.31)#706 | 4.4%(-1.43)#13,655 |
| 43. | 19114 | 3.0% | 4.3%(-1.34)#710 | 4.4%(-1.46)#13,739 |
| 44. | 19153 | 2.8% | 4.3%(-1.54)#750 | 4.4%(-1.66)#14,437 |
| 45. | 19149 | 2.4% | 4.3%(-1.86)#826 | 4.4%(-1.99)#15,575 |
| 46. | 19133 | 0.55% | 4.3%(-3.74)#1,144 | 4.4%(-3.86)#21,145 |
1
Common Questions
What are the Top 10 Zip Codes with the Highest Percentage of Population with a Degree in Literature and Languages in Philadelphia, PA?
Top 10 Zip Codes with the Highest Percentage of Population with a Degree in Literature and Languages in Philadelphia, PA are:
What zip code has the Highest Percentage of Population with a Degree in Literature and Languages in Philadelphia, PA?
19119 has the Highest Percentage of Population with a Degree in Literature and Languages in Philadelphia, PA with 10.6%.
What is the Percentage of Population with a Degree in Literature and Languages in Philadelphia, PA?
Percentage of Population with a Degree in Literature and Languages in Philadelphia is 6.0%.
What is the Percentage of Population with a Degree in Literature and Languages in Pennsylvania?
Percentage of Population with a Degree in Literature and Languages in Pennsylvania is 4.3%.
What is the Percentage of Population with a Degree in Literature and Languages in the United States?
Percentage of Population with a Degree in Literature and Languages in the United States is 4.4%.