Zip Codes with the Highest Percentage of Immigrants from Eastern Asia in Mckeesport, PA
RELATED REPORTS & OPTIONS
Eastern Asia
Mckeesport
Compare Zip Codes
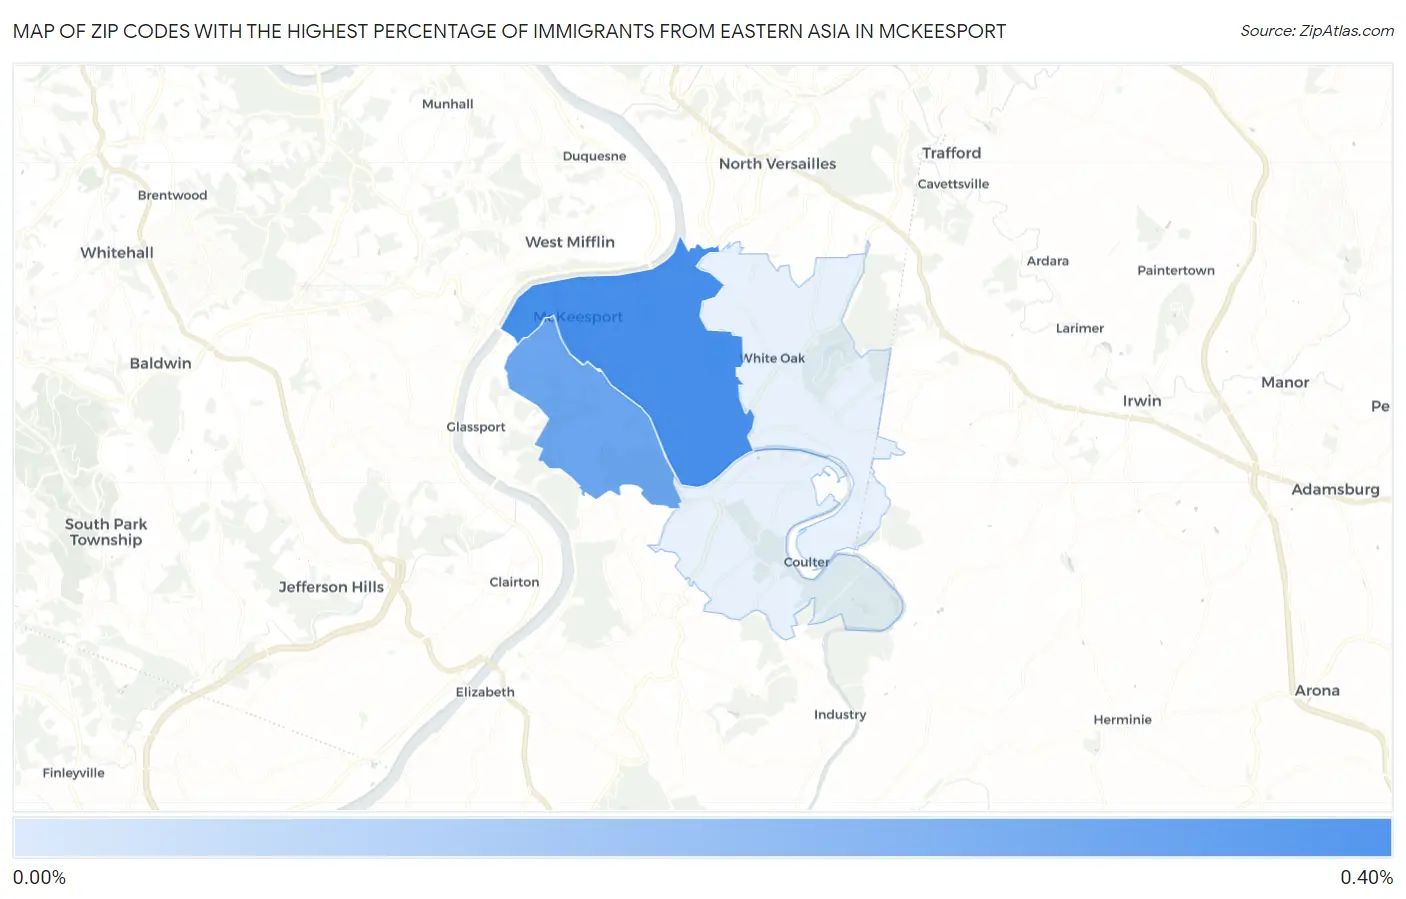
Map of Zip Codes with the Highest Percentage of Immigrants from Eastern Asia in Mckeesport
0.30%
0.39%
Zip Codes with the Highest Percentage of Immigrants from Eastern Asia in Mckeesport, PA
| Zip Code | Eastern Asia | vs State | vs National | |
| 1. | 15132 | 0.39% | 0.84%(-0.450)#364 | 1.28%(-0.884)#7,650 |
| 2. | 15133 | 0.30% | 0.84%(-0.544)#433 | 1.28%(-0.977)#8,797 |
1
Common Questions
What are the Top 3 Zip Codes with the Highest Percentage of Immigrants from Eastern Asia in Mckeesport, PA?
Top 3 Zip Codes with the Highest Percentage of Immigrants from Eastern Asia in Mckeesport, PA are:
What zip code has the Highest Percentage of Immigrants from Eastern Asia in Mckeesport, PA?
15132 has the Highest Percentage of Immigrants from Eastern Asia in Mckeesport, PA with 0.39%.
What is the Percentage of Immigrants from Eastern Asia in Mckeesport, PA?
Percentage of Immigrants from Eastern Asia in Mckeesport is 0.43%.
What is the Percentage of Immigrants from Eastern Asia in Pennsylvania?
Percentage of Immigrants from Eastern Asia in Pennsylvania is 0.84%.
What is the Percentage of Immigrants from Eastern Asia in the United States?
Percentage of Immigrants from Eastern Asia in the United States is 1.28%.