Zip Codes with the Highest Percentage of Immigrants from Philippines in Mckeesport, PA
RELATED REPORTS & OPTIONS
Philippines
Mckeesport
Compare Zip Codes
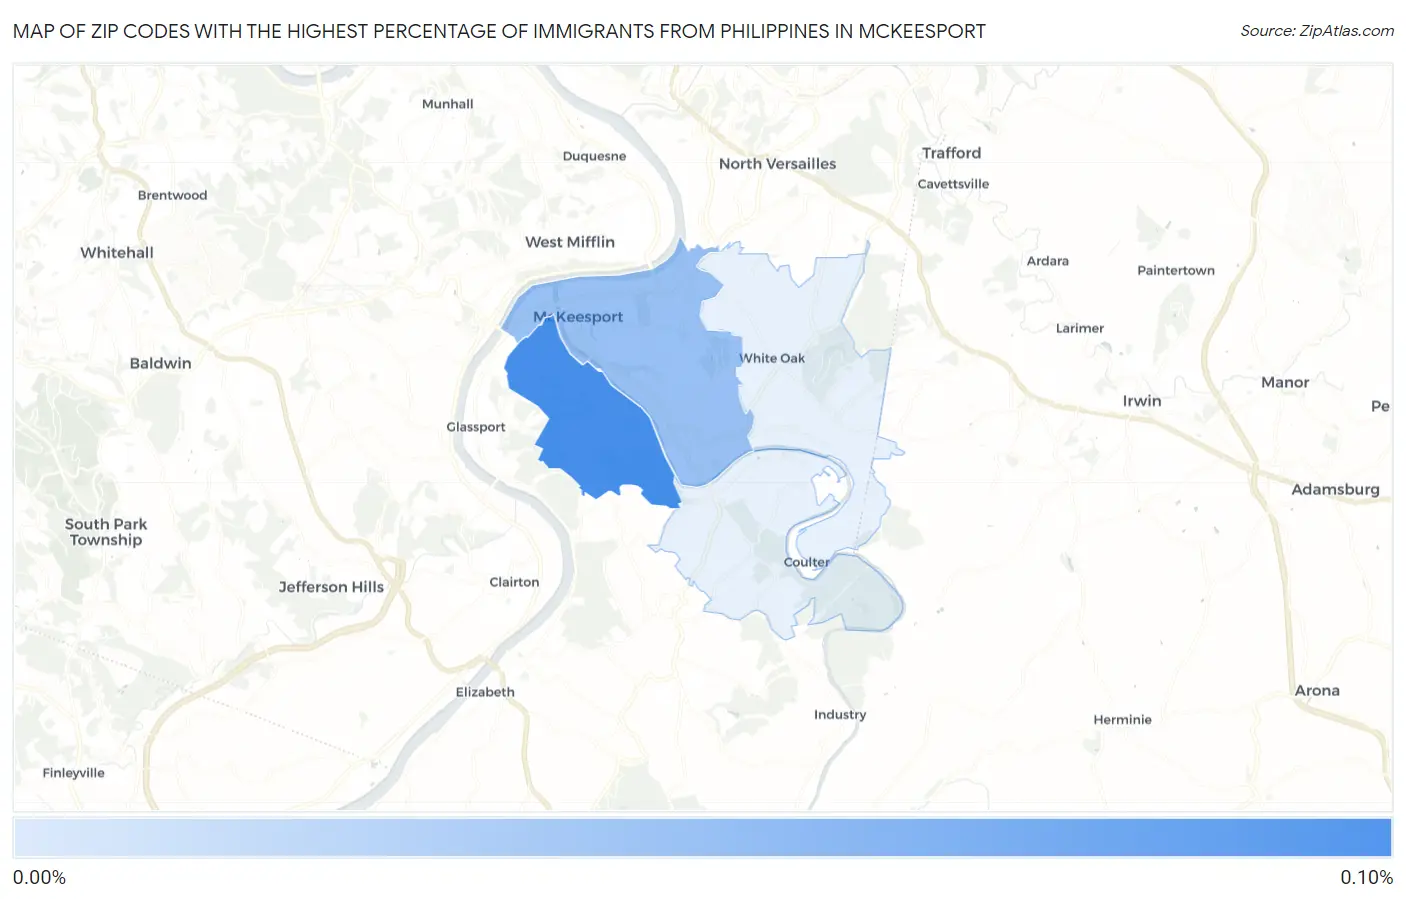
Map of Zip Codes with the Highest Percentage of Immigrants from Philippines in Mckeesport
0.046%
0.099%
Zip Codes with the Highest Percentage of Immigrants from Philippines in Mckeesport, PA
| Zip Code | Philippines | vs State | vs National | |
| 1. | 15133 | 0.099% | 0.16%(-0.063)#-1 | 0.60%(-0.500)#0 |
| 2. | 15132 | 0.046% | 0.16%(-0.116)#0 | 0.60%(-0.553)#1 |
1
Common Questions
What are the Top 3 Zip Codes with the Highest Percentage of Immigrants from Philippines in Mckeesport, PA?
Top 3 Zip Codes with the Highest Percentage of Immigrants from Philippines in Mckeesport, PA are:
What zip code has the Highest Percentage of Immigrants from Philippines in Mckeesport, PA?
15133 has the Highest Percentage of Immigrants from Philippines in Mckeesport, PA with 0.099%.
What is the Percentage of Immigrants from Philippines in Mckeesport, PA?
Percentage of Immigrants from Philippines in Mckeesport is 0.051%.
What is the Percentage of Immigrants from Philippines in Pennsylvania?
Percentage of Immigrants from Philippines in Pennsylvania is 0.16%.
What is the Percentage of Immigrants from Philippines in the United States?
Percentage of Immigrants from Philippines in the United States is 0.60%.