Zip Codes with the Most Immigrants from South America in Mckeesport, PA
RELATED REPORTS & OPTIONS
South America
Mckeesport
Compare Zip Codes
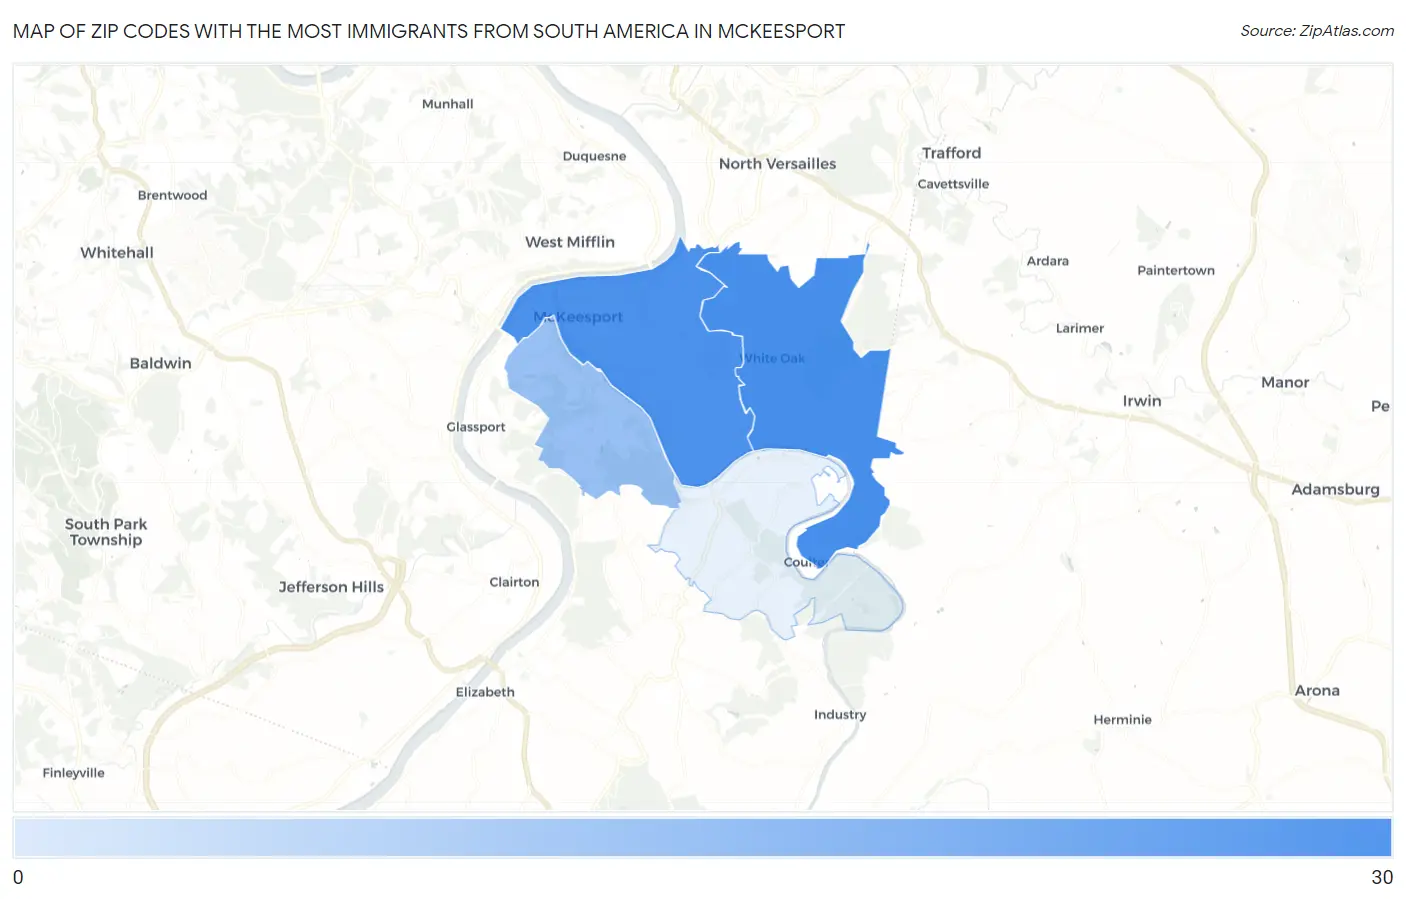
Map of Zip Codes with the Most Immigrants from South America in Mckeesport
4
30
Zip Codes with the Most Immigrants from South America in Mckeesport, PA
| Zip Code | South America | vs State | vs National | |
| 1. | 15131 | 30 | 63,185(0.05%)#324 | 3,636,375(0.00%)#7,989 |
| 2. | 15132 | 27 | 63,185(0.04%)#336 | 3,636,375(0.00%)#8,221 |
| 3. | 15133 | 4 | 63,185(0.01%)#540 | 3,636,375(0.00%)#11,557 |
1
Common Questions
What are the Top 3 Zip Codes with the Most Immigrants from South America in Mckeesport, PA?
Top 3 Zip Codes with the Most Immigrants from South America in Mckeesport, PA are:
What zip code has the Most Immigrants from South America in Mckeesport, PA?
15131 has the Most Immigrants from South America in Mckeesport, PA with 30.
What is the Total Immigrants from South America in Mckeesport, PA?
Total Immigrants from South America in Mckeesport is 23.
What is the Total Immigrants from South America in Pennsylvania?
Total Immigrants from South America in Pennsylvania is 63,185.
What is the Total Immigrants from South America in the United States?
Total Immigrants from South America in the United States is 3,636,375.