Catawissa borough, PA Map & Demographics
Catawissa borough Overview
$30,481
PER CAPITA INCOME
$71,500
AVG FAMILY INCOME
$48,950
AVG HOUSEHOLD INCOME
51.7%
WAGE / INCOME GAP [ % ]
48.3¢/ $1
WAGE / INCOME GAP [ $ ]
0.41
INEQUALITY / GINI INDEX
1,387
TOTAL POPULATION
640
MALE POPULATION
747
FEMALE POPULATION
85.68
MALES / 100 FEMALES
116.72
FEMALES / 100 MALES
43.9
MEDIAN AGE
2.7
AVG FAMILY SIZE
2.1
AVG HOUSEHOLD SIZE
826
LABOR FORCE [ PEOPLE ]
70.6%
PERCENT IN LABOR FORCE
5.4%
UNEMPLOYMENT RATE
Income in Catawissa borough
Income Overview in Catawissa borough
Per Capita Income in Catawissa borough is $30,481, while median incomes of families and households are $71,500 and $48,950 respectively.
| Characteristic | Number | Measure |
| Per Capita Income | 1,387 | $30,481 |
| Median Family Income | 354 | $71,500 |
| Mean Family Income | 354 | $80,032 |
| Median Household Income | 667 | $48,950 |
| Mean Household Income | 667 | $64,174 |
| Income Deficit | 354 | $0 |
| Wage / Income Gap (%) | 1,387 | 51.71% |
| Wage / Income Gap ($) | 1,387 | 48.29¢ per $1 |
| Gini / Inequality Index | 1,387 | 0.41 |
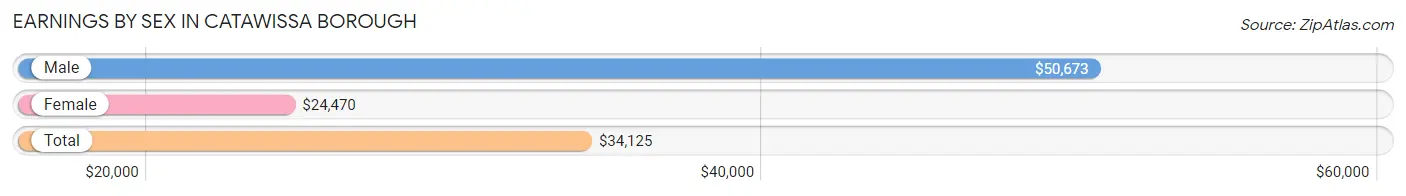
Earnings by Sex in Catawissa borough
Average Earnings in Catawissa borough are $34,125, $50,673 for men and $24,470 for women, a difference of 51.7%.
| Sex | Number | Average Earnings |
| Male | 382 (46.8%) | $50,673 |
| Female | 434 (53.2%) | $24,470 |
| Total | 816 (100.0%) | $34,125 |
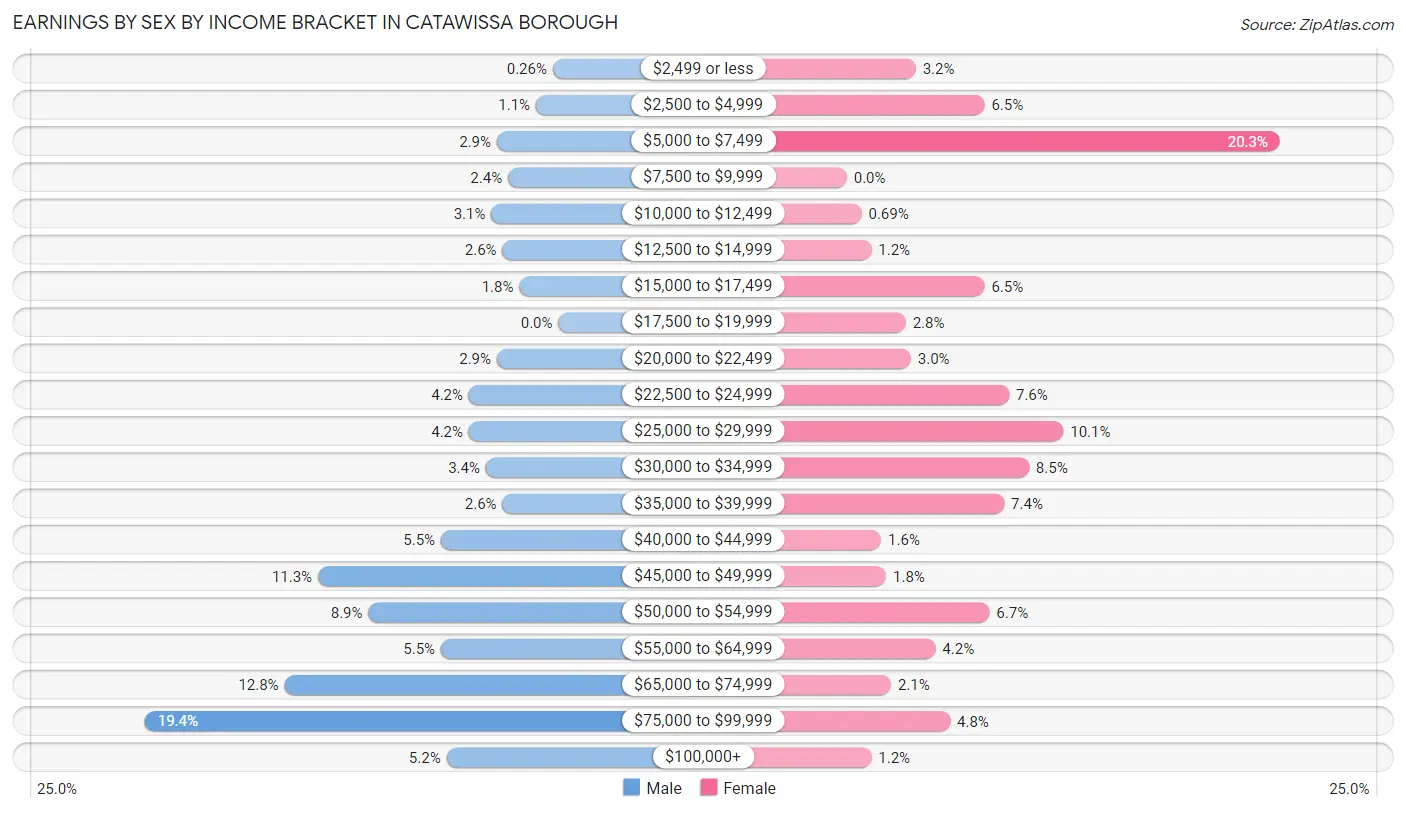
Earnings by Sex by Income Bracket in Catawissa borough
The most common earnings brackets in Catawissa borough are $75,000 to $99,999 for men (74 | 19.4%) and $5,000 to $7,499 for women (88 | 20.3%).
| Income | Male | Female |
| $2,499 or less | 1 (0.3%) | 14 (3.2%) |
| $2,500 to $4,999 | 4 (1.1%) | 28 (6.5%) |
| $5,000 to $7,499 | 11 (2.9%) | 88 (20.3%) |
| $7,500 to $9,999 | 9 (2.4%) | 0 (0.0%) |
| $10,000 to $12,499 | 12 (3.1%) | 3 (0.7%) |
| $12,500 to $14,999 | 10 (2.6%) | 5 (1.1%) |
| $15,000 to $17,499 | 7 (1.8%) | 28 (6.5%) |
| $17,500 to $19,999 | 0 (0.0%) | 12 (2.8%) |
| $20,000 to $22,499 | 11 (2.9%) | 13 (3.0%) |
| $22,500 to $24,999 | 16 (4.2%) | 33 (7.6%) |
| $25,000 to $29,999 | 16 (4.2%) | 44 (10.1%) |
| $30,000 to $34,999 | 13 (3.4%) | 37 (8.5%) |
| $35,000 to $39,999 | 10 (2.6%) | 32 (7.4%) |
| $40,000 to $44,999 | 21 (5.5%) | 7 (1.6%) |
| $45,000 to $49,999 | 43 (11.3%) | 8 (1.8%) |
| $50,000 to $54,999 | 34 (8.9%) | 29 (6.7%) |
| $55,000 to $64,999 | 21 (5.5%) | 18 (4.2%) |
| $65,000 to $74,999 | 49 (12.8%) | 9 (2.1%) |
| $75,000 to $99,999 | 74 (19.4%) | 21 (4.8%) |
| $100,000+ | 20 (5.2%) | 5 (1.1%) |
| Total | 382 (100.0%) | 434 (100.0%) |
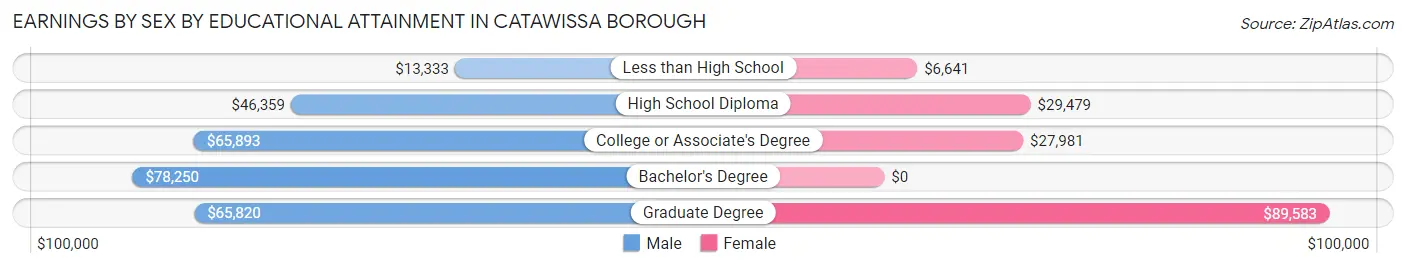
Earnings by Sex by Educational Attainment in Catawissa borough
Average earnings in Catawissa borough are $54,531 for men and $26,667 for women, a difference of 51.1%. Men with an educational attainment of bachelor's degree enjoy the highest average annual earnings of $78,250, while those with less than high school education earn the least with $13,333. Women with an educational attainment of graduate degree earn the most with the average annual earnings of $89,583, while those with less than high school education have the smallest earnings of $6,641.
| Educational Attainment | Male Income | Female Income |
| Less than High School | $13,333 | $6,641 |
| High School Diploma | $46,359 | $29,479 |
| College or Associate's Degree | $65,893 | $27,981 |
| Bachelor's Degree | $78,250 | $0 |
| Graduate Degree | $65,820 | $89,583 |
| Total | $54,531 | $26,667 |
Family Income in Catawissa borough
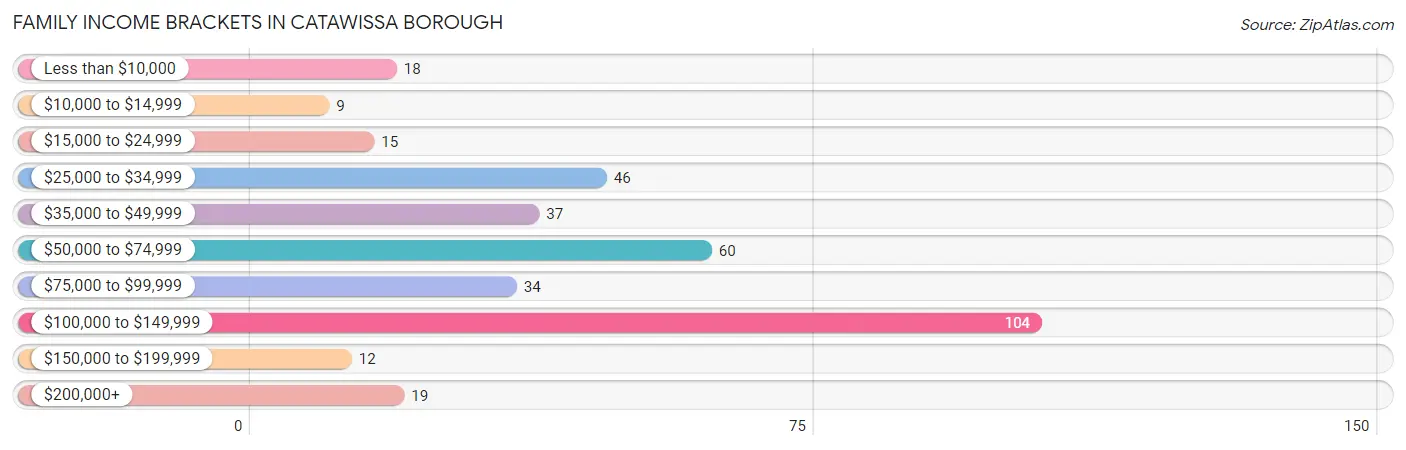
Family Income Brackets in Catawissa borough
According to the Catawissa borough family income data, there are 104 families falling into the $100,000 to $149,999 income range, which is the most common income bracket and makes up 29.4% of all families. Conversely, the $10,000 to $14,999 income bracket is the least frequent group with only 9 families (2.5%) belonging to this category.
| Income Bracket | # Families | % Families |
| Less than $10,000 | 18 | 5.1% |
| $10,000 to $14,999 | 9 | 2.5% |
| $15,000 to $24,999 | 15 | 4.2% |
| $25,000 to $34,999 | 46 | 13.0% |
| $35,000 to $49,999 | 37 | 10.5% |
| $50,000 to $74,999 | 60 | 16.9% |
| $75,000 to $99,999 | 34 | 9.6% |
| $100,000 to $149,999 | 104 | 29.4% |
| $150,000 to $199,999 | 12 | 3.4% |
| $200,000+ | 19 | 5.4% |
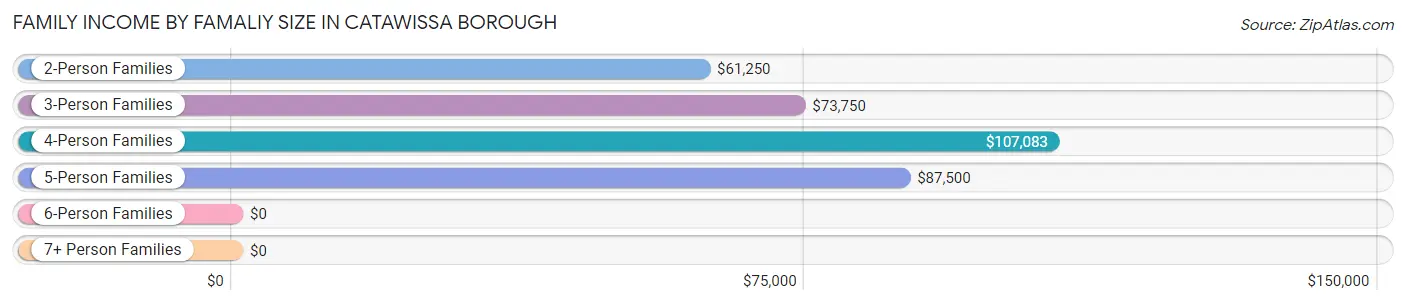
Family Income by Famaliy Size in Catawissa borough
4-person families (34 | 9.6%) account for the highest median family income in Catawissa borough with $107,083 per family, while 2-person families (220 | 62.2%) have the highest median income of $30,625 per family member.
| Income Bracket | # Families | Median Income |
| 2-Person Families | 220 (62.2%) | $61,250 |
| 3-Person Families | 72 (20.3%) | $73,750 |
| 4-Person Families | 34 (9.6%) | $107,083 |
| 5-Person Families | 20 (5.7%) | $87,500 |
| 6-Person Families | 5 (1.4%) | $0 |
| 7+ Person Families | 3 (0.9%) | $0 |
| Total | 354 (100.0%) | $71,500 |
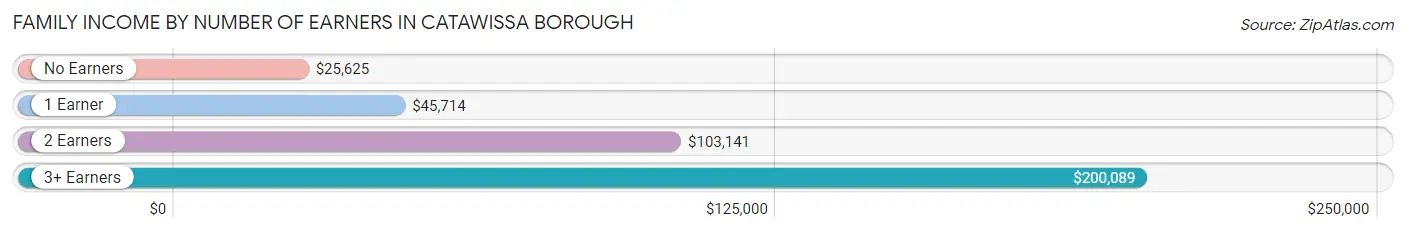
Family Income by Number of Earners in Catawissa borough
The median family income in Catawissa borough is $71,500, with families comprising 3+ earners (27) having the highest median family income of $200,089, while families with no earners (51) have the lowest median family income of $25,625, accounting for 7.6% and 14.4% of families, respectively.
| Number of Earners | # Families | Median Income |
| No Earners | 51 (14.4%) | $25,625 |
| 1 Earner | 122 (34.5%) | $45,714 |
| 2 Earners | 154 (43.5%) | $103,141 |
| 3+ Earners | 27 (7.6%) | $200,089 |
| Total | 354 (100.0%) | $71,500 |
Household Income in Catawissa borough
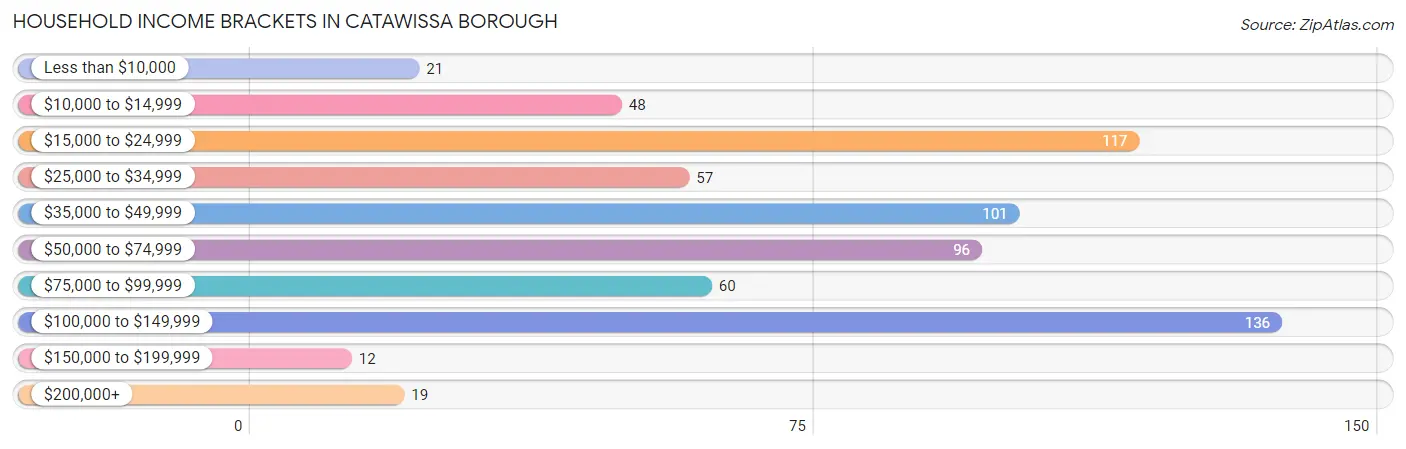
Household Income Brackets in Catawissa borough
With 136 households falling in the category, the $100,000 to $149,999 income range is the most frequent in Catawissa borough, accounting for 20.4% of all households. In contrast, only 12 households (1.8%) fall into the $150,000 to $199,999 income bracket, making it the least populous group.
| Income Bracket | # Households | % Households |
| Less than $10,000 | 21 | 3.1% |
| $10,000 to $14,999 | 48 | 7.2% |
| $15,000 to $24,999 | 117 | 17.5% |
| $25,000 to $34,999 | 57 | 8.5% |
| $35,000 to $49,999 | 101 | 15.1% |
| $50,000 to $74,999 | 96 | 14.4% |
| $75,000 to $99,999 | 60 | 9.0% |
| $100,000 to $149,999 | 136 | 20.4% |
| $150,000 to $199,999 | 12 | 1.8% |
| $200,000+ | 19 | 2.8% |
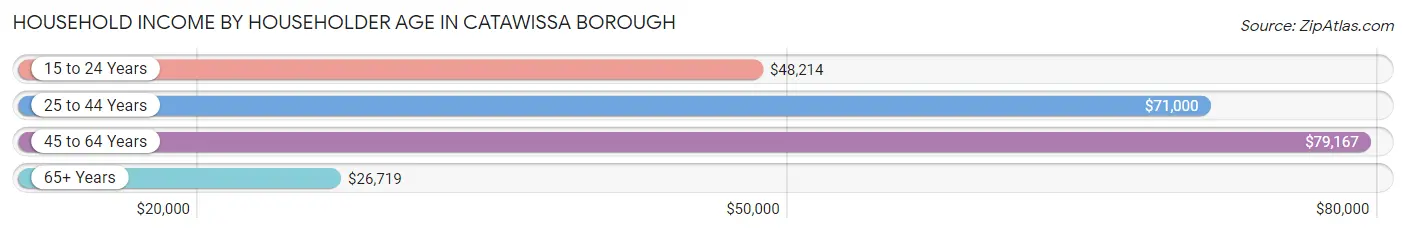
Household Income by Householder Age in Catawissa borough
The median household income in Catawissa borough is $48,950, with the highest median household income of $79,167 found in the 45 to 64 years age bracket for the primary householder. A total of 186 households (27.9%) fall into this category. Meanwhile, the 65+ years age bracket for the primary householder has the lowest median household income of $26,719, with 245 households (36.7%) in this group.
| Income Bracket | # Households | Median Income |
| 15 to 24 Years | 46 (6.9%) | $48,214 |
| 25 to 44 Years | 190 (28.5%) | $71,000 |
| 45 to 64 Years | 186 (27.9%) | $79,167 |
| 65+ Years | 245 (36.7%) | $26,719 |
| Total | 667 (100.0%) | $48,950 |
Poverty in Catawissa borough
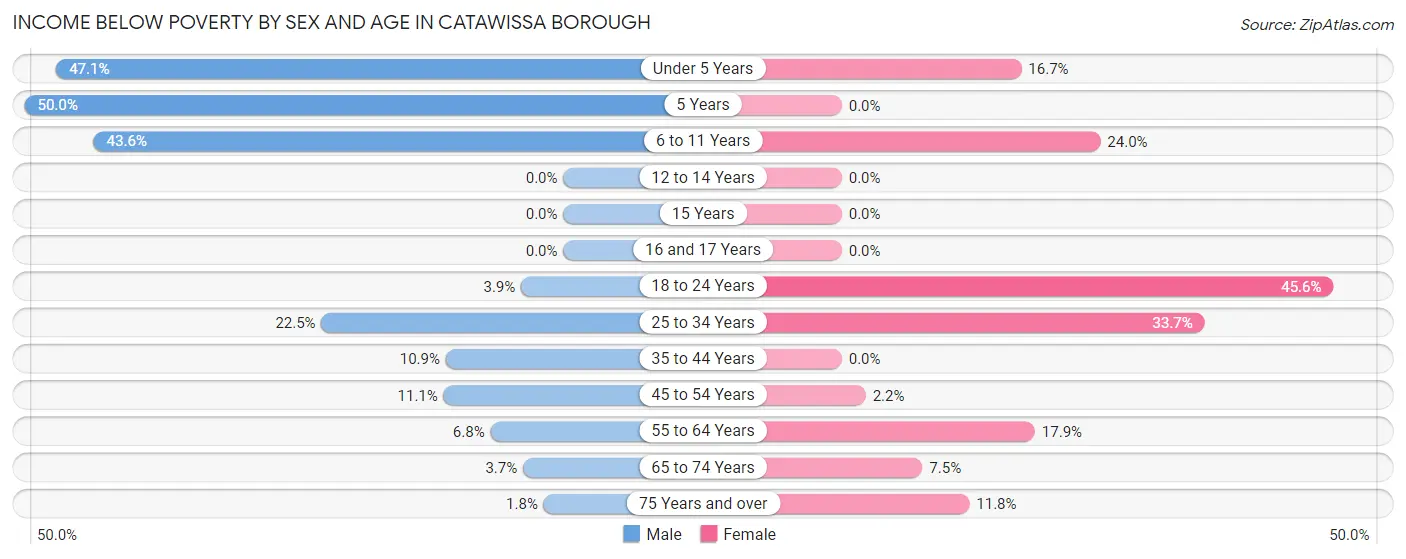
Income Below Poverty by Sex and Age in Catawissa borough
With 13.3% poverty level for males and 15.3% for females among the residents of Catawissa borough, 5 year old males and 18 to 24 year old females are the most vulnerable to poverty, with 3 males (50.0%) and 26 females (45.6%) in their respective age groups living below the poverty level.
| Age Bracket | Male | Female |
| Under 5 Years | 16 (47.1%) | 3 (16.7%) |
| 5 Years | 3 (50.0%) | 0 (0.0%) |
| 6 to 11 Years | 17 (43.6%) | 12 (24.0%) |
| 12 to 14 Years | 0 (0.0%) | 0 (0.0%) |
| 15 Years | 0 (0.0%) | 0 (0.0%) |
| 16 and 17 Years | 0 (0.0%) | 0 (0.0%) |
| 18 to 24 Years | 2 (3.9%) | 26 (45.6%) |
| 25 to 34 Years | 22 (22.5%) | 33 (33.7%) |
| 35 to 44 Years | 6 (10.9%) | 0 (0.0%) |
| 45 to 54 Years | 8 (11.1%) | 1 (2.2%) |
| 55 to 64 Years | 5 (6.8%) | 19 (17.9%) |
| 65 to 74 Years | 4 (3.7%) | 11 (7.5%) |
| 75 Years and over | 1 (1.8%) | 9 (11.8%) |
| Total | 84 (13.3%) | 114 (15.3%) |
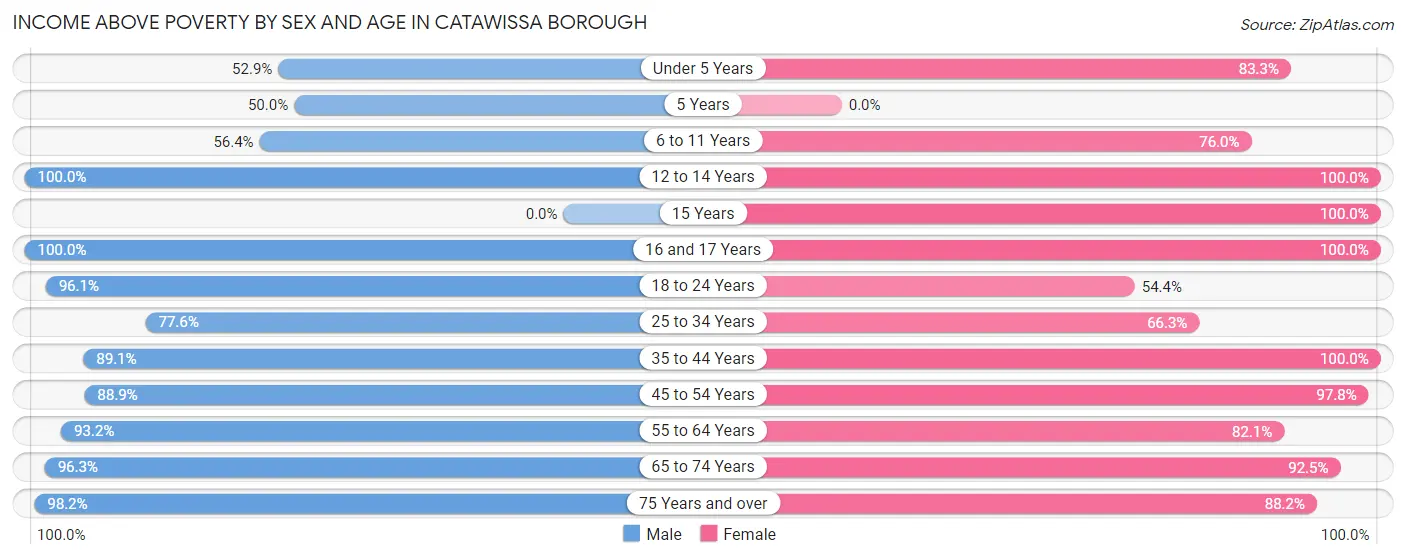
Income Above Poverty by Sex and Age in Catawissa borough
According to the poverty statistics in Catawissa borough, males aged 12 to 14 years and females aged 12 to 14 years are the age groups that are most secure financially, with 100.0% of males and 100.0% of females in these age groups living above the poverty line.
| Age Bracket | Male | Female |
| Under 5 Years | 18 (52.9%) | 15 (83.3%) |
| 5 Years | 3 (50.0%) | 0 (0.0%) |
| 6 to 11 Years | 22 (56.4%) | 38 (76.0%) |
| 12 to 14 Years | 28 (100.0%) | 29 (100.0%) |
| 15 Years | 0 (0.0%) | 4 (100.0%) |
| 16 and 17 Years | 12 (100.0%) | 13 (100.0%) |
| 18 to 24 Years | 49 (96.1%) | 31 (54.4%) |
| 25 to 34 Years | 76 (77.5%) | 65 (66.3%) |
| 35 to 44 Years | 49 (89.1%) | 104 (100.0%) |
| 45 to 54 Years | 64 (88.9%) | 44 (97.8%) |
| 55 to 64 Years | 69 (93.2%) | 87 (82.1%) |
| 65 to 74 Years | 103 (96.3%) | 136 (92.5%) |
| 75 Years and over | 54 (98.2%) | 67 (88.2%) |
| Total | 547 (86.7%) | 633 (84.7%) |
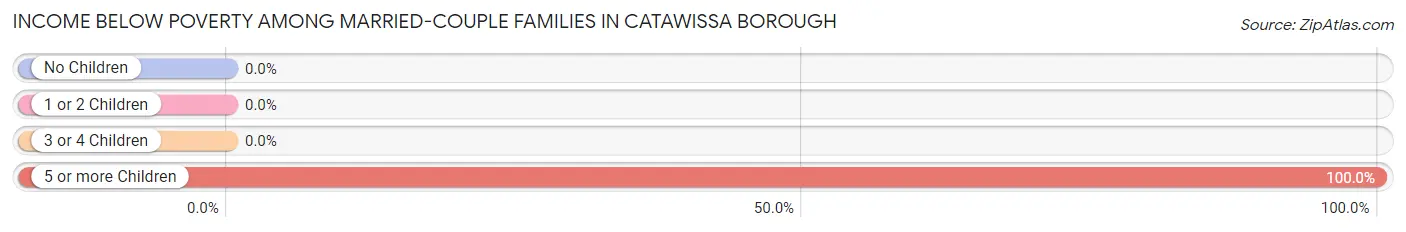
Income Below Poverty Among Married-Couple Families in Catawissa borough
The poverty statistics for married-couple families in Catawissa borough show that 1.2% or 3 of the total 244 families live below the poverty line. Families with 5 or more children have the highest poverty rate of 100.0%, comprising of 3 families. On the other hand, families with no children have the lowest poverty rate of 0.0%, which includes 0 families.
| Children | Above Poverty | Below Poverty |
| No Children | 173 (100.0%) | 0 (0.0%) |
| 1 or 2 Children | 43 (100.0%) | 0 (0.0%) |
| 3 or 4 Children | 25 (100.0%) | 0 (0.0%) |
| 5 or more Children | 0 (0.0%) | 3 (100.0%) |
| Total | 241 (98.8%) | 3 (1.2%) |
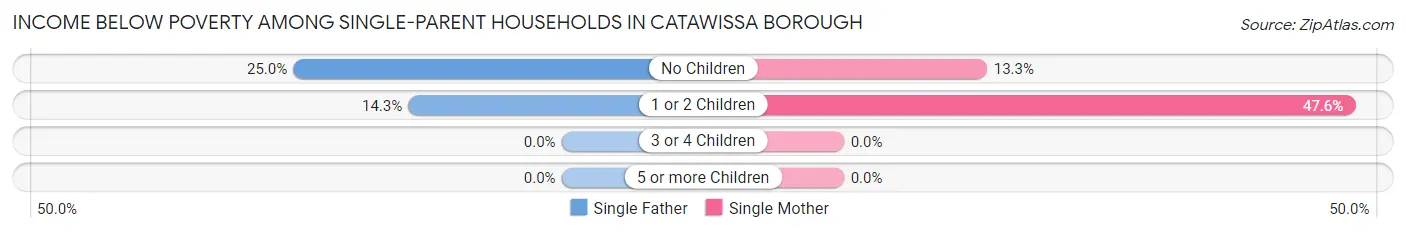
Income Below Poverty Among Single-Parent Households in Catawissa borough
According to the poverty data in Catawissa borough, 15.6% or 5 single-father households and 41.0% or 32 single-mother households are living below the poverty line. Among single-father households, those with no children have the highest poverty rate, with 2 households (25.0%) experiencing poverty. Likewise, among single-mother households, those with 1 or 2 children have the highest poverty rate, with 30 households (47.6%) falling below the poverty line.
| Children | Single Father | Single Mother |
| No Children | 2 (25.0%) | 2 (13.3%) |
| 1 or 2 Children | 3 (14.3%) | 30 (47.6%) |
| 3 or 4 Children | 0 (0.0%) | 0 (0.0%) |
| 5 or more Children | 0 (0.0%) | 0 (0.0%) |
| Total | 5 (15.6%) | 32 (41.0%) |
Income Below Poverty Among Married-Couple vs Single-Parent Households in Catawissa borough
The poverty data for Catawissa borough shows that 3 of the married-couple family households (1.2%) and 37 of the single-parent households (33.6%) are living below the poverty level. Within the married-couple family households, those with 5 or more children have the highest poverty rate, with 3 households (100.0%) falling below the poverty line. Among the single-parent households, those with 1 or 2 children have the highest poverty rate, with 33 household (39.3%) living below poverty.
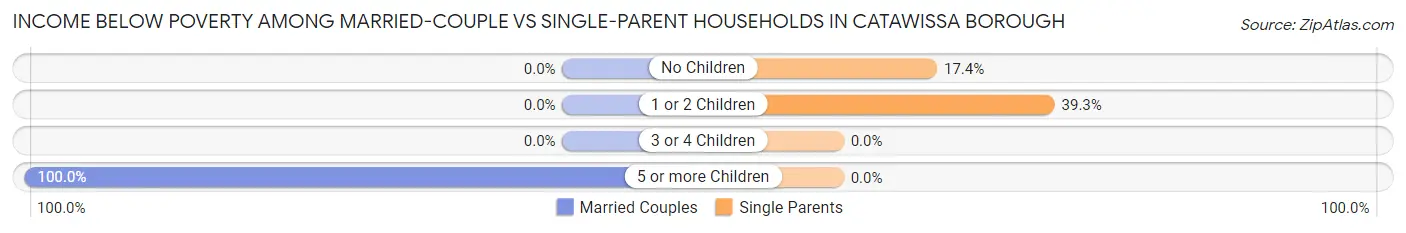
| Children | Married-Couple Families | Single-Parent Households |
| No Children | 0 (0.0%) | 4 (17.4%) |
| 1 or 2 Children | 0 (0.0%) | 33 (39.3%) |
| 3 or 4 Children | 0 (0.0%) | 0 (0.0%) |
| 5 or more Children | 3 (100.0%) | 0 (0.0%) |
| Total | 3 (1.2%) | 37 (33.6%) |
Race in Catawissa borough
The most populous races in Catawissa borough are White / Caucasian (1,264 | 91.1%), Hispanic or Latino (119 | 8.6%), and Two or more Races (98 | 7.1%).
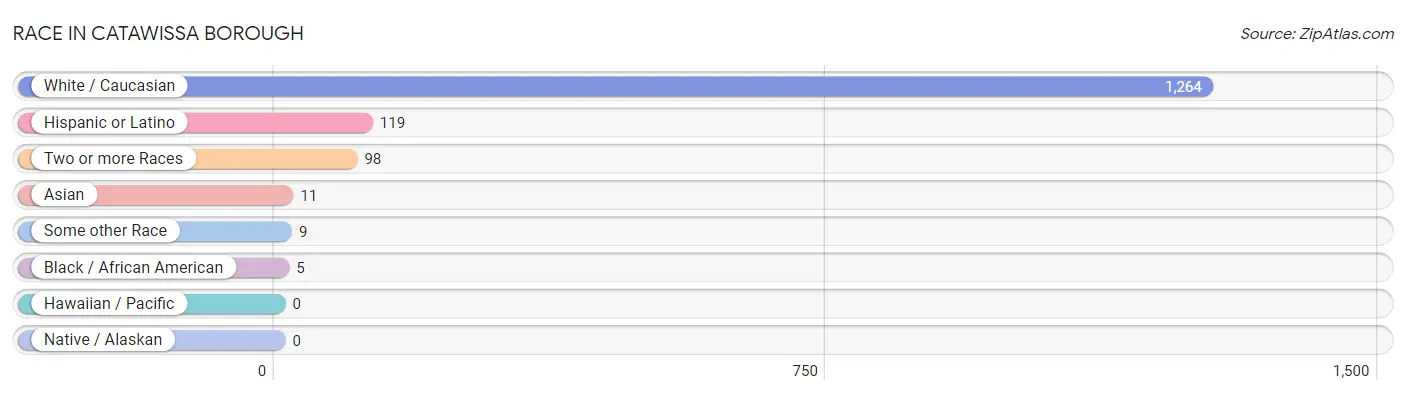
| Race | # Population | % Population |
| Asian | 11 | 0.8% |
| Black / African American | 5 | 0.4% |
| Hawaiian / Pacific | 0 | 0.0% |
| Hispanic or Latino | 119 | 8.6% |
| Native / Alaskan | 0 | 0.0% |
| White / Caucasian | 1,264 | 91.1% |
| Two or more Races | 98 | 7.1% |
| Some other Race | 9 | 0.6% |
| Total | 1,387 | 100.0% |
Ancestry in Catawissa borough
The most populous ancestries reported in Catawissa borough are German (511 | 36.8%), Irish (154 | 11.1%), Polish (145 | 10.4%), Italian (116 | 8.4%), and English (109 | 7.9%), together accounting for 74.6% of all Catawissa borough residents.
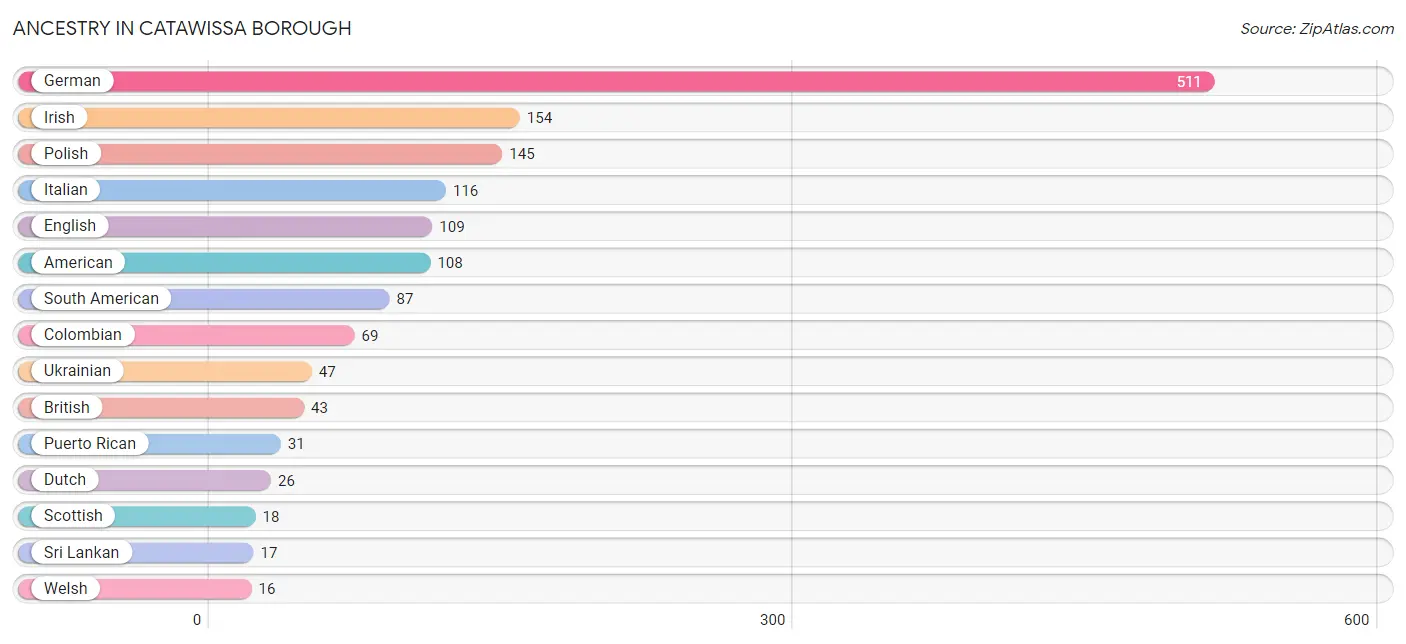
| Ancestry | # Population | % Population |
| American | 108 | 7.8% |
| Argentinean | 6 | 0.4% |
| Austrian | 1 | 0.1% |
| British | 43 | 3.1% |
| Colombian | 69 | 5.0% |
| Dutch | 26 | 1.9% |
| Dutch West Indian | 1 | 0.1% |
| Ecuadorian | 7 | 0.5% |
| English | 109 | 7.9% |
| French | 6 | 0.4% |
| German | 511 | 36.8% |
| Irish | 154 | 11.1% |
| Italian | 116 | 8.4% |
| Norwegian | 4 | 0.3% |
| Pennsylvania German | 15 | 1.1% |
| Peruvian | 5 | 0.4% |
| Polish | 145 | 10.4% |
| Puerto Rican | 31 | 2.2% |
| Russian | 13 | 0.9% |
| Scotch-Irish | 3 | 0.2% |
| Scottish | 18 | 1.3% |
| Slovak | 8 | 0.6% |
| South American | 87 | 6.3% |
| Sri Lankan | 17 | 1.2% |
| Swedish | 11 | 0.8% |
| Swiss | 5 | 0.4% |
| Ukrainian | 47 | 3.4% |
| Welsh | 16 | 1.1% | View All 28 Rows |
Immigrants in Catawissa borough
The most numerous immigrant groups reported in Catawissa borough came from Latin America (87 | 6.3%), South America (87 | 6.3%), Colombia (69 | 5.0%), Asia (11 | 0.8%), and South Eastern Asia (11 | 0.8%), together accounting for 19.1% of all Catawissa borough residents.
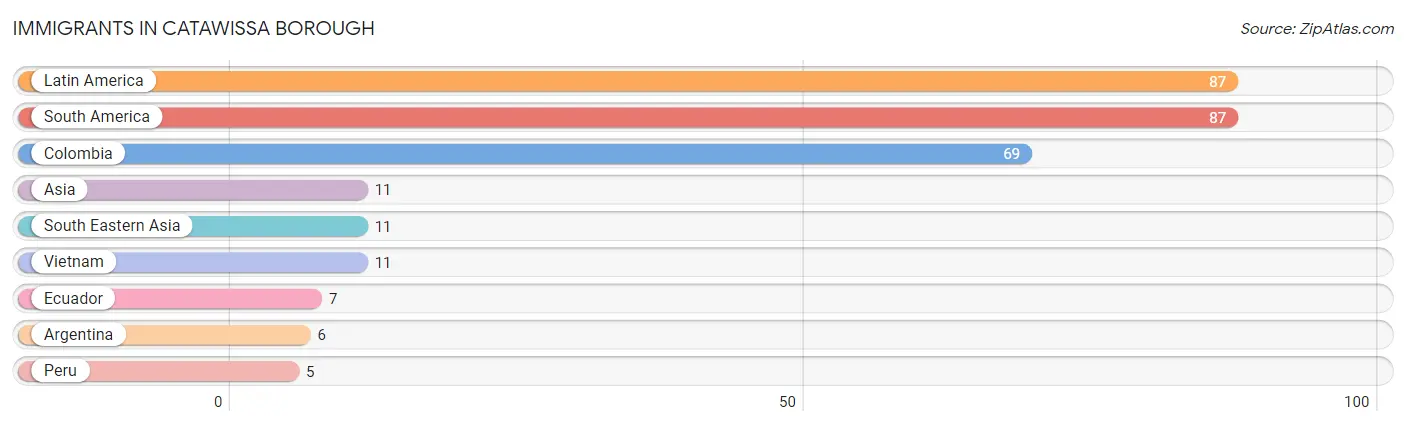
| Immigration Origin | # Population | % Population |
| Argentina | 6 | 0.4% |
| Asia | 11 | 0.8% |
| Colombia | 69 | 5.0% |
| Ecuador | 7 | 0.5% |
| Latin America | 87 | 6.3% |
| Peru | 5 | 0.4% |
| South America | 87 | 6.3% |
| South Eastern Asia | 11 | 0.8% |
| Vietnam | 11 | 0.8% | View All 9 Rows |
Sex and Age in Catawissa borough
Sex and Age in Catawissa borough
The most populous age groups in Catawissa borough are 70 to 74 Years (58 | 9.1%) for men and 65 to 69 Years (114 | 15.3%) for women.
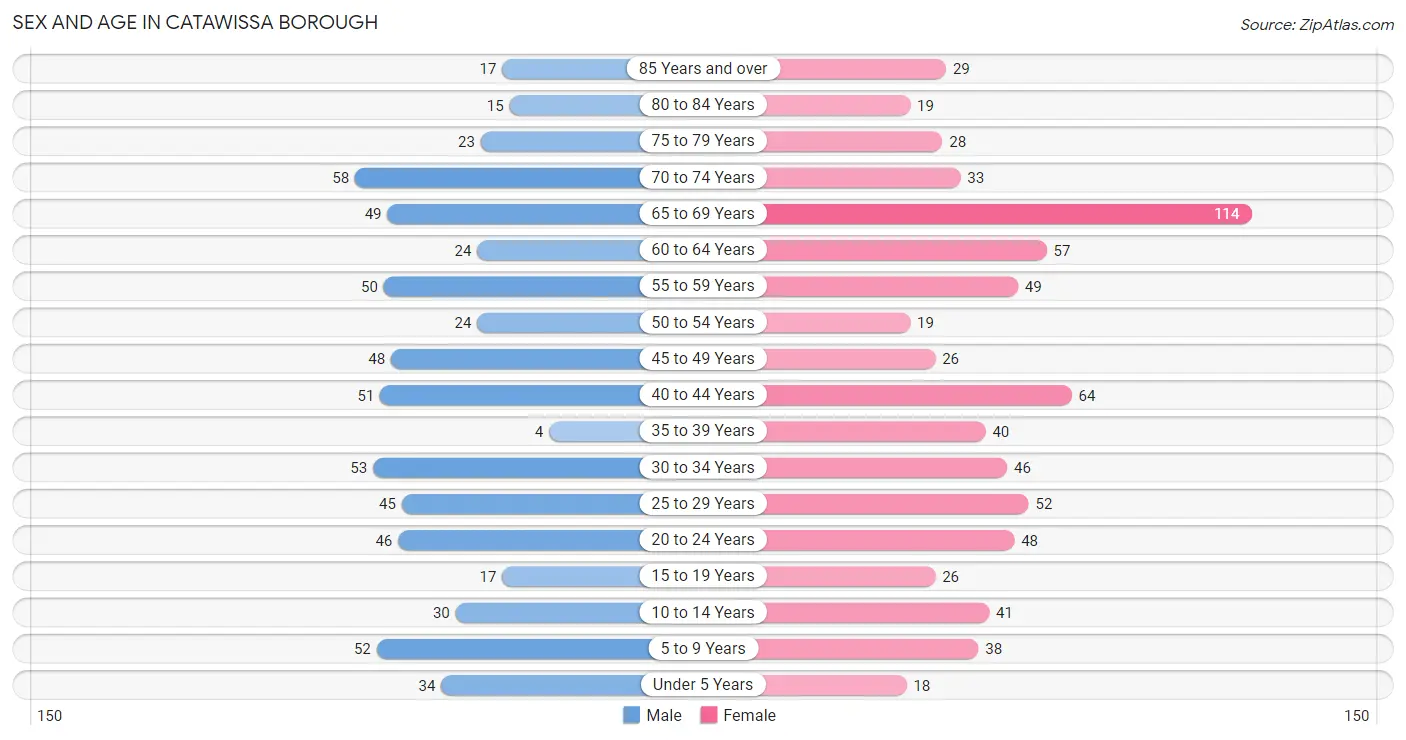
| Age Bracket | Male | Female |
| Under 5 Years | 34 (5.3%) | 18 (2.4%) |
| 5 to 9 Years | 52 (8.1%) | 38 (5.1%) |
| 10 to 14 Years | 30 (4.7%) | 41 (5.5%) |
| 15 to 19 Years | 17 (2.7%) | 26 (3.5%) |
| 20 to 24 Years | 46 (7.2%) | 48 (6.4%) |
| 25 to 29 Years | 45 (7.0%) | 52 (7.0%) |
| 30 to 34 Years | 53 (8.3%) | 46 (6.2%) |
| 35 to 39 Years | 4 (0.6%) | 40 (5.3%) |
| 40 to 44 Years | 51 (8.0%) | 64 (8.6%) |
| 45 to 49 Years | 48 (7.5%) | 26 (3.5%) |
| 50 to 54 Years | 24 (3.7%) | 19 (2.5%) |
| 55 to 59 Years | 50 (7.8%) | 49 (6.6%) |
| 60 to 64 Years | 24 (3.7%) | 57 (7.6%) |
| 65 to 69 Years | 49 (7.7%) | 114 (15.3%) |
| 70 to 74 Years | 58 (9.1%) | 33 (4.4%) |
| 75 to 79 Years | 23 (3.6%) | 28 (3.7%) |
| 80 to 84 Years | 15 (2.3%) | 19 (2.5%) |
| 85 Years and over | 17 (2.7%) | 29 (3.9%) |
| Total | 640 (100.0%) | 747 (100.0%) |
Families and Households in Catawissa borough
Median Family Size in Catawissa borough
The median family size in Catawissa borough is 2.66 persons per family, with married-couple families (244 | 68.9%) accounting for the largest median family size of 2.79 persons per family. On the other hand, single female/mother families (78 | 22.0%) represent the smallest median family size with 2.35 persons per family.
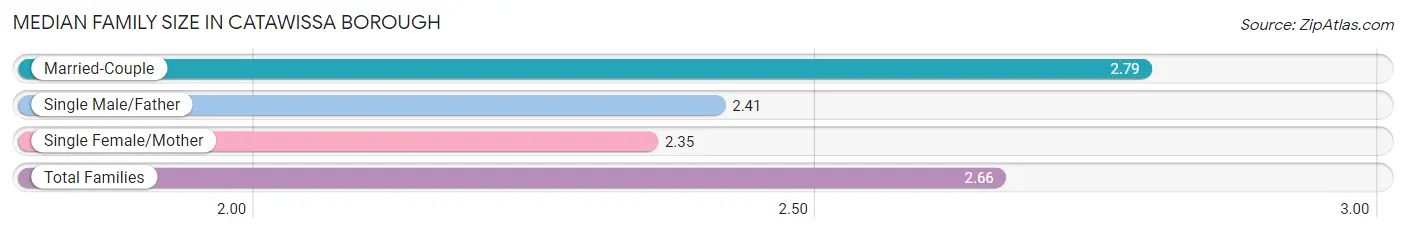
| Family Type | # Families | Family Size |
| Married-Couple | 244 (68.9%) | 2.79 |
| Single Male/Father | 32 (9.0%) | 2.41 |
| Single Female/Mother | 78 (22.0%) | 2.35 |
| Total Families | 354 (100.0%) | 2.66 |
Median Household Size in Catawissa borough
The median household size in Catawissa borough is 2.07 persons per household, with single female/mother households (78 | 11.7%) accounting for the largest median household size of 3.01 persons per household. non-family households (313 | 46.9%) represent the smallest median household size with 1.19 persons per household.
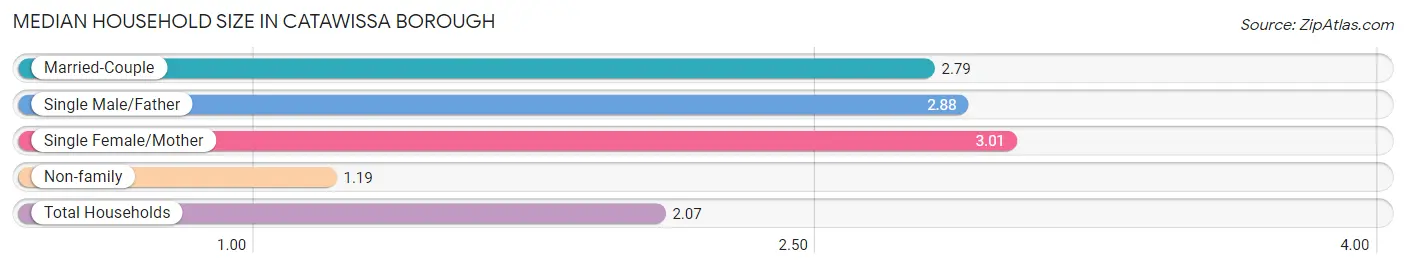
| Household Type | # Households | Household Size |
| Married-Couple | 244 (36.6%) | 2.79 |
| Single Male/Father | 32 (4.8%) | 2.88 |
| Single Female/Mother | 78 (11.7%) | 3.01 |
| Non-family | 313 (46.9%) | 1.19 |
| Total Households | 667 (100.0%) | 2.07 |
Household Size by Marriage Status in Catawissa borough
Out of a total of 667 households in Catawissa borough, 354 (53.1%) are family households, while 313 (46.9%) are nonfamily households. The most numerous type of family households are 2-person households, comprising 178, and the most common type of nonfamily households are 1-person households, comprising 245.
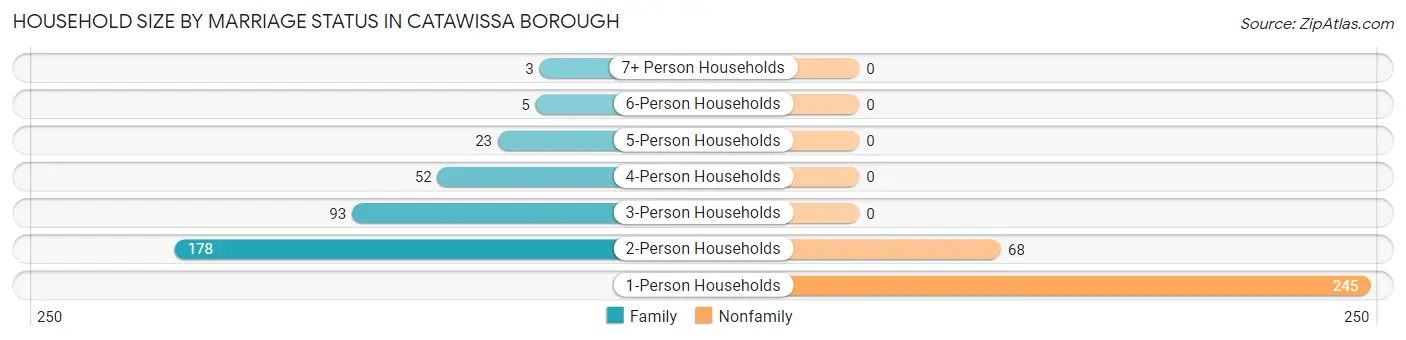
| Household Size | Family Households | Nonfamily Households |
| 1-Person Households | - | 245 (36.7%) |
| 2-Person Households | 178 (26.7%) | 68 (10.2%) |
| 3-Person Households | 93 (13.9%) | 0 (0.0%) |
| 4-Person Households | 52 (7.8%) | 0 (0.0%) |
| 5-Person Households | 23 (3.5%) | 0 (0.0%) |
| 6-Person Households | 5 (0.7%) | 0 (0.0%) |
| 7+ Person Households | 3 (0.4%) | 0 (0.0%) |
| Total | 354 (53.1%) | 313 (46.9%) |
Female Fertility in Catawissa borough
Fertility by Age in Catawissa borough
Average fertility rate in Catawissa borough is 26.0 births per 1,000 women. Women in the age bracket of 20 to 34 years have the highest fertility rate with 48.0 births per 1,000 women. Women in the age bracket of 20 to 34 years acount for 87.5% of all women with births.
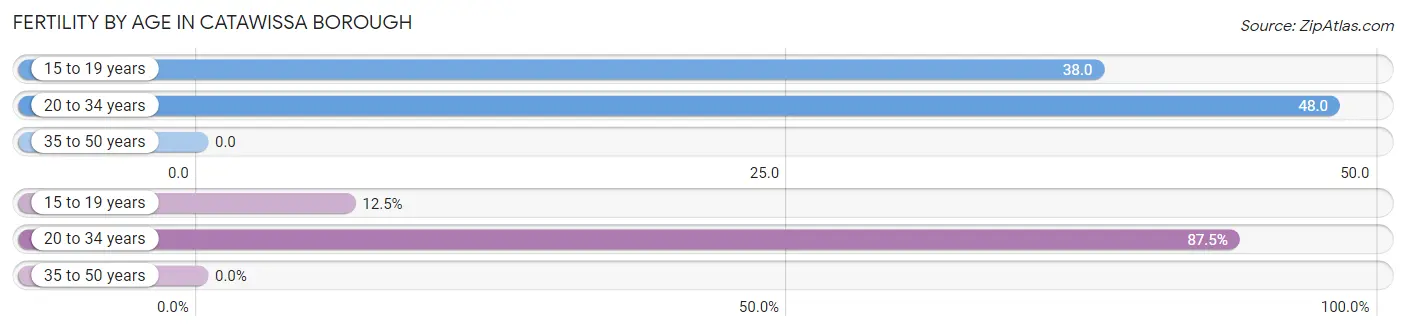
| Age Bracket | Women with Births | Births / 1,000 Women |
| 15 to 19 years | 1 (12.5%) | 38.0 |
| 20 to 34 years | 7 (87.5%) | 48.0 |
| 35 to 50 years | 0 (0.0%) | 0.0 |
| Total | 8 (100.0%) | 26.0 |
Fertility by Age by Marriage Status in Catawissa borough
25.0% of women with births (8) in Catawissa borough are married. The highest percentage of unmarried women with births falls into 15 to 19 years age bracket with 100.0% of them unmarried at the time of birth, while the lowest percentage of unmarried women with births belong to 20 to 34 years age bracket with 71.4% of them unmarried.
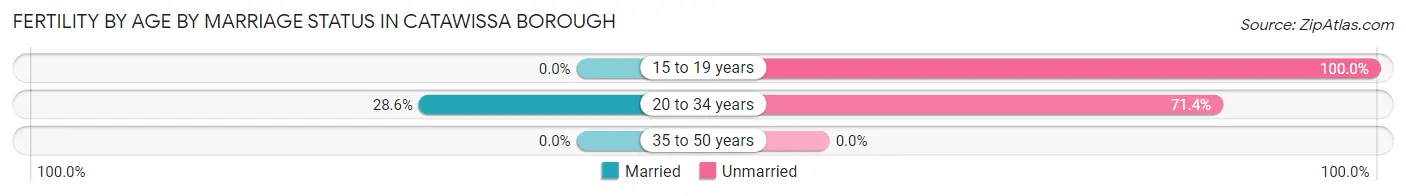
| Age Bracket | Married | Unmarried |
| 15 to 19 years | 0 (0.0%) | 1 (100.0%) |
| 20 to 34 years | 2 (28.6%) | 5 (71.4%) |
| 35 to 50 years | 0 (0.0%) | 0 (0.0%) |
| Total | 2 (25.0%) | 6 (75.0%) |
Fertility by Education in Catawissa borough
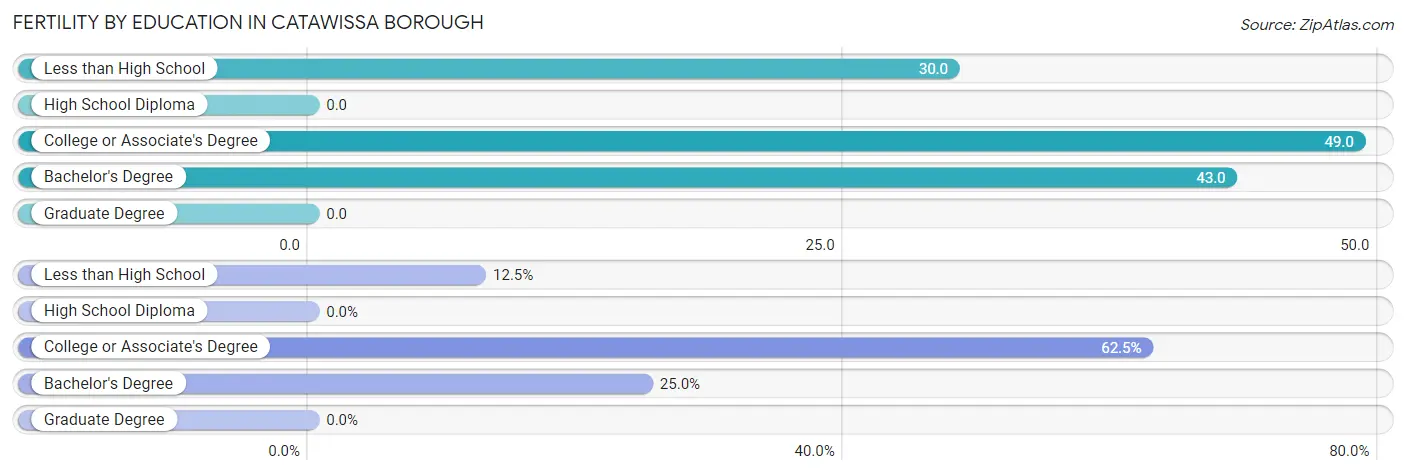
| Educational Attainment | Women with Births | Births / 1,000 Women |
| Less than High School | 1 (12.5%) | 30.0 |
| High School Diploma | 0 (0.0%) | 0.0 |
| College or Associate's Degree | 5 (62.5%) | 49.0 |
| Bachelor's Degree | 2 (25.0%) | 43.0 |
| Graduate Degree | 0 (0.0%) | 0.0 |
| Total | 8 (100.0%) | 26.0 |
Fertility by Education by Marriage Status in Catawissa borough
75.0% of women with births in Catawissa borough are unmarried. Women with the educational attainment of bachelor's degree are most likely to be married with 100.0% of them married at childbirth, while women with the educational attainment of less than high school are least likely to be married with 100.0% of them unmarried at childbirth.
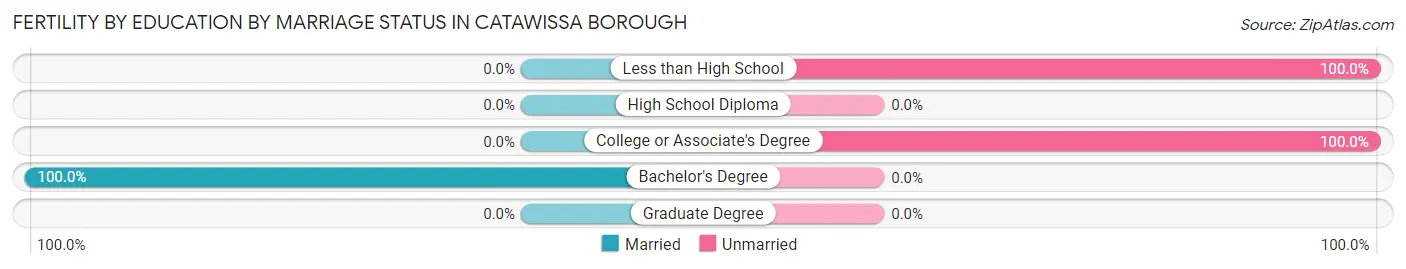
| Educational Attainment | Married | Unmarried |
| Less than High School | 0 (0.0%) | 1 (100.0%) |
| High School Diploma | 0 (0.0%) | 0 (0.0%) |
| College or Associate's Degree | 0 (0.0%) | 5 (100.0%) |
| Bachelor's Degree | 2 (100.0%) | 0 (0.0%) |
| Graduate Degree | 0 (0.0%) | 0 (0.0%) |
| Total | 2 (25.0%) | 6 (75.0%) |
Employment Characteristics in Catawissa borough
Employment by Class of Employer in Catawissa borough
Among the 765 employed individuals in Catawissa borough, private company employees (435 | 56.9%), local government employees (124 | 16.2%), and not-for-profit organizations (82 | 10.7%) make up the most common classes of employment.
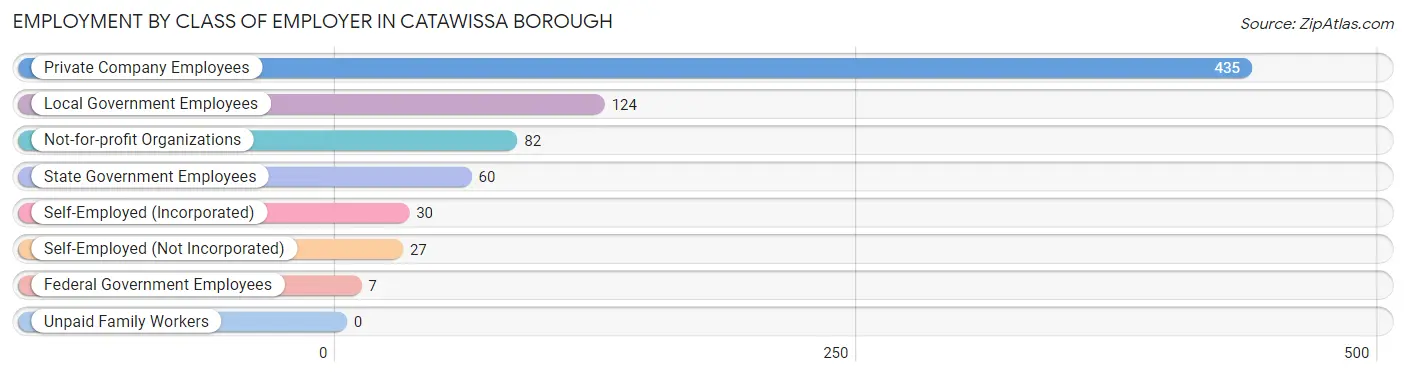
| Employer Class | # Employees | % Employees |
| Private Company Employees | 435 | 56.9% |
| Self-Employed (Incorporated) | 30 | 3.9% |
| Self-Employed (Not Incorporated) | 27 | 3.5% |
| Not-for-profit Organizations | 82 | 10.7% |
| Local Government Employees | 124 | 16.2% |
| State Government Employees | 60 | 7.8% |
| Federal Government Employees | 7 | 0.9% |
| Unpaid Family Workers | 0 | 0.0% |
| Total | 765 | 100.0% |
Employment Status by Age in Catawissa borough
According to the labor force statistics for Catawissa borough, out of the total population over 16 years of age (1,170), 70.6% or 826 individuals are in the labor force, with 5.4% or 45 of them unemployed. The age group with the highest labor force participation rate is 20 to 24 years, with 95.7% or 90 individuals in the labor force. Within the labor force, the 16 to 19 years age range has the highest percentage of unemployed individuals, with 33.3% or 6 of them being unemployed.
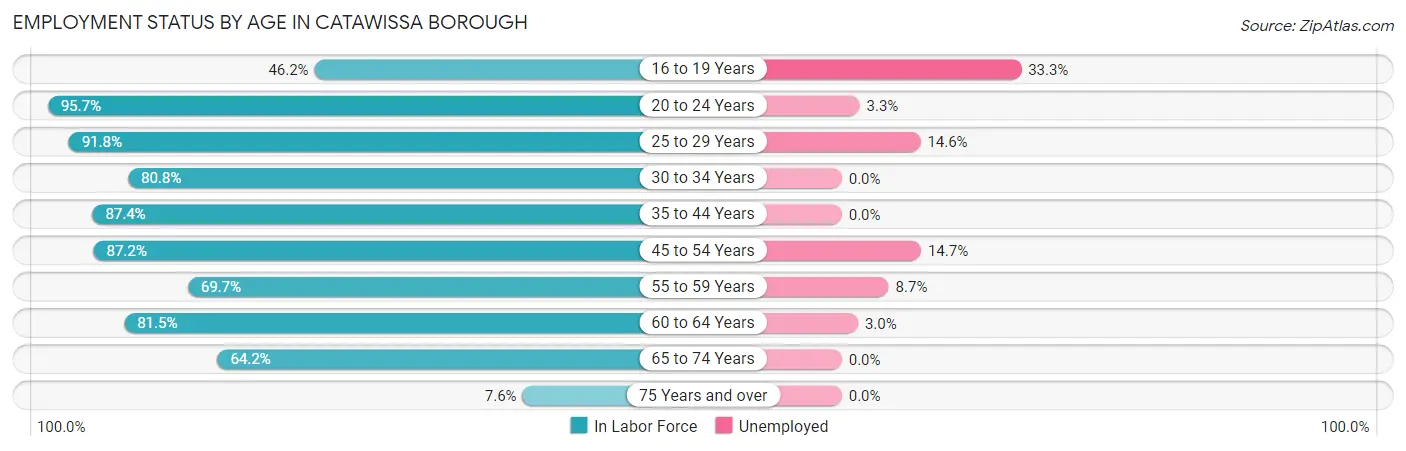
| Age Bracket | In Labor Force | Unemployed |
| 16 to 19 Years | 18 (46.2%) | 6 (33.3%) |
| 20 to 24 Years | 90 (95.7%) | 3 (3.3%) |
| 25 to 29 Years | 89 (91.8%) | 13 (14.6%) |
| 30 to 34 Years | 80 (80.8%) | 0 (0.0%) |
| 35 to 44 Years | 139 (87.4%) | 0 (0.0%) |
| 45 to 54 Years | 102 (87.2%) | 15 (14.7%) |
| 55 to 59 Years | 69 (69.7%) | 6 (8.7%) |
| 60 to 64 Years | 66 (81.5%) | 2 (3.0%) |
| 65 to 74 Years | 163 (64.2%) | 0 (0.0%) |
| 75 Years and over | 10 (7.6%) | 0 (0.0%) |
| Total | 826 (70.6%) | 45 (5.4%) |
Employment Status by Educational Attainment in Catawissa borough
According to labor force statistics for Catawissa borough, 83.6% of individuals (545) out of the total population between 25 and 64 years of age (652) are in the labor force, with 6.6% or 36 of them being unemployed. The group with the highest labor force participation rate are those with the educational attainment of high school diploma, with 87.7% or 256 individuals in the labor force. Within the labor force, individuals with less than high school education have the highest percentage of unemployment, with 10.0% or 3 of them being unemployed.
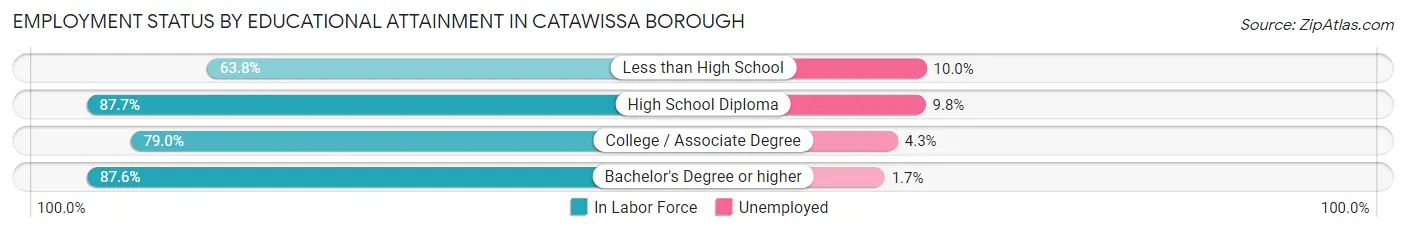
| Educational Attainment | In Labor Force | Unemployed |
| Less than High School | 30 (63.8%) | 5 (10.0%) |
| High School Diploma | 256 (87.7%) | 29 (9.8%) |
| College / Associate Degree | 139 (79.0%) | 8 (4.3%) |
| Bachelor's Degree or higher | 120 (87.6%) | 2 (1.7%) |
| Total | 545 (83.6%) | 43 (6.6%) |
Employment Occupations by Sex in Catawissa borough
Management, Business, Science and Arts Occupations
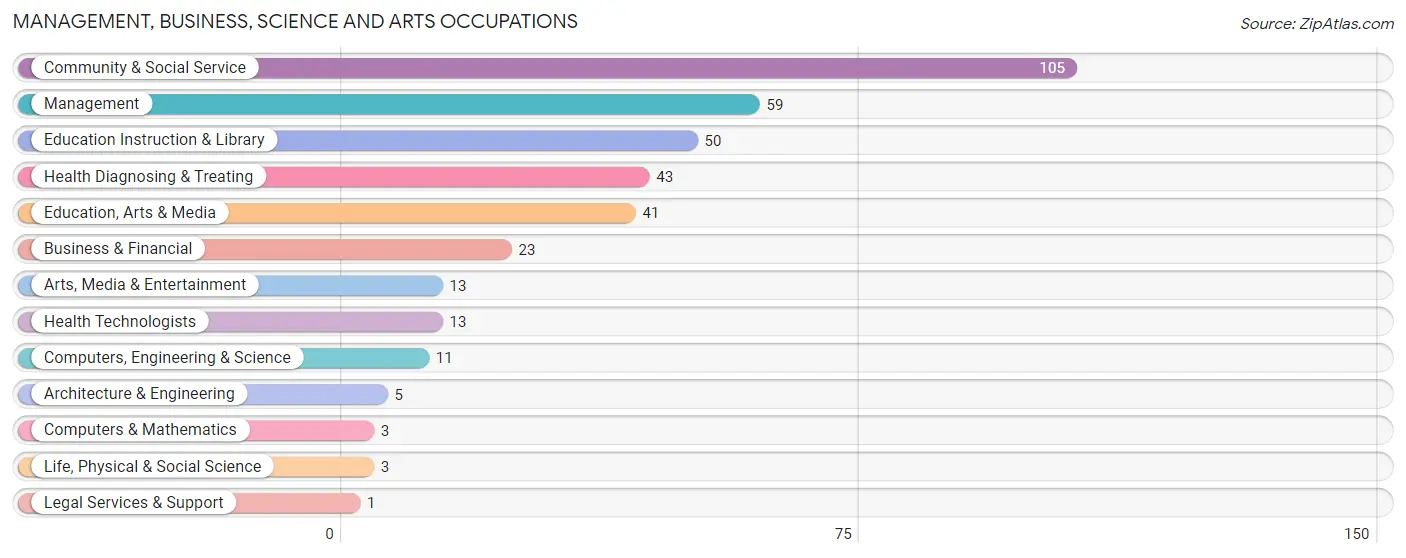
The most common Management, Business, Science and Arts occupations in Catawissa borough are Community & Social Service (105 | 13.4%), Management (59 | 7.5%), Education Instruction & Library (50 | 6.4%), Health Diagnosing & Treating (43 | 5.5%), and Education, Arts & Media (41 | 5.2%).
Management, Business, Science and Arts Occupations by Sex
Within the Management, Business, Science and Arts occupations in Catawissa borough, the most male-oriented occupations are Computers & Mathematics (100.0%), Architecture & Engineering (100.0%), and Legal Services & Support (100.0%), while the most female-oriented occupations are Life, Physical & Social Science (100.0%), Health Diagnosing & Treating (100.0%), and Health Technologists (100.0%).
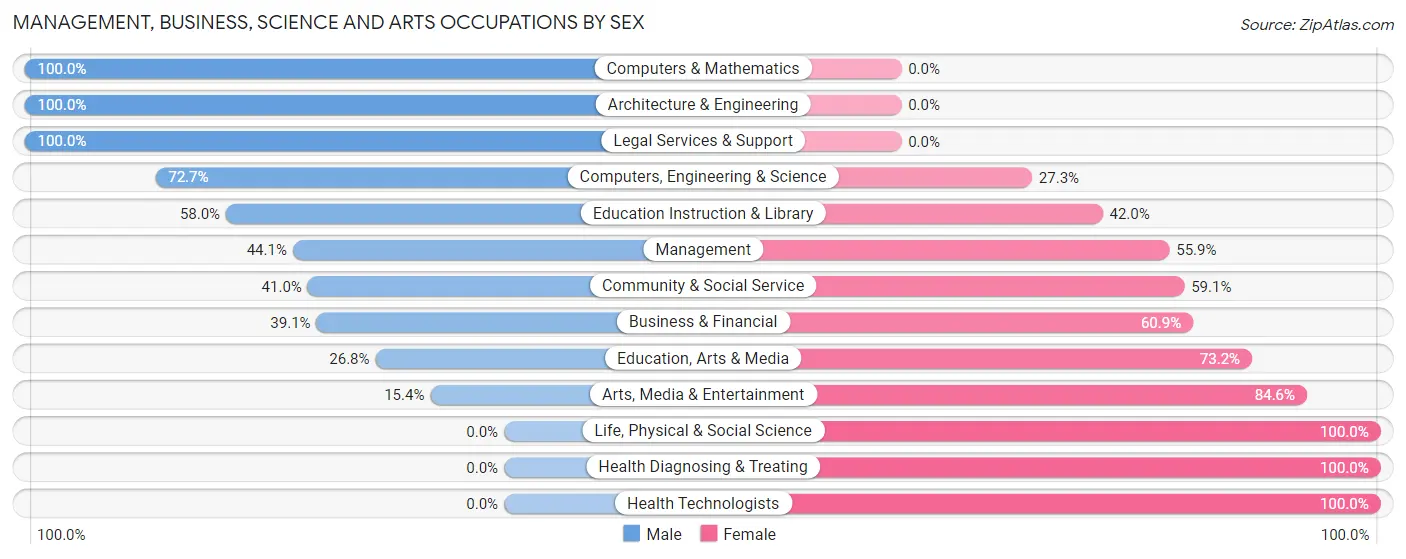
| Occupation | Male | Female |
| Management | 26 (44.1%) | 33 (55.9%) |
| Business & Financial | 9 (39.1%) | 14 (60.9%) |
| Computers, Engineering & Science | 8 (72.7%) | 3 (27.3%) |
| Computers & Mathematics | 3 (100.0%) | 0 (0.0%) |
| Architecture & Engineering | 5 (100.0%) | 0 (0.0%) |
| Life, Physical & Social Science | 0 (0.0%) | 3 (100.0%) |
| Community & Social Service | 43 (40.9%) | 62 (59.1%) |
| Education, Arts & Media | 11 (26.8%) | 30 (73.2%) |
| Legal Services & Support | 1 (100.0%) | 0 (0.0%) |
| Education Instruction & Library | 29 (58.0%) | 21 (42.0%) |
| Arts, Media & Entertainment | 2 (15.4%) | 11 (84.6%) |
| Health Diagnosing & Treating | 0 (0.0%) | 43 (100.0%) |
| Health Technologists | 0 (0.0%) | 13 (100.0%) |
| Total (Category) | 86 (35.7%) | 155 (64.3%) |
| Total (Overall) | 359 (46.0%) | 422 (54.0%) |
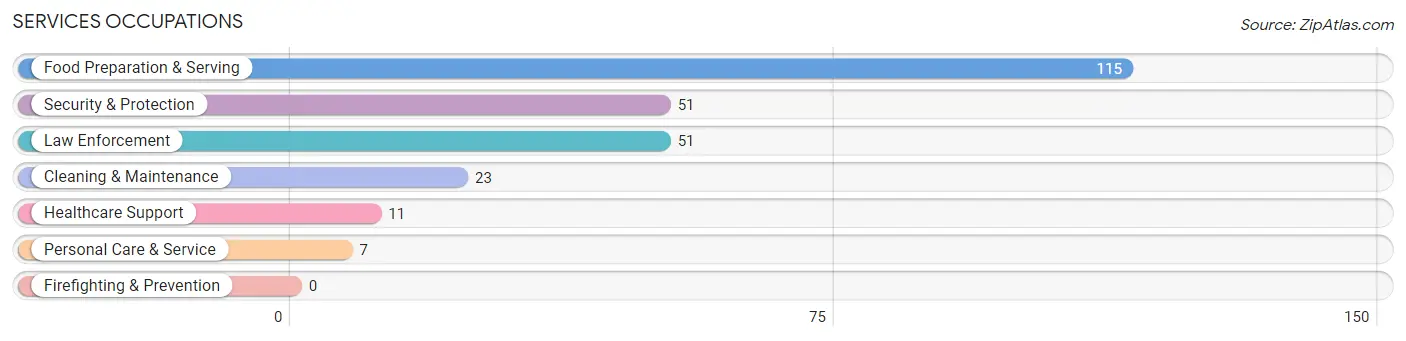
Services Occupations
The most common Services occupations in Catawissa borough are Food Preparation & Serving (115 | 14.7%), Security & Protection (51 | 6.5%), Law Enforcement (51 | 6.5%), Cleaning & Maintenance (23 | 2.9%), and Healthcare Support (11 | 1.4%).
Services Occupations by Sex
Within the Services occupations in Catawissa borough, the most male-oriented occupations are Security & Protection (100.0%), Law Enforcement (100.0%), and Cleaning & Maintenance (60.9%), while the most female-oriented occupations are Healthcare Support (100.0%), Personal Care & Service (100.0%), and Food Preparation & Serving (80.0%).
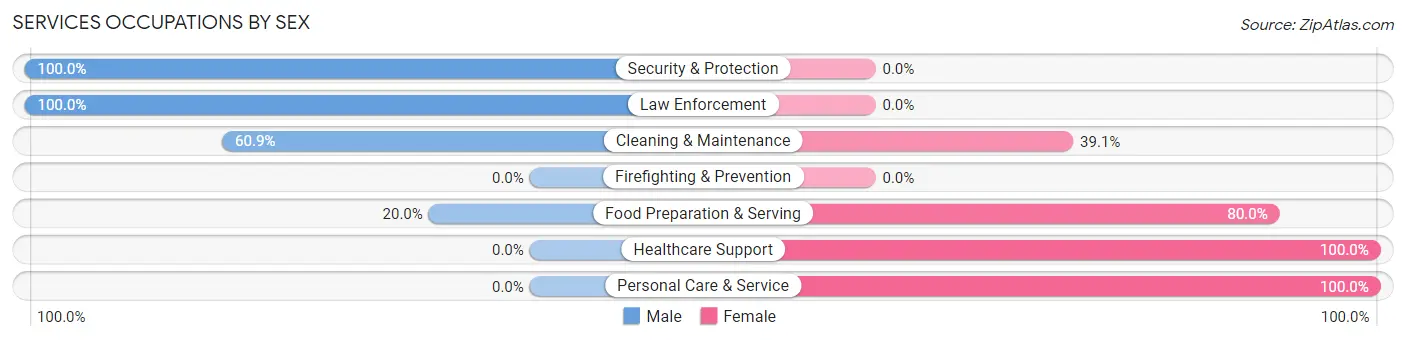
| Occupation | Male | Female |
| Healthcare Support | 0 (0.0%) | 11 (100.0%) |
| Security & Protection | 51 (100.0%) | 0 (0.0%) |
| Firefighting & Prevention | 0 (0.0%) | 0 (0.0%) |
| Law Enforcement | 51 (100.0%) | 0 (0.0%) |
| Food Preparation & Serving | 23 (20.0%) | 92 (80.0%) |
| Cleaning & Maintenance | 14 (60.9%) | 9 (39.1%) |
| Personal Care & Service | 0 (0.0%) | 7 (100.0%) |
| Total (Category) | 88 (42.5%) | 119 (57.5%) |
| Total (Overall) | 359 (46.0%) | 422 (54.0%) |
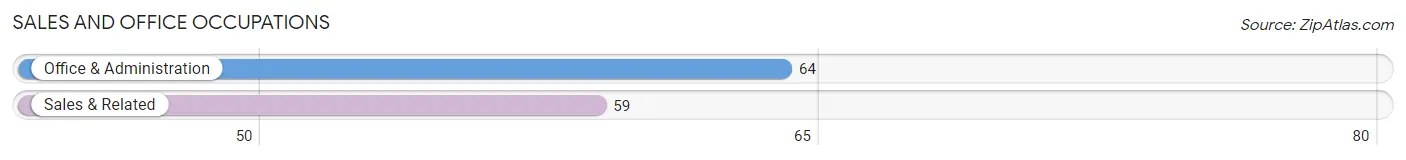
Sales and Office Occupations
The most common Sales and Office occupations in Catawissa borough are Office & Administration (64 | 8.2%), and Sales & Related (59 | 7.5%).
Sales and Office Occupations by Sex
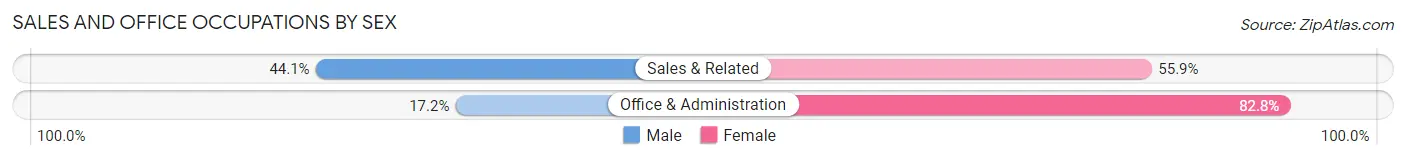
| Occupation | Male | Female |
| Sales & Related | 26 (44.1%) | 33 (55.9%) |
| Office & Administration | 11 (17.2%) | 53 (82.8%) |
| Total (Category) | 37 (30.1%) | 86 (69.9%) |
| Total (Overall) | 359 (46.0%) | 422 (54.0%) |
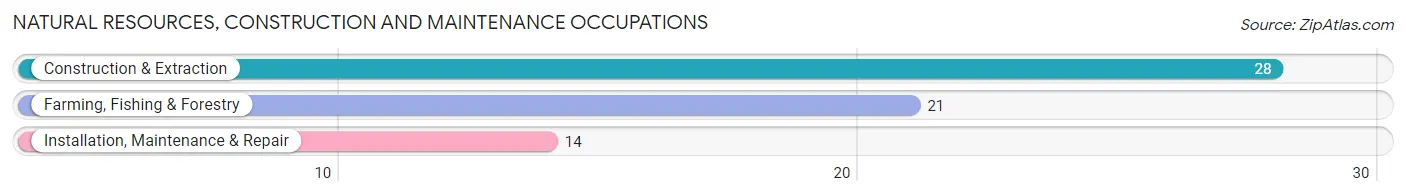
Natural Resources, Construction and Maintenance Occupations
The most common Natural Resources, Construction and Maintenance occupations in Catawissa borough are Construction & Extraction (28 | 3.6%), Farming, Fishing & Forestry (21 | 2.7%), and Installation, Maintenance & Repair (14 | 1.8%).
Natural Resources, Construction and Maintenance Occupations by Sex
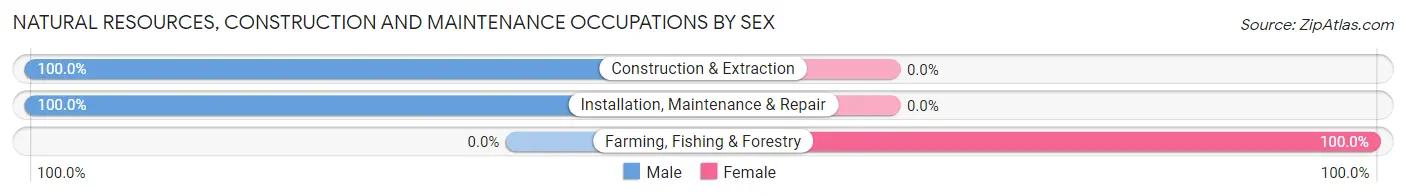
| Occupation | Male | Female |
| Farming, Fishing & Forestry | 0 (0.0%) | 21 (100.0%) |
| Construction & Extraction | 28 (100.0%) | 0 (0.0%) |
| Installation, Maintenance & Repair | 14 (100.0%) | 0 (0.0%) |
| Total (Category) | 42 (66.7%) | 21 (33.3%) |
| Total (Overall) | 359 (46.0%) | 422 (54.0%) |
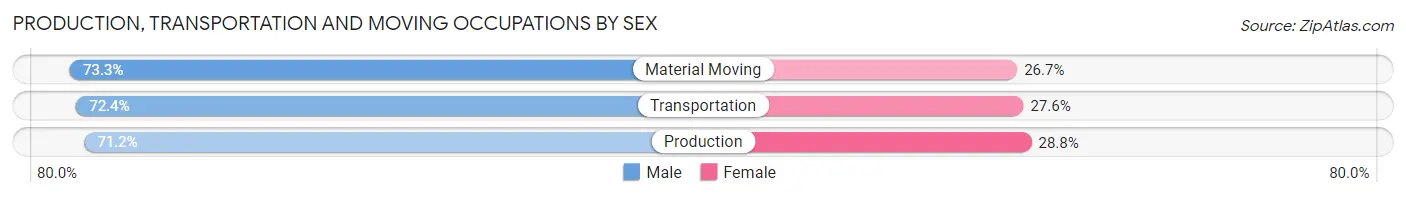
Production, Transportation and Moving Occupations
The most common Production, Transportation and Moving occupations in Catawissa borough are Production (73 | 9.3%), Material Moving (45 | 5.8%), and Transportation (29 | 3.7%).
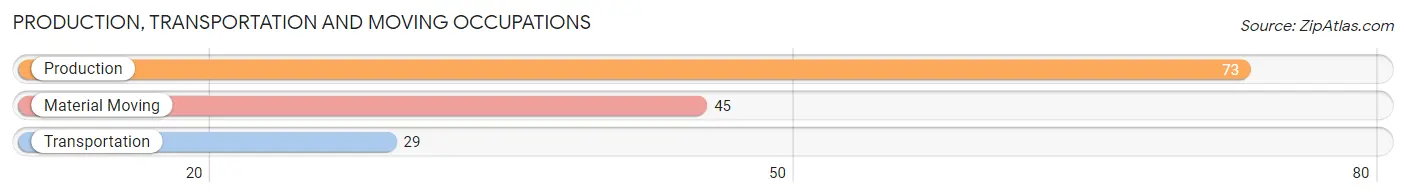
Production, Transportation and Moving Occupations by Sex
| Occupation | Male | Female |
| Production | 52 (71.2%) | 21 (28.8%) |
| Transportation | 21 (72.4%) | 8 (27.6%) |
| Material Moving | 33 (73.3%) | 12 (26.7%) |
| Total (Category) | 106 (72.1%) | 41 (27.9%) |
| Total (Overall) | 359 (46.0%) | 422 (54.0%) |
Employment Industries by Sex in Catawissa borough
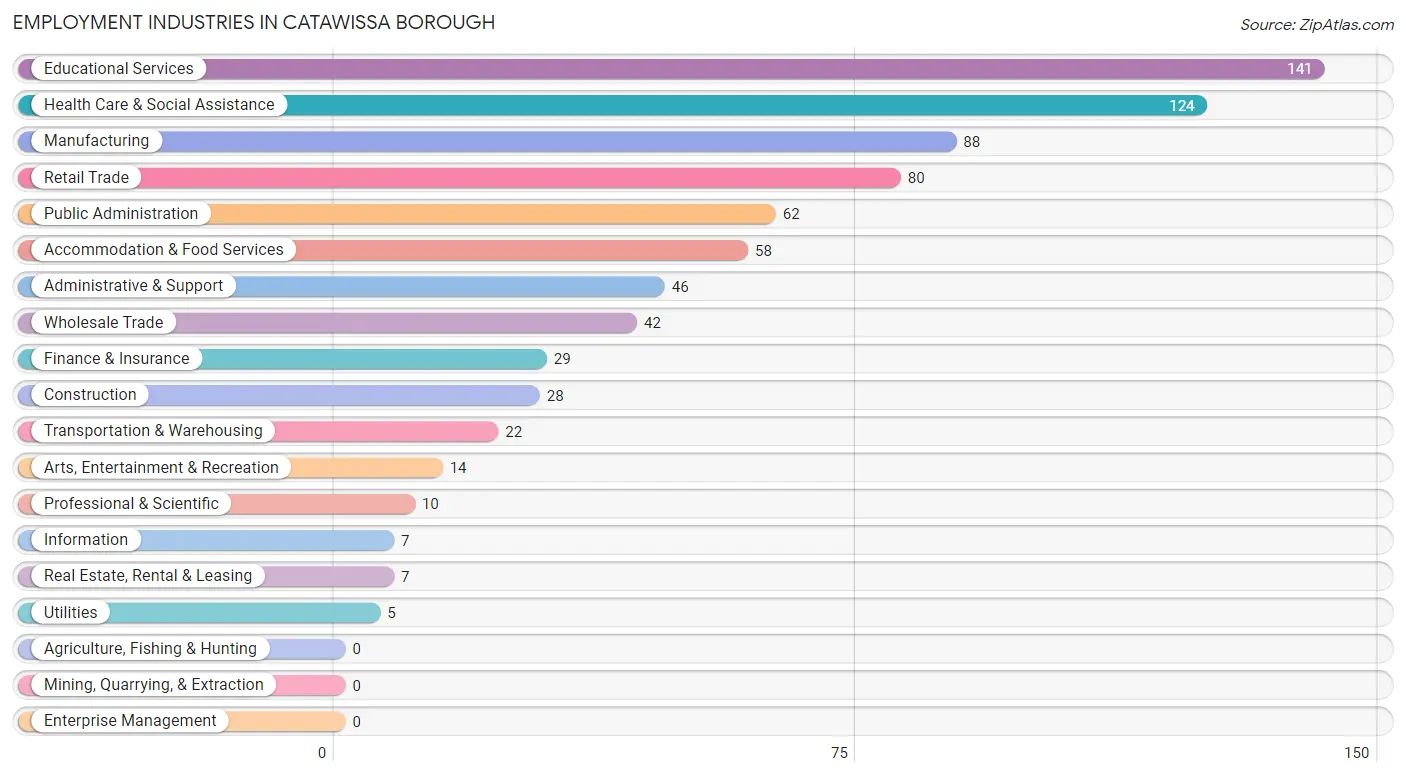
Employment Industries in Catawissa borough
The major employment industries in Catawissa borough include Educational Services (141 | 18.0%), Health Care & Social Assistance (124 | 15.9%), Manufacturing (88 | 11.3%), Retail Trade (80 | 10.2%), and Public Administration (62 | 7.9%).
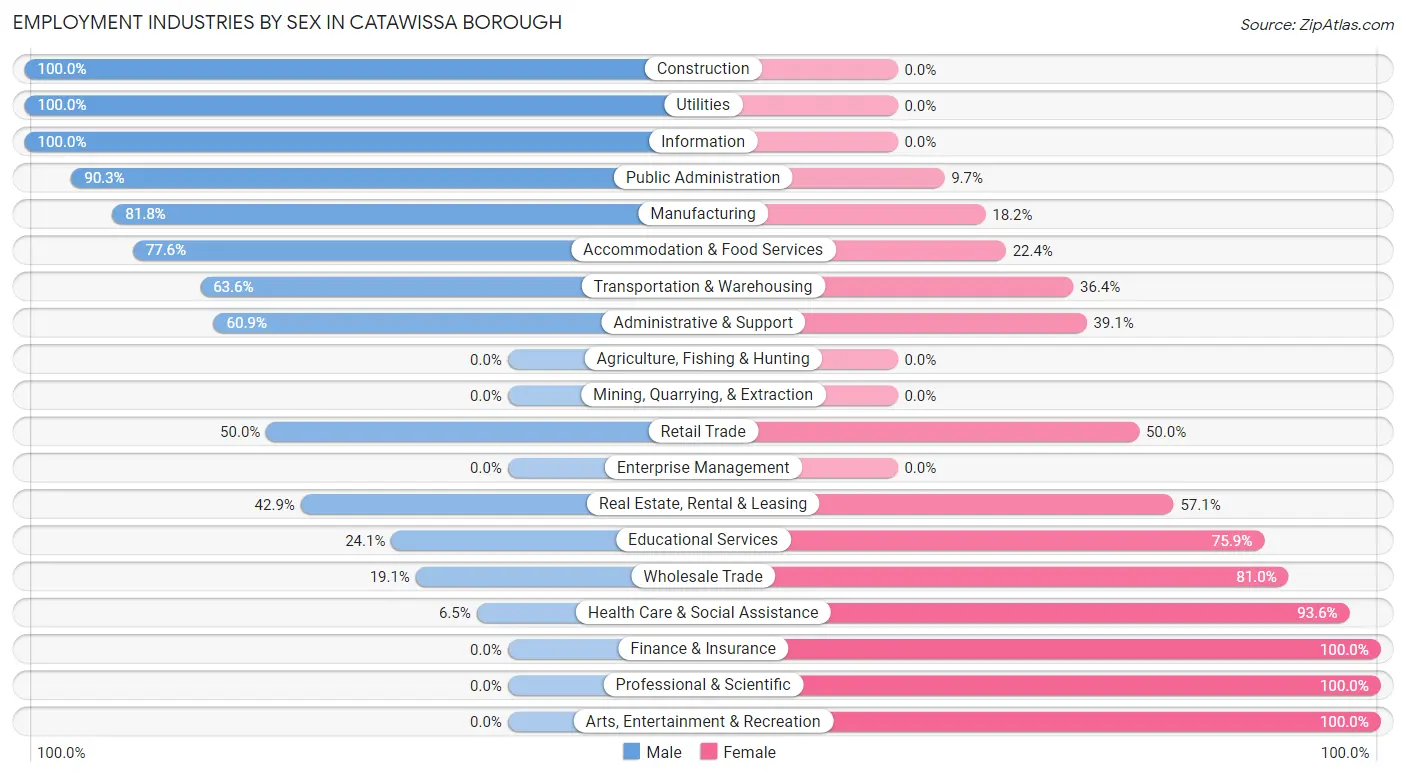
Employment Industries by Sex in Catawissa borough
The Catawissa borough industries that see more men than women are Construction (100.0%), Utilities (100.0%), and Information (100.0%), whereas the industries that tend to have a higher number of women are Finance & Insurance (100.0%), Professional & Scientific (100.0%), and Arts, Entertainment & Recreation (100.0%).
| Industry | Male | Female |
| Agriculture, Fishing & Hunting | 0 (0.0%) | 0 (0.0%) |
| Mining, Quarrying, & Extraction | 0 (0.0%) | 0 (0.0%) |
| Construction | 28 (100.0%) | 0 (0.0%) |
| Manufacturing | 72 (81.8%) | 16 (18.2%) |
| Wholesale Trade | 8 (19.1%) | 34 (80.9%) |
| Retail Trade | 40 (50.0%) | 40 (50.0%) |
| Transportation & Warehousing | 14 (63.6%) | 8 (36.4%) |
| Utilities | 5 (100.0%) | 0 (0.0%) |
| Information | 7 (100.0%) | 0 (0.0%) |
| Finance & Insurance | 0 (0.0%) | 29 (100.0%) |
| Real Estate, Rental & Leasing | 3 (42.9%) | 4 (57.1%) |
| Professional & Scientific | 0 (0.0%) | 10 (100.0%) |
| Enterprise Management | 0 (0.0%) | 0 (0.0%) |
| Administrative & Support | 28 (60.9%) | 18 (39.1%) |
| Educational Services | 34 (24.1%) | 107 (75.9%) |
| Health Care & Social Assistance | 8 (6.5%) | 116 (93.5%) |
| Arts, Entertainment & Recreation | 0 (0.0%) | 14 (100.0%) |
| Accommodation & Food Services | 45 (77.6%) | 13 (22.4%) |
| Public Administration | 56 (90.3%) | 6 (9.7%) |
| Total | 359 (46.0%) | 422 (54.0%) |
Education in Catawissa borough
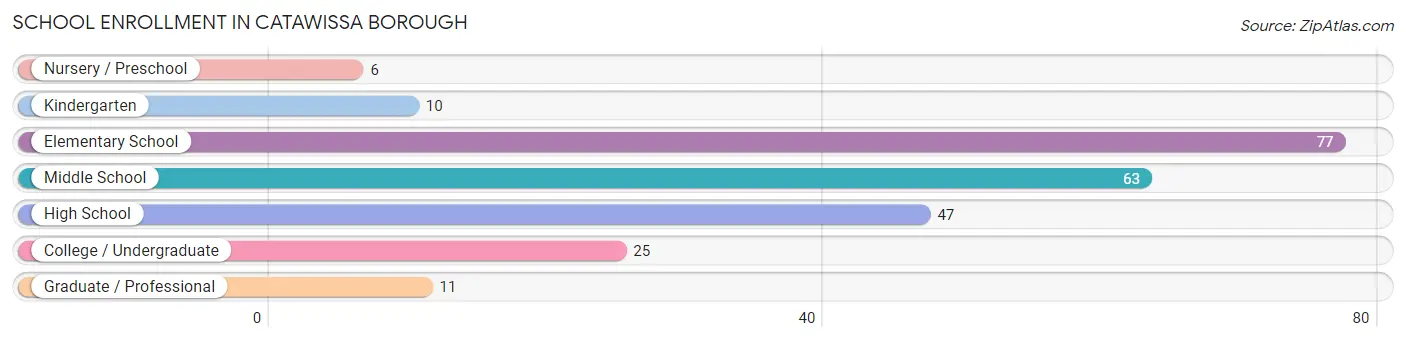
School Enrollment in Catawissa borough
The most common levels of schooling among the 239 students in Catawissa borough are elementary school (77 | 32.2%), middle school (63 | 26.4%), and high school (47 | 19.7%).
| School Level | # Students | % Students |
| Nursery / Preschool | 6 | 2.5% |
| Kindergarten | 10 | 4.2% |
| Elementary School | 77 | 32.2% |
| Middle School | 63 | 26.4% |
| High School | 47 | 19.7% |
| College / Undergraduate | 25 | 10.5% |
| Graduate / Professional | 11 | 4.6% |
| Total | 239 | 100.0% |
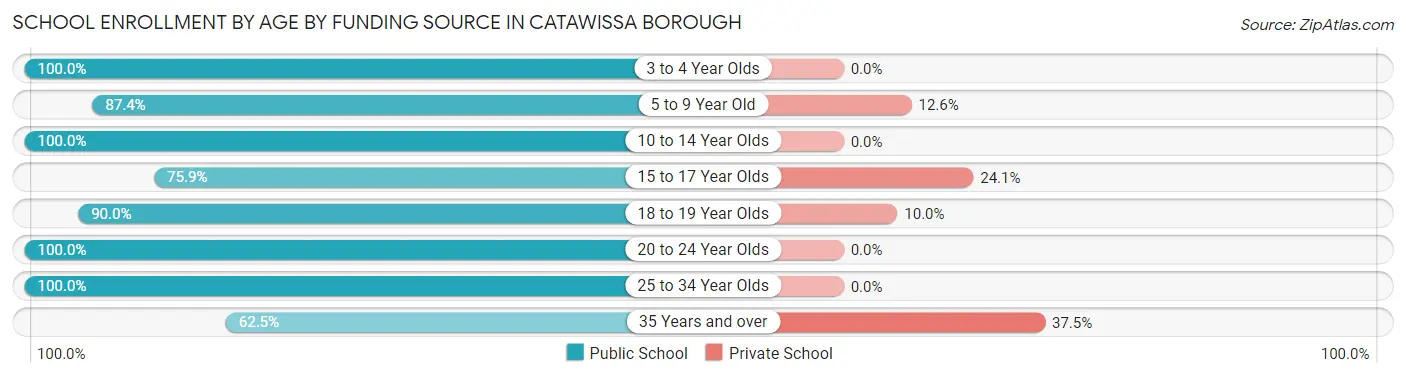
School Enrollment by Age by Funding Source in Catawissa borough
Out of a total of 239 students who are enrolled in schools in Catawissa borough, 22 (9.2%) attend a private institution, while the remaining 217 (90.8%) are enrolled in public schools. The age group of 35 years and over has the highest likelihood of being enrolled in private schools, with 3 (37.5% in the age bracket) enrolled. Conversely, the age group of 3 to 4 year olds has the lowest likelihood of being enrolled in a private school, with 6 (100.0% in the age bracket) attending a public institution.
| Age Bracket | Public School | Private School |
| 3 to 4 Year Olds | 6 (100.0%) | 0 (0.0%) |
| 5 to 9 Year Old | 76 (87.4%) | 11 (12.6%) |
| 10 to 14 Year Olds | 71 (100.0%) | 0 (0.0%) |
| 15 to 17 Year Olds | 22 (75.9%) | 7 (24.1%) |
| 18 to 19 Year Olds | 9 (90.0%) | 1 (10.0%) |
| 20 to 24 Year Olds | 11 (100.0%) | 0 (0.0%) |
| 25 to 34 Year Olds | 17 (100.0%) | 0 (0.0%) |
| 35 Years and over | 5 (62.5%) | 3 (37.5%) |
| Total | 217 (90.8%) | 22 (9.2%) |
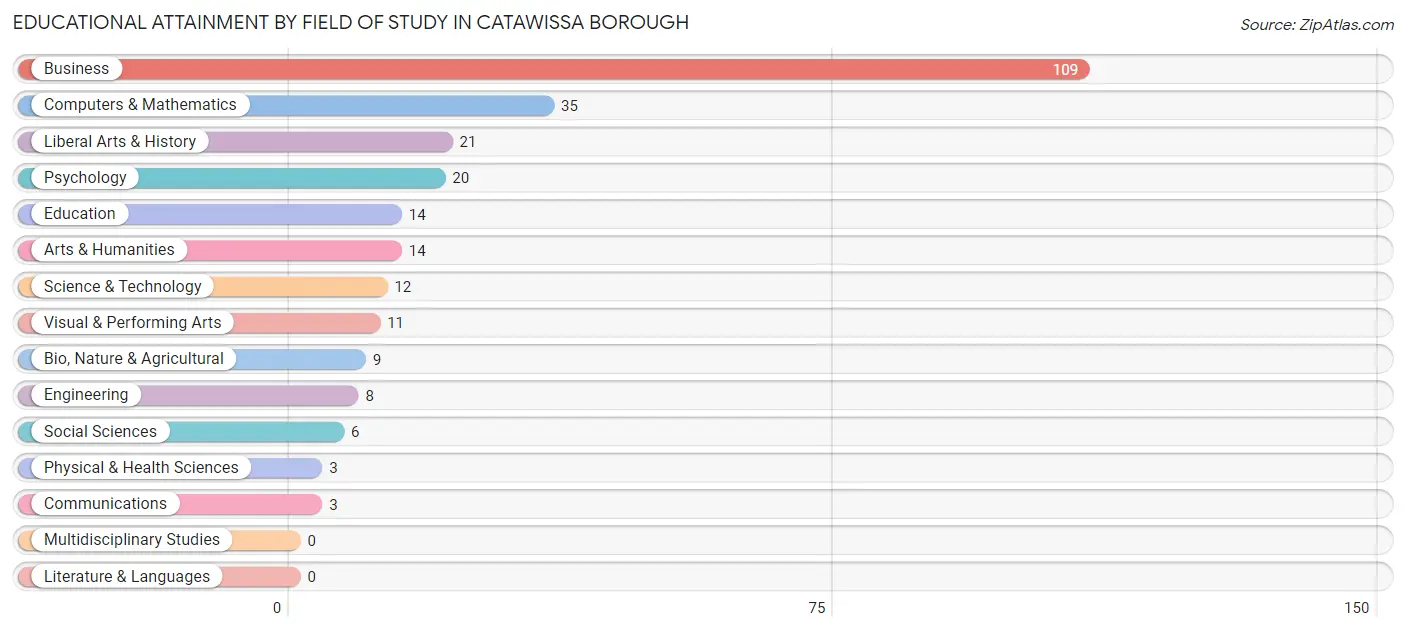
Educational Attainment by Field of Study in Catawissa borough
Business (109 | 41.1%), computers & mathematics (35 | 13.2%), liberal arts & history (21 | 7.9%), psychology (20 | 7.5%), and education (14 | 5.3%) are the most common fields of study among 265 individuals in Catawissa borough who have obtained a bachelor's degree or higher.
| Field of Study | # Graduates | % Graduates |
| Computers & Mathematics | 35 | 13.2% |
| Bio, Nature & Agricultural | 9 | 3.4% |
| Physical & Health Sciences | 3 | 1.1% |
| Psychology | 20 | 7.5% |
| Social Sciences | 6 | 2.3% |
| Engineering | 8 | 3.0% |
| Multidisciplinary Studies | 0 | 0.0% |
| Science & Technology | 12 | 4.5% |
| Business | 109 | 41.1% |
| Education | 14 | 5.3% |
| Literature & Languages | 0 | 0.0% |
| Liberal Arts & History | 21 | 7.9% |
| Visual & Performing Arts | 11 | 4.2% |
| Communications | 3 | 1.1% |
| Arts & Humanities | 14 | 5.3% |
| Total | 265 | 100.0% |
Transportation & Commute in Catawissa borough
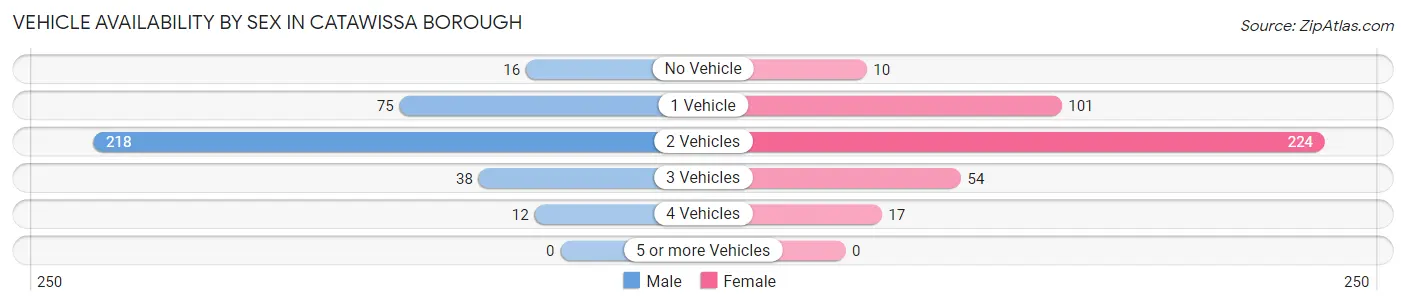
Vehicle Availability by Sex in Catawissa borough
The most prevalent vehicle ownership categories in Catawissa borough are males with 2 vehicles (218, accounting for 60.7%) and females with 2 vehicles (224, making up 53.7%).
| Vehicles Available | Male | Female |
| No Vehicle | 16 (4.5%) | 10 (2.5%) |
| 1 Vehicle | 75 (20.9%) | 101 (24.9%) |
| 2 Vehicles | 218 (60.7%) | 224 (55.2%) |
| 3 Vehicles | 38 (10.6%) | 54 (13.3%) |
| 4 Vehicles | 12 (3.3%) | 17 (4.2%) |
| 5 or more Vehicles | 0 (0.0%) | 0 (0.0%) |
| Total | 359 (100.0%) | 406 (100.0%) |
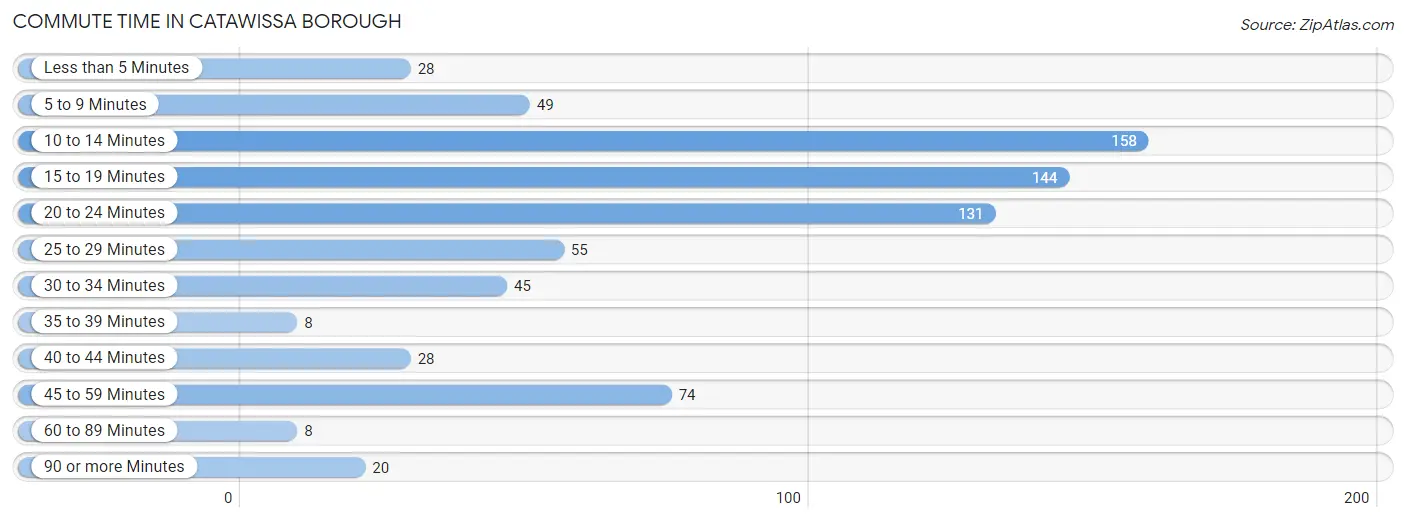
Commute Time in Catawissa borough
The most frequently occuring commute durations in Catawissa borough are 10 to 14 minutes (158 commuters, 21.1%), 15 to 19 minutes (144 commuters, 19.3%), and 20 to 24 minutes (131 commuters, 17.5%).
| Commute Time | # Commuters | % Commuters |
| Less than 5 Minutes | 28 | 3.7% |
| 5 to 9 Minutes | 49 | 6.6% |
| 10 to 14 Minutes | 158 | 21.1% |
| 15 to 19 Minutes | 144 | 19.3% |
| 20 to 24 Minutes | 131 | 17.5% |
| 25 to 29 Minutes | 55 | 7.3% |
| 30 to 34 Minutes | 45 | 6.0% |
| 35 to 39 Minutes | 8 | 1.1% |
| 40 to 44 Minutes | 28 | 3.7% |
| 45 to 59 Minutes | 74 | 9.9% |
| 60 to 89 Minutes | 8 | 1.1% |
| 90 or more Minutes | 20 | 2.7% |
Commute Time by Sex in Catawissa borough
The most common commute times in Catawissa borough are 15 to 19 minutes (78 commuters, 21.9%) for males and 10 to 14 minutes (123 commuters, 31.4%) for females.
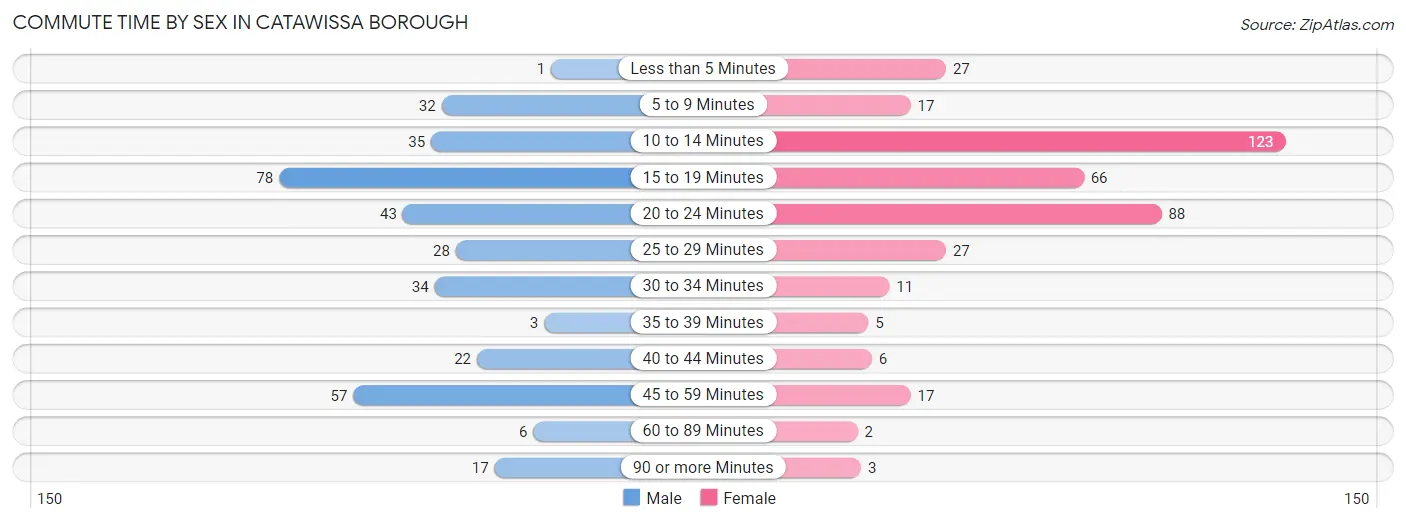
| Commute Time | Male | Female |
| Less than 5 Minutes | 1 (0.3%) | 27 (6.9%) |
| 5 to 9 Minutes | 32 (9.0%) | 17 (4.3%) |
| 10 to 14 Minutes | 35 (9.8%) | 123 (31.4%) |
| 15 to 19 Minutes | 78 (21.9%) | 66 (16.8%) |
| 20 to 24 Minutes | 43 (12.1%) | 88 (22.5%) |
| 25 to 29 Minutes | 28 (7.9%) | 27 (6.9%) |
| 30 to 34 Minutes | 34 (9.6%) | 11 (2.8%) |
| 35 to 39 Minutes | 3 (0.8%) | 5 (1.3%) |
| 40 to 44 Minutes | 22 (6.2%) | 6 (1.5%) |
| 45 to 59 Minutes | 57 (16.0%) | 17 (4.3%) |
| 60 to 89 Minutes | 6 (1.7%) | 2 (0.5%) |
| 90 or more Minutes | 17 (4.8%) | 3 (0.8%) |
Time of Departure to Work by Sex in Catawissa borough
The most frequent times of departure to work in Catawissa borough are 6:00 AM to 6:29 AM (83, 23.3%) for males and 7:00 AM to 7:29 AM (111, 28.3%) for females.
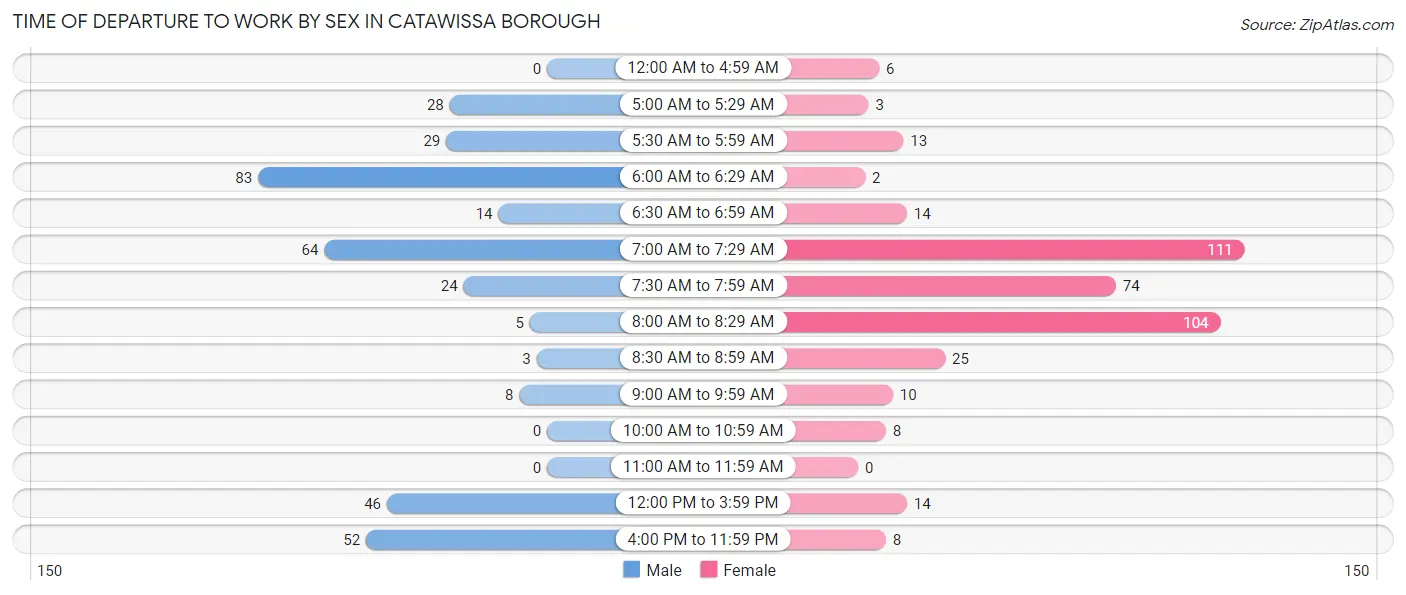
| Time of Departure | Male | Female |
| 12:00 AM to 4:59 AM | 0 (0.0%) | 6 (1.5%) |
| 5:00 AM to 5:29 AM | 28 (7.9%) | 3 (0.8%) |
| 5:30 AM to 5:59 AM | 29 (8.2%) | 13 (3.3%) |
| 6:00 AM to 6:29 AM | 83 (23.3%) | 2 (0.5%) |
| 6:30 AM to 6:59 AM | 14 (3.9%) | 14 (3.6%) |
| 7:00 AM to 7:29 AM | 64 (18.0%) | 111 (28.3%) |
| 7:30 AM to 7:59 AM | 24 (6.7%) | 74 (18.9%) |
| 8:00 AM to 8:29 AM | 5 (1.4%) | 104 (26.5%) |
| 8:30 AM to 8:59 AM | 3 (0.8%) | 25 (6.4%) |
| 9:00 AM to 9:59 AM | 8 (2.2%) | 10 (2.5%) |
| 10:00 AM to 10:59 AM | 0 (0.0%) | 8 (2.0%) |
| 11:00 AM to 11:59 AM | 0 (0.0%) | 0 (0.0%) |
| 12:00 PM to 3:59 PM | 46 (12.9%) | 14 (3.6%) |
| 4:00 PM to 11:59 PM | 52 (14.6%) | 8 (2.0%) |
| Total | 356 (100.0%) | 392 (100.0%) |
Housing Occupancy in Catawissa borough
Occupancy by Ownership in Catawissa borough
Of the total 667 dwellings in Catawissa borough, owner-occupied units account for 345 (51.7%), while renter-occupied units make up 322 (48.3%).
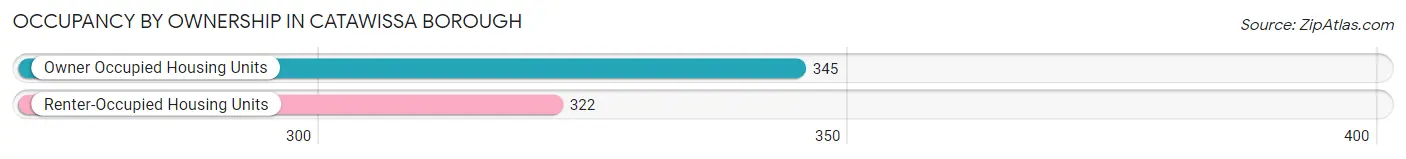
| Occupancy | # Housing Units | % Housing Units |
| Owner Occupied Housing Units | 345 | 51.7% |
| Renter-Occupied Housing Units | 322 | 48.3% |
| Total Occupied Housing Units | 667 | 100.0% |
Occupancy by Household Size in Catawissa borough
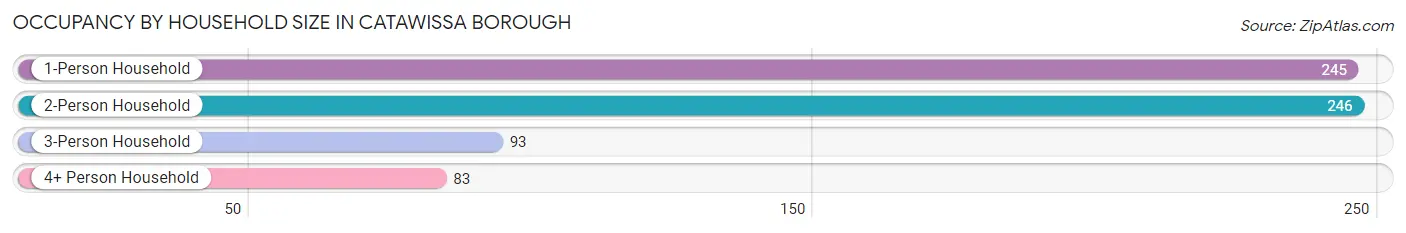
| Household Size | # Housing Units | % Housing Units |
| 1-Person Household | 245 | 36.7% |
| 2-Person Household | 246 | 36.9% |
| 3-Person Household | 93 | 13.9% |
| 4+ Person Household | 83 | 12.4% |
| Total Housing Units | 667 | 100.0% |
Occupancy by Ownership by Household Size in Catawissa borough
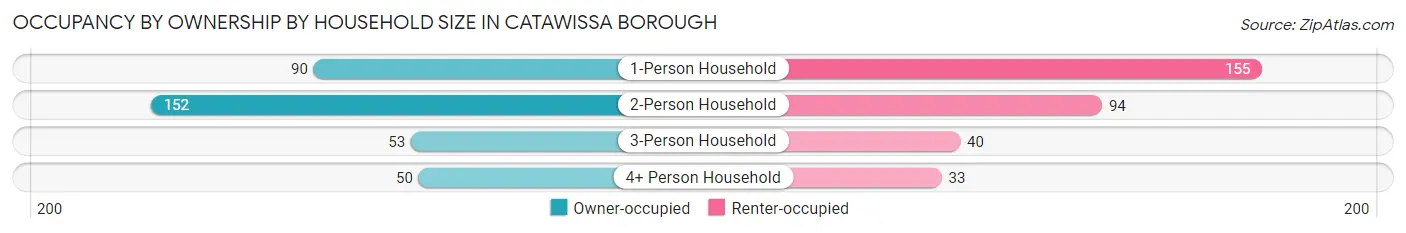
| Household Size | Owner-occupied | Renter-occupied |
| 1-Person Household | 90 (36.7%) | 155 (63.3%) |
| 2-Person Household | 152 (61.8%) | 94 (38.2%) |
| 3-Person Household | 53 (57.0%) | 40 (43.0%) |
| 4+ Person Household | 50 (60.2%) | 33 (39.8%) |
| Total Housing Units | 345 (51.7%) | 322 (48.3%) |
Occupancy by Educational Attainment in Catawissa borough
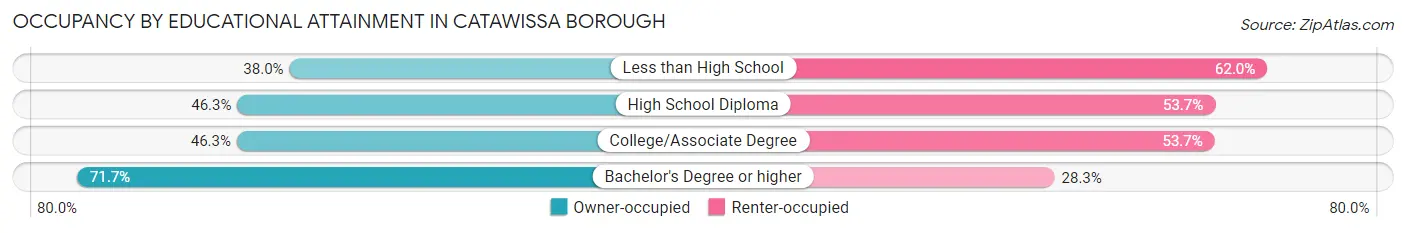
| Household Size | Owner-occupied | Renter-occupied |
| Less than High School | 19 (38.0%) | 31 (62.0%) |
| High School Diploma | 136 (46.3%) | 158 (53.7%) |
| College/Associate Degree | 76 (46.3%) | 88 (53.7%) |
| Bachelor's Degree or higher | 114 (71.7%) | 45 (28.3%) |
Occupancy by Age of Householder in Catawissa borough
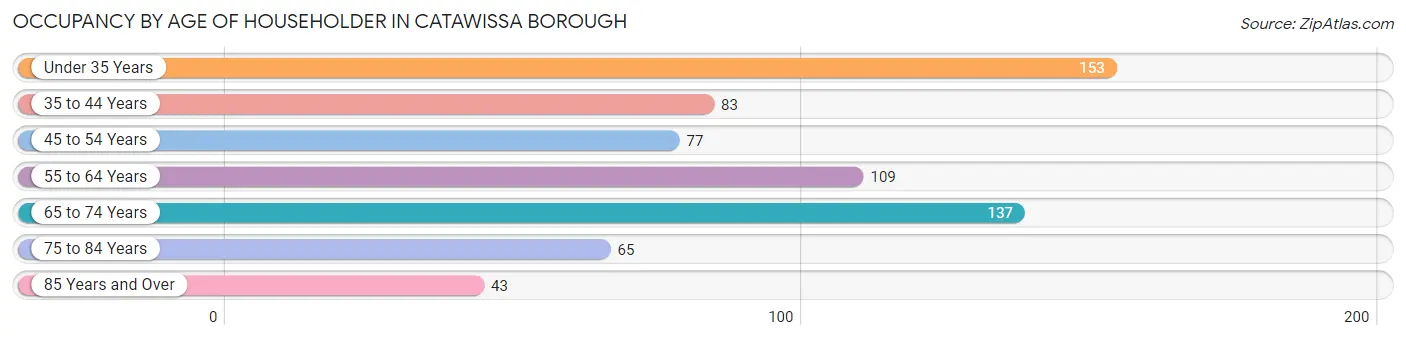
| Age Bracket | # Households | % Households |
| Under 35 Years | 153 | 22.9% |
| 35 to 44 Years | 83 | 12.4% |
| 45 to 54 Years | 77 | 11.5% |
| 55 to 64 Years | 109 | 16.3% |
| 65 to 74 Years | 137 | 20.5% |
| 75 to 84 Years | 65 | 9.8% |
| 85 Years and Over | 43 | 6.5% |
| Total | 667 | 100.0% |
Housing Finances in Catawissa borough
Median Income by Occupancy in Catawissa borough
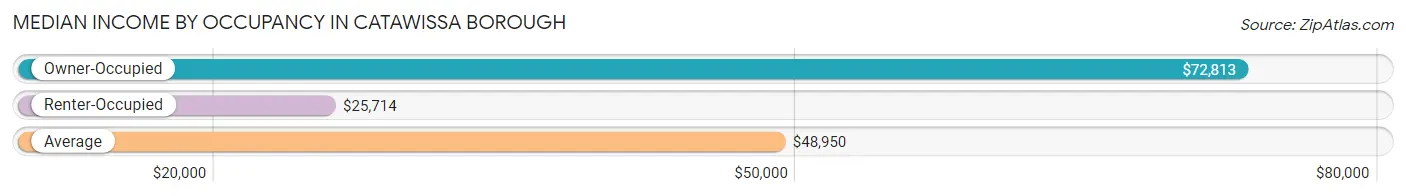
| Occupancy Type | # Households | Median Income |
| Owner-Occupied | 345 (51.7%) | $72,813 |
| Renter-Occupied | 322 (48.3%) | $25,714 |
| Average | 667 (100.0%) | $48,950 |
Occupancy by Householder Income Bracket in Catawissa borough
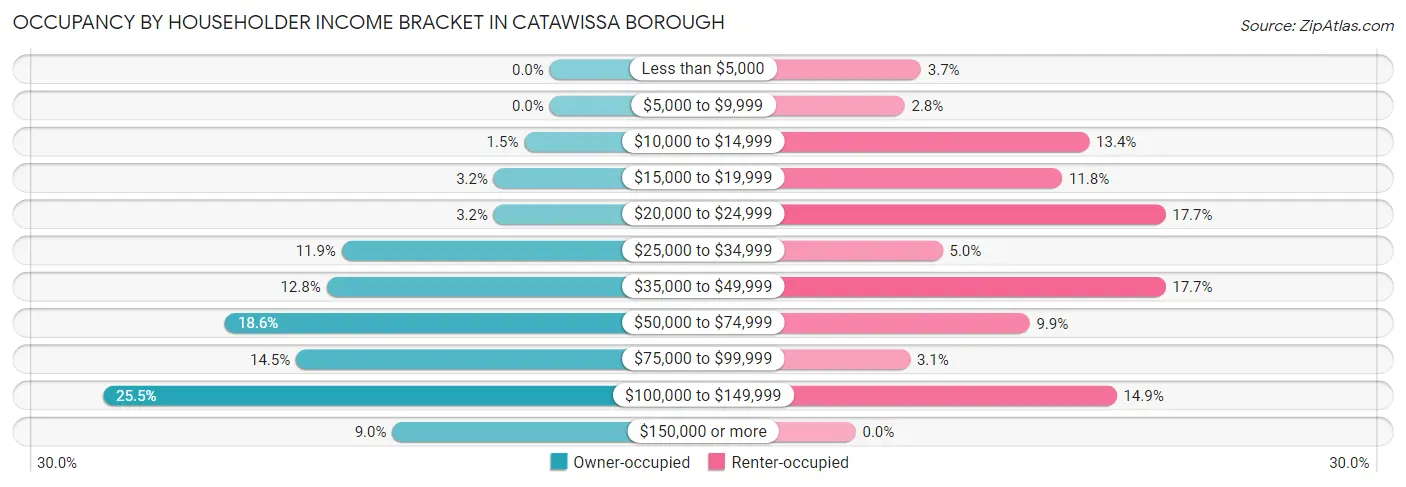
| Income Bracket | Owner-occupied | Renter-occupied |
| Less than $5,000 | 0 (0.0%) | 12 (3.7%) |
| $5,000 to $9,999 | 0 (0.0%) | 9 (2.8%) |
| $10,000 to $14,999 | 5 (1.5%) | 43 (13.4%) |
| $15,000 to $19,999 | 11 (3.2%) | 38 (11.8%) |
| $20,000 to $24,999 | 11 (3.2%) | 57 (17.7%) |
| $25,000 to $34,999 | 41 (11.9%) | 16 (5.0%) |
| $35,000 to $49,999 | 44 (12.8%) | 57 (17.7%) |
| $50,000 to $74,999 | 64 (18.5%) | 32 (9.9%) |
| $75,000 to $99,999 | 50 (14.5%) | 10 (3.1%) |
| $100,000 to $149,999 | 88 (25.5%) | 48 (14.9%) |
| $150,000 or more | 31 (9.0%) | 0 (0.0%) |
| Total | 345 (100.0%) | 322 (100.0%) |
Monthly Housing Cost Tiers in Catawissa borough
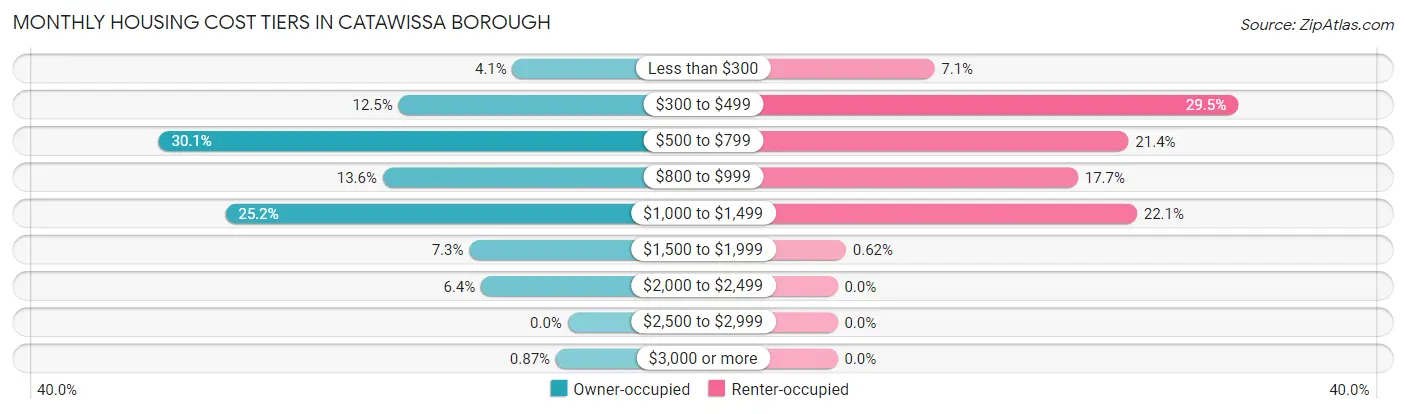
| Monthly Cost | Owner-occupied | Renter-occupied |
| Less than $300 | 14 (4.1%) | 23 (7.1%) |
| $300 to $499 | 43 (12.5%) | 95 (29.5%) |
| $500 to $799 | 104 (30.1%) | 69 (21.4%) |
| $800 to $999 | 47 (13.6%) | 57 (17.7%) |
| $1,000 to $1,499 | 87 (25.2%) | 71 (22.1%) |
| $1,500 to $1,999 | 25 (7.2%) | 2 (0.6%) |
| $2,000 to $2,499 | 22 (6.4%) | 0 (0.0%) |
| $2,500 to $2,999 | 0 (0.0%) | 0 (0.0%) |
| $3,000 or more | 3 (0.9%) | 0 (0.0%) |
| Total | 345 (100.0%) | 322 (100.0%) |
Physical Housing Characteristics in Catawissa borough
Housing Structures in Catawissa borough
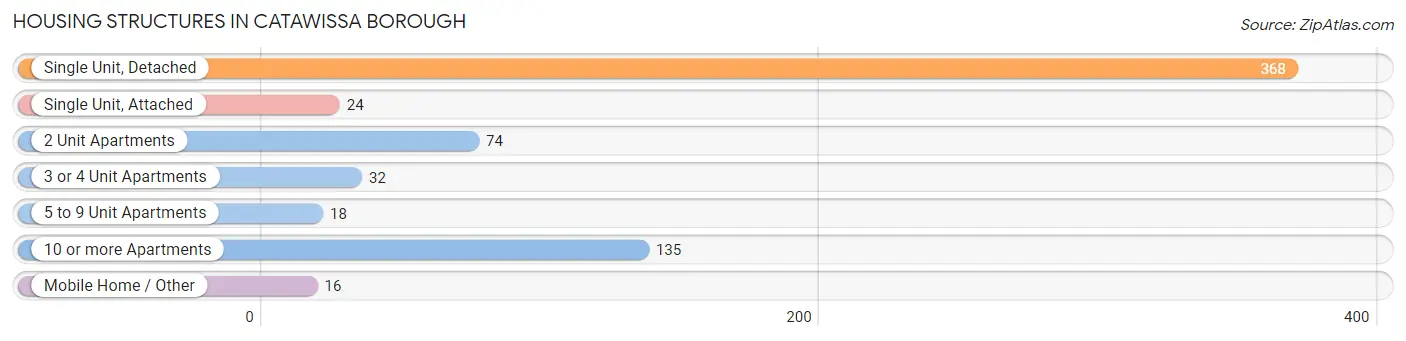
| Structure Type | # Housing Units | % Housing Units |
| Single Unit, Detached | 368 | 55.2% |
| Single Unit, Attached | 24 | 3.6% |
| 2 Unit Apartments | 74 | 11.1% |
| 3 or 4 Unit Apartments | 32 | 4.8% |
| 5 to 9 Unit Apartments | 18 | 2.7% |
| 10 or more Apartments | 135 | 20.2% |
| Mobile Home / Other | 16 | 2.4% |
| Total | 667 | 100.0% |
Housing Structures by Occupancy in Catawissa borough
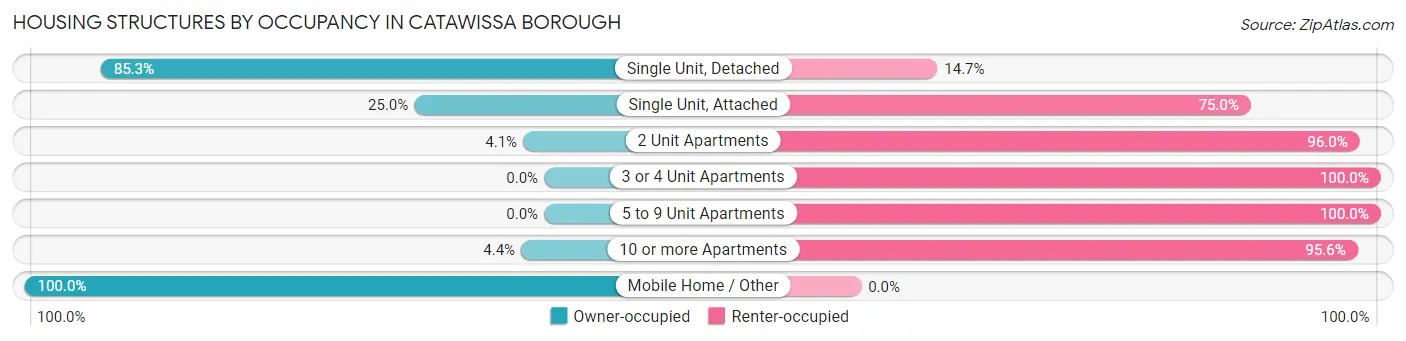
| Structure Type | Owner-occupied | Renter-occupied |
| Single Unit, Detached | 314 (85.3%) | 54 (14.7%) |
| Single Unit, Attached | 6 (25.0%) | 18 (75.0%) |
| 2 Unit Apartments | 3 (4.1%) | 71 (96.0%) |
| 3 or 4 Unit Apartments | 0 (0.0%) | 32 (100.0%) |
| 5 to 9 Unit Apartments | 0 (0.0%) | 18 (100.0%) |
| 10 or more Apartments | 6 (4.4%) | 129 (95.6%) |
| Mobile Home / Other | 16 (100.0%) | 0 (0.0%) |
| Total | 345 (51.7%) | 322 (48.3%) |
Housing Structures by Number of Rooms in Catawissa borough
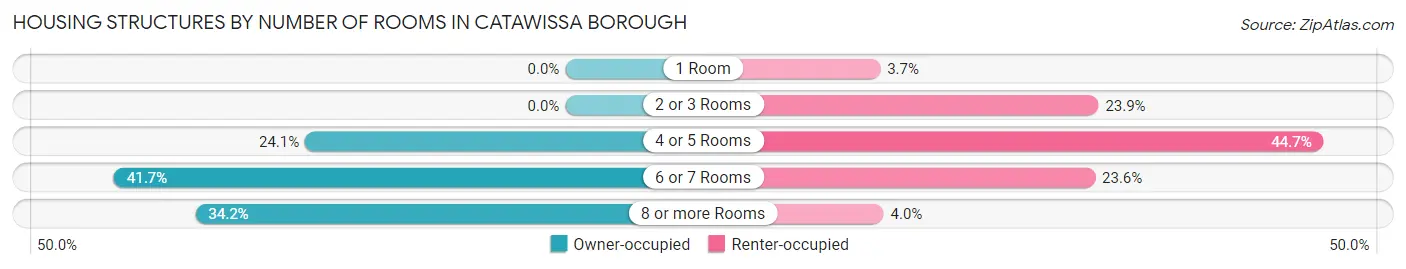
| Number of Rooms | Owner-occupied | Renter-occupied |
| 1 Room | 0 (0.0%) | 12 (3.7%) |
| 2 or 3 Rooms | 0 (0.0%) | 77 (23.9%) |
| 4 or 5 Rooms | 83 (24.1%) | 144 (44.7%) |
| 6 or 7 Rooms | 144 (41.7%) | 76 (23.6%) |
| 8 or more Rooms | 118 (34.2%) | 13 (4.0%) |
| Total | 345 (100.0%) | 322 (100.0%) |
Housing Structure by Heating Type in Catawissa borough
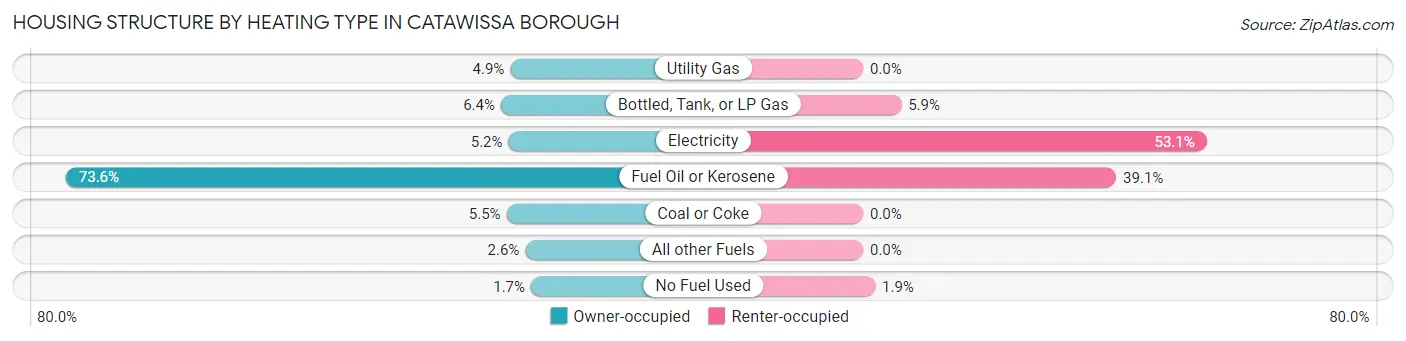
| Heating Type | Owner-occupied | Renter-occupied |
| Utility Gas | 17 (4.9%) | 0 (0.0%) |
| Bottled, Tank, or LP Gas | 22 (6.4%) | 19 (5.9%) |
| Electricity | 18 (5.2%) | 171 (53.1%) |
| Fuel Oil or Kerosene | 254 (73.6%) | 126 (39.1%) |
| Coal or Coke | 19 (5.5%) | 0 (0.0%) |
| All other Fuels | 9 (2.6%) | 0 (0.0%) |
| No Fuel Used | 6 (1.7%) | 6 (1.9%) |
| Total | 345 (100.0%) | 322 (100.0%) |
Household Vehicle Usage in Catawissa borough
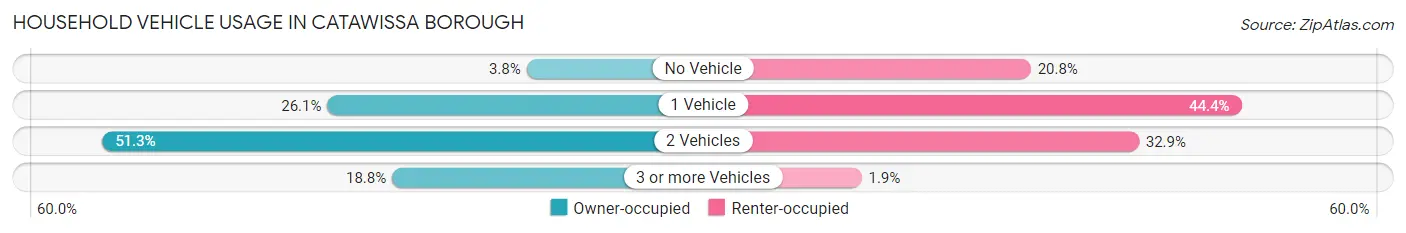
| Vehicles per Household | Owner-occupied | Renter-occupied |
| No Vehicle | 13 (3.8%) | 67 (20.8%) |
| 1 Vehicle | 90 (26.1%) | 143 (44.4%) |
| 2 Vehicles | 177 (51.3%) | 106 (32.9%) |
| 3 or more Vehicles | 65 (18.8%) | 6 (1.9%) |
| Total | 345 (100.0%) | 322 (100.0%) |
Real Estate & Mortgages in Catawissa borough
Real Estate and Mortgage Overview in Catawissa borough
| Characteristic | Without Mortgage | With Mortgage |
| Housing Units | 153 | 192 |
| Median Property Value | $117,400 | $136,500 |
| Median Household Income | $52,386 | $17 |
| Monthly Housing Costs | $572 | $3 |
| Real Estate Taxes | $1,414 | $0 |
Property Value by Mortgage Status in Catawissa borough
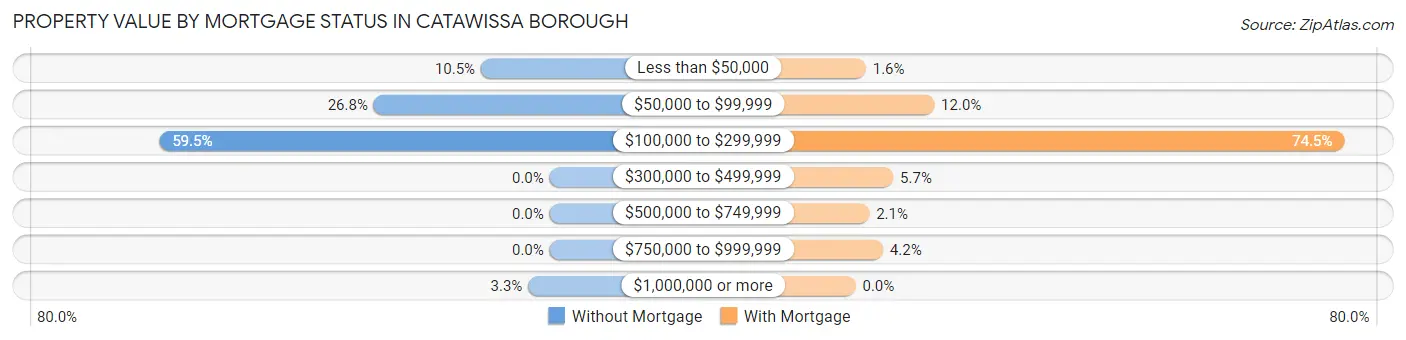
| Property Value | Without Mortgage | With Mortgage |
| Less than $50,000 | 16 (10.5%) | 3 (1.6%) |
| $50,000 to $99,999 | 41 (26.8%) | 23 (12.0%) |
| $100,000 to $299,999 | 91 (59.5%) | 143 (74.5%) |
| $300,000 to $499,999 | 0 (0.0%) | 11 (5.7%) |
| $500,000 to $749,999 | 0 (0.0%) | 4 (2.1%) |
| $750,000 to $999,999 | 0 (0.0%) | 8 (4.2%) |
| $1,000,000 or more | 5 (3.3%) | 0 (0.0%) |
| Total | 153 (100.0%) | 192 (100.0%) |
Household Income by Mortgage Status in Catawissa borough
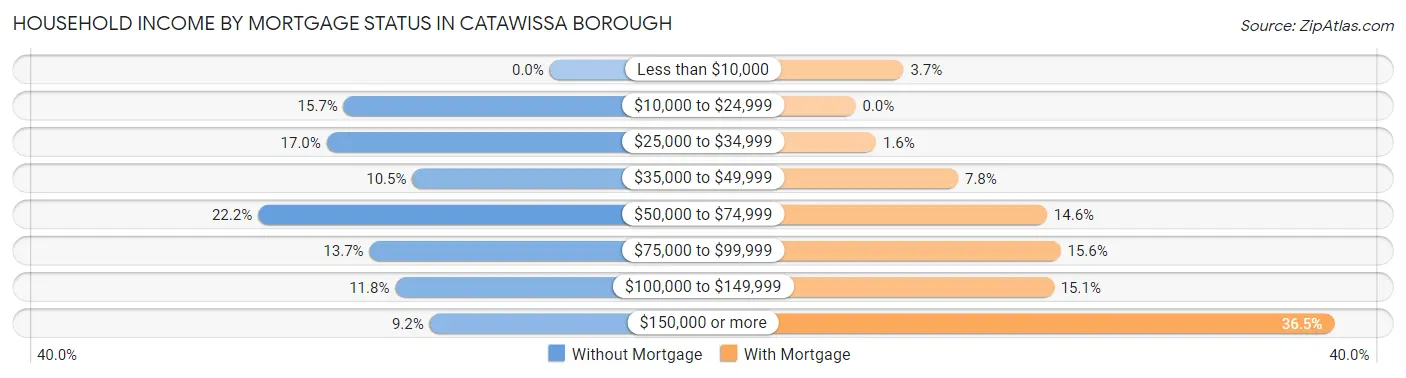
| Household Income | Without Mortgage | With Mortgage |
| Less than $10,000 | 0 (0.0%) | 7 (3.6%) |
| $10,000 to $24,999 | 24 (15.7%) | 0 (0.0%) |
| $25,000 to $34,999 | 26 (17.0%) | 3 (1.6%) |
| $35,000 to $49,999 | 16 (10.5%) | 15 (7.8%) |
| $50,000 to $74,999 | 34 (22.2%) | 28 (14.6%) |
| $75,000 to $99,999 | 21 (13.7%) | 30 (15.6%) |
| $100,000 to $149,999 | 18 (11.8%) | 29 (15.1%) |
| $150,000 or more | 14 (9.1%) | 70 (36.5%) |
| Total | 153 (100.0%) | 192 (100.0%) |
Property Value to Household Income Ratio in Catawissa borough
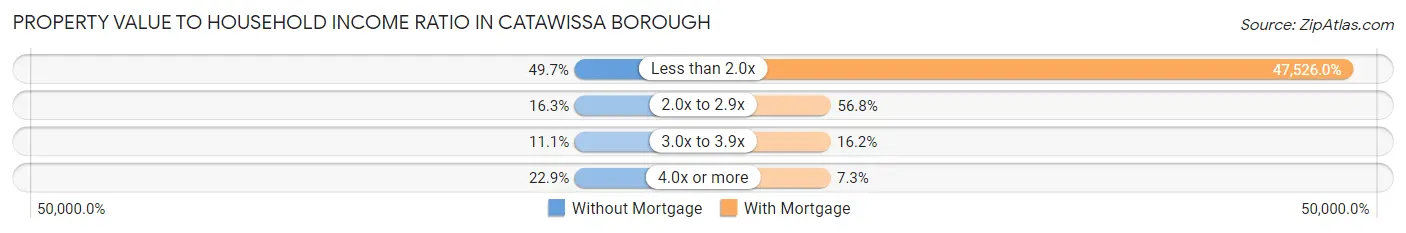
| Value-to-Income Ratio | Without Mortgage | With Mortgage |
| Less than 2.0x | 76 (49.7%) | 91,250 (47,526.0%) |
| 2.0x to 2.9x | 25 (16.3%) | 109 (56.8%) |
| 3.0x to 3.9x | 17 (11.1%) | 31 (16.2%) |
| 4.0x or more | 35 (22.9%) | 14 (7.3%) |
| Total | 153 (100.0%) | 192 (100.0%) |
Real Estate Taxes by Mortgage Status in Catawissa borough
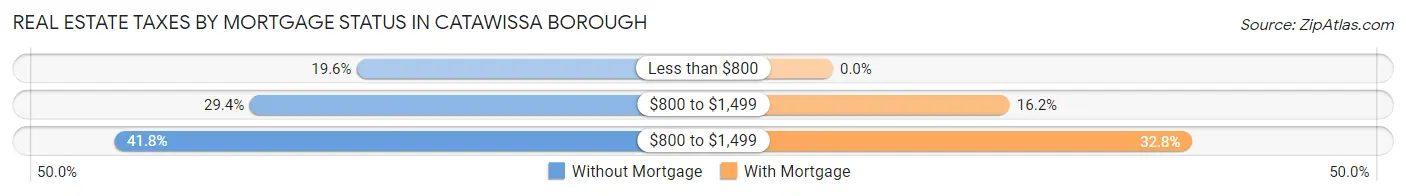
| Property Taxes | Without Mortgage | With Mortgage |
| Less than $800 | 30 (19.6%) | 0 (0.0%) |
| $800 to $1,499 | 45 (29.4%) | 31 (16.2%) |
| $800 to $1,499 | 64 (41.8%) | 63 (32.8%) |
| Total | 153 (100.0%) | 192 (100.0%) |
Health & Disability in Catawissa borough
Health Insurance Coverage by Age in Catawissa borough
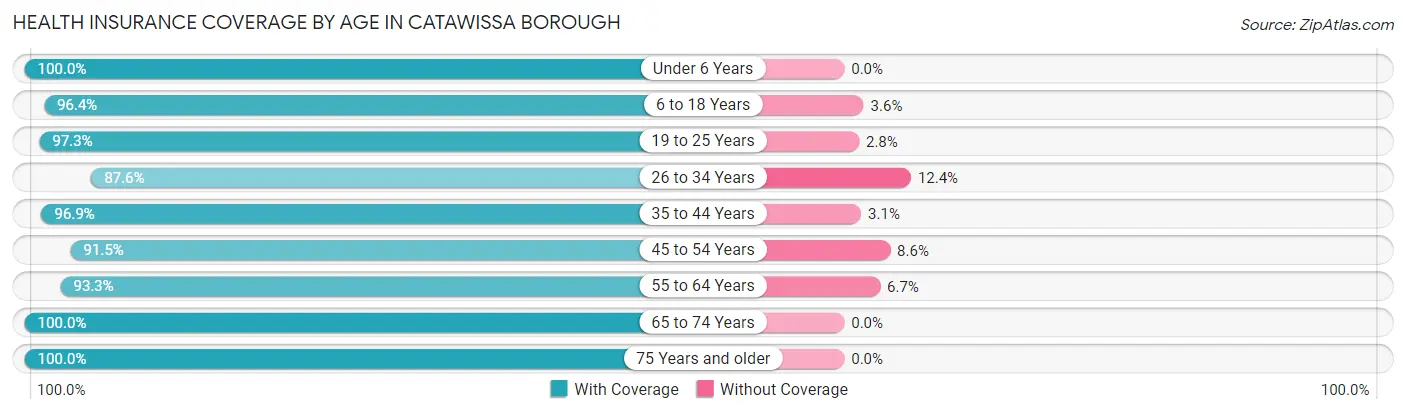
| Age Bracket | With Coverage | Without Coverage |
| Under 6 Years | 58 (100.0%) | 0 (0.0%) |
| 6 to 18 Years | 187 (96.4%) | 7 (3.6%) |
| 19 to 25 Years | 106 (97.3%) | 3 (2.8%) |
| 26 to 34 Years | 162 (87.6%) | 23 (12.4%) |
| 35 to 44 Years | 154 (96.9%) | 5 (3.1%) |
| 45 to 54 Years | 107 (91.4%) | 10 (8.6%) |
| 55 to 64 Years | 168 (93.3%) | 12 (6.7%) |
| 65 to 74 Years | 254 (100.0%) | 0 (0.0%) |
| 75 Years and older | 131 (100.0%) | 0 (0.0%) |
| Total | 1,327 (95.7%) | 60 (4.3%) |
Health Insurance Coverage by Citizenship Status in Catawissa borough
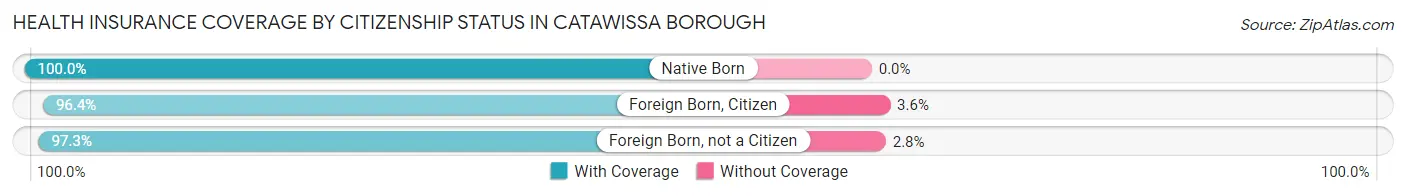
| Citizenship Status | With Coverage | Without Coverage |
| Native Born | 58 (100.0%) | 0 (0.0%) |
| Foreign Born, Citizen | 187 (96.4%) | 7 (3.6%) |
| Foreign Born, not a Citizen | 106 (97.3%) | 3 (2.8%) |
Health Insurance Coverage by Household Income in Catawissa borough
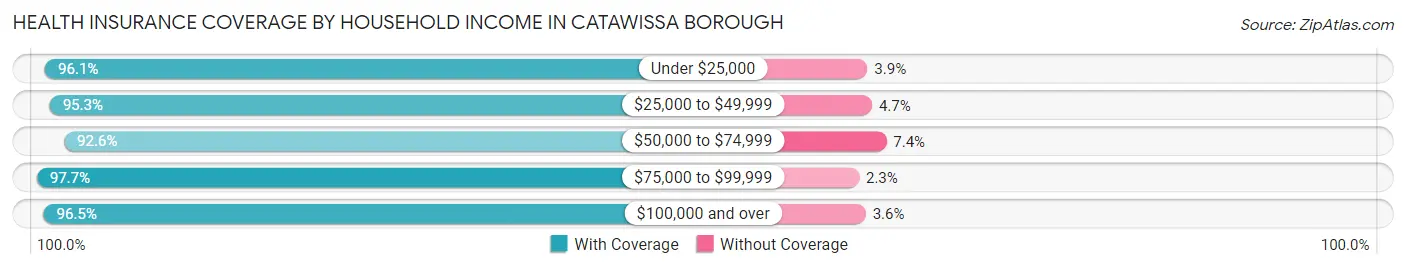
| Household Income | With Coverage | Without Coverage |
| Under $25,000 | 249 (96.1%) | 10 (3.9%) |
| $25,000 to $49,999 | 283 (95.3%) | 14 (4.7%) |
| $50,000 to $74,999 | 200 (92.6%) | 16 (7.4%) |
| $75,000 to $99,999 | 128 (97.7%) | 3 (2.3%) |
| $100,000 and over | 462 (96.5%) | 17 (3.5%) |
Public vs Private Health Insurance Coverage by Age in Catawissa borough
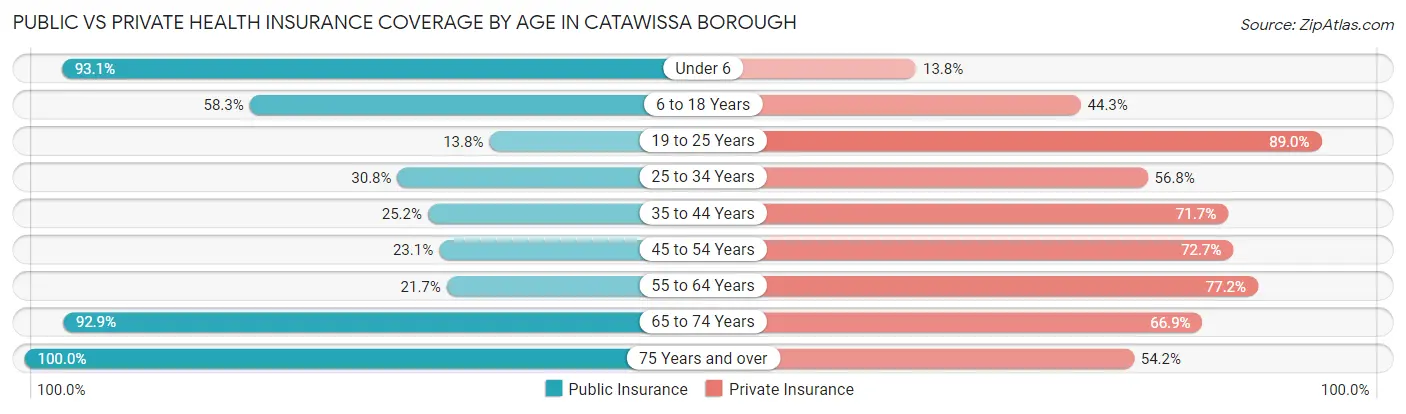
| Age Bracket | Public Insurance | Private Insurance |
| Under 6 | 54 (93.1%) | 8 (13.8%) |
| 6 to 18 Years | 113 (58.3%) | 86 (44.3%) |
| 19 to 25 Years | 15 (13.8%) | 97 (89.0%) |
| 25 to 34 Years | 57 (30.8%) | 105 (56.8%) |
| 35 to 44 Years | 40 (25.2%) | 114 (71.7%) |
| 45 to 54 Years | 27 (23.1%) | 85 (72.7%) |
| 55 to 64 Years | 39 (21.7%) | 139 (77.2%) |
| 65 to 74 Years | 236 (92.9%) | 170 (66.9%) |
| 75 Years and over | 131 (100.0%) | 71 (54.2%) |
| Total | 712 (51.3%) | 875 (63.1%) |
Disability Status by Sex by Age in Catawissa borough
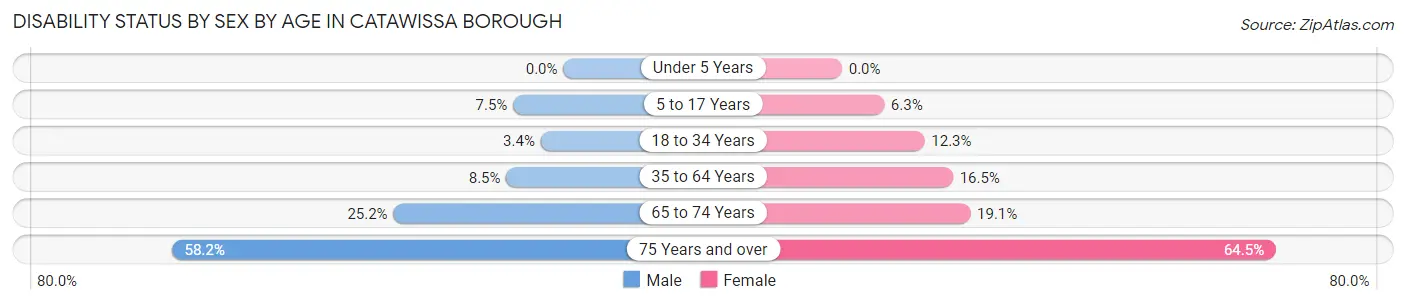
| Age Bracket | Male | Female |
| Under 5 Years | 0 (0.0%) | 0 (0.0%) |
| 5 to 17 Years | 7 (7.4%) | 6 (6.2%) |
| 18 to 34 Years | 5 (3.4%) | 19 (12.3%) |
| 35 to 64 Years | 17 (8.5%) | 42 (16.5%) |
| 65 to 74 Years | 27 (25.2%) | 28 (19.1%) |
| 75 Years and over | 32 (58.2%) | 49 (64.5%) |
Disability Class by Sex by Age in Catawissa borough
Disability Class: Hearing Difficulty
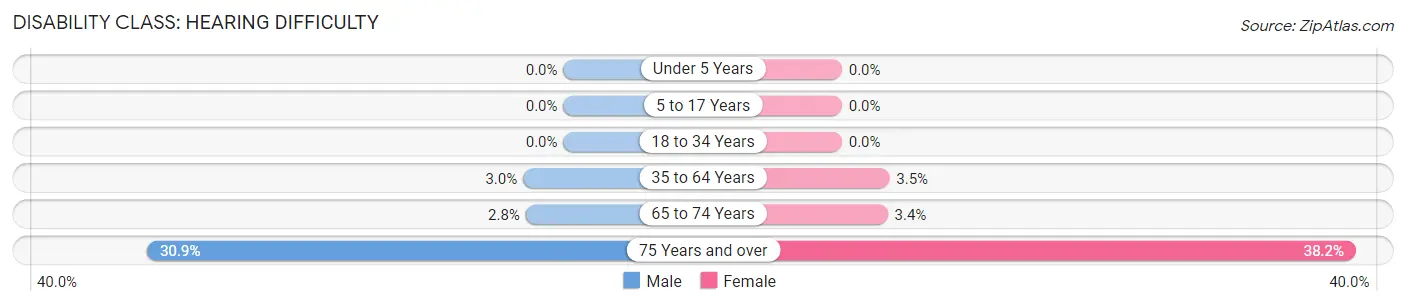
| Age Bracket | Male | Female |
| Under 5 Years | 0 (0.0%) | 0 (0.0%) |
| 5 to 17 Years | 0 (0.0%) | 0 (0.0%) |
| 18 to 34 Years | 0 (0.0%) | 0 (0.0%) |
| 35 to 64 Years | 6 (3.0%) | 9 (3.5%) |
| 65 to 74 Years | 3 (2.8%) | 5 (3.4%) |
| 75 Years and over | 17 (30.9%) | 29 (38.2%) |
Disability Class: Vision Difficulty
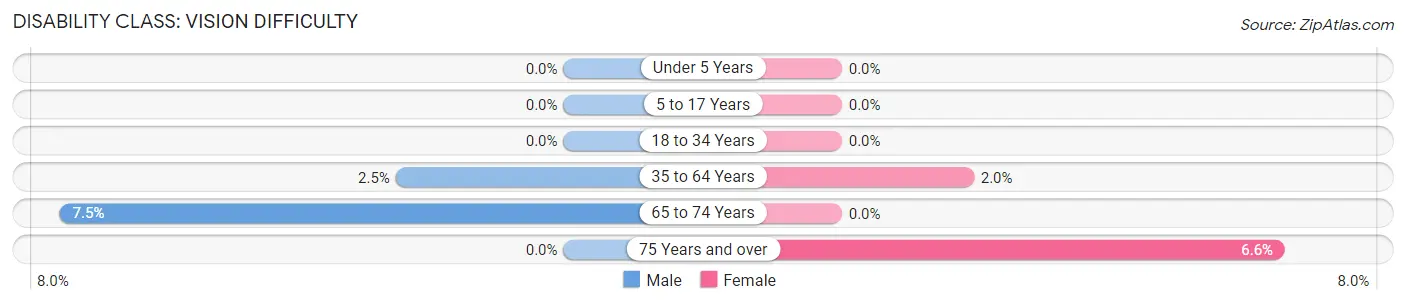
| Age Bracket | Male | Female |
| Under 5 Years | 0 (0.0%) | 0 (0.0%) |
| 5 to 17 Years | 0 (0.0%) | 0 (0.0%) |
| 18 to 34 Years | 0 (0.0%) | 0 (0.0%) |
| 35 to 64 Years | 5 (2.5%) | 5 (2.0%) |
| 65 to 74 Years | 8 (7.5%) | 0 (0.0%) |
| 75 Years and over | 0 (0.0%) | 5 (6.6%) |
Disability Class: Cognitive Difficulty
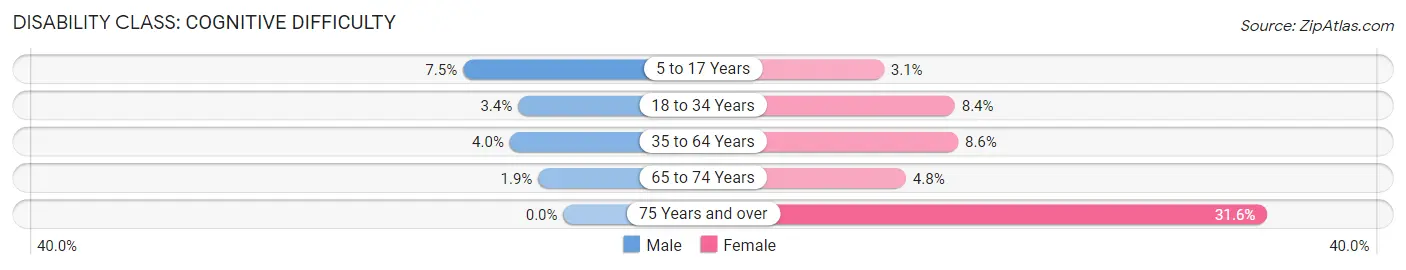
| Age Bracket | Male | Female |
| 5 to 17 Years | 7 (7.4%) | 3 (3.1%) |
| 18 to 34 Years | 5 (3.4%) | 13 (8.4%) |
| 35 to 64 Years | 8 (4.0%) | 22 (8.6%) |
| 65 to 74 Years | 2 (1.9%) | 7 (4.8%) |
| 75 Years and over | 0 (0.0%) | 24 (31.6%) |
Disability Class: Ambulatory Difficulty
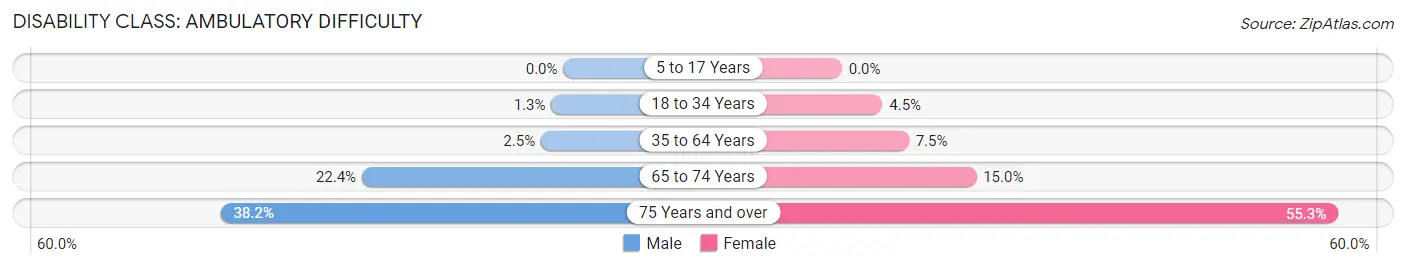
| Age Bracket | Male | Female |
| 5 to 17 Years | 0 (0.0%) | 0 (0.0%) |
| 18 to 34 Years | 2 (1.3%) | 7 (4.5%) |
| 35 to 64 Years | 5 (2.5%) | 19 (7.4%) |
| 65 to 74 Years | 24 (22.4%) | 22 (15.0%) |
| 75 Years and over | 21 (38.2%) | 42 (55.3%) |
Disability Class: Self-Care Difficulty
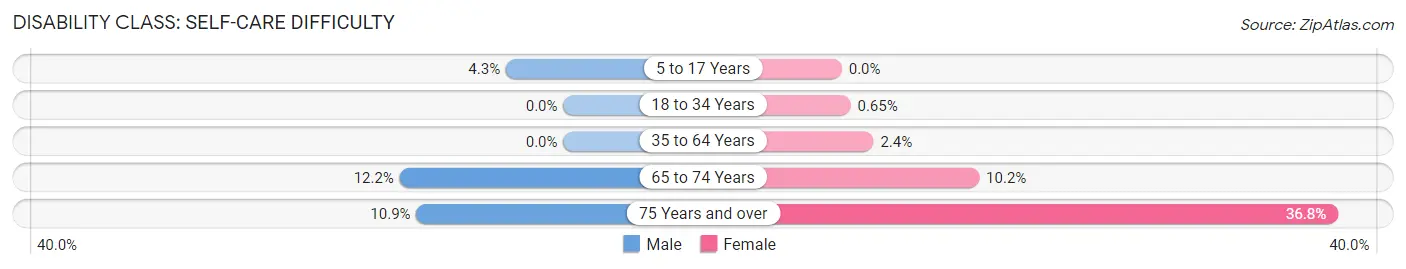
| Age Bracket | Male | Female |
| 5 to 17 Years | 4 (4.3%) | 0 (0.0%) |
| 18 to 34 Years | 0 (0.0%) | 1 (0.6%) |
| 35 to 64 Years | 0 (0.0%) | 6 (2.4%) |
| 65 to 74 Years | 13 (12.1%) | 15 (10.2%) |
| 75 Years and over | 6 (10.9%) | 28 (36.8%) |
Technology Access in Catawissa borough
Computing Device Access in Catawissa borough
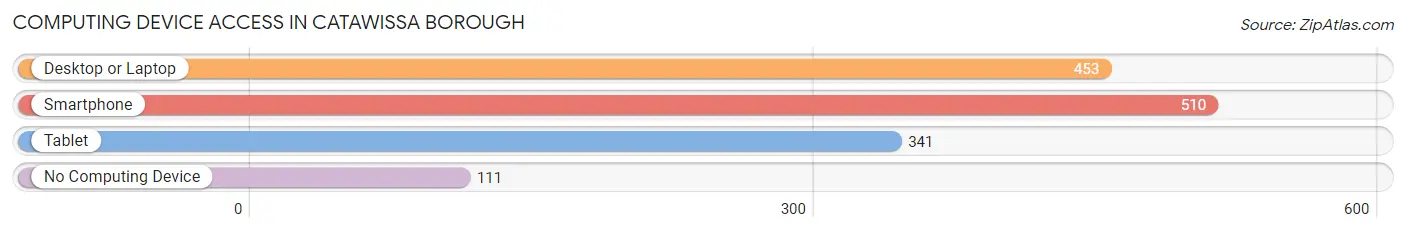
| Device Type | # Households | % Households |
| Desktop or Laptop | 453 | 67.9% |
| Smartphone | 510 | 76.5% |
| Tablet | 341 | 51.1% |
| No Computing Device | 111 | 16.6% |
| Total | 667 | 100.0% |
Internet Access in Catawissa borough
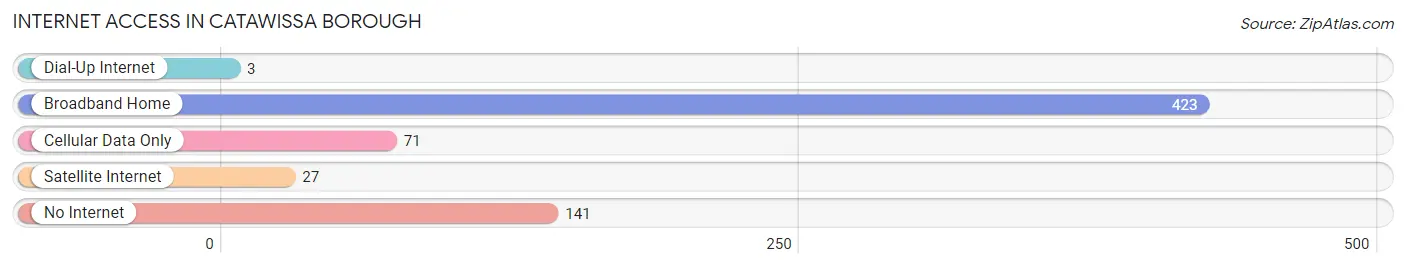
| Internet Type | # Households | % Households |
| Dial-Up Internet | 3 | 0.4% |
| Broadband Home | 423 | 63.4% |
| Cellular Data Only | 71 | 10.6% |
| Satellite Internet | 27 | 4.1% |
| No Internet | 141 | 21.1% |
| Total | 667 | 100.0% |
Catawissa borough Summary
Catawissa Borough is a small borough located in Columbia County, Pennsylvania. It is situated in the southeastern corner of the county, along the Susquehanna River. The population of Catawissa Borough was 1,717 at the 2010 census.
History
Catawissa Borough was founded in 1832 by a group of settlers from Catawissa, Pennsylvania. The settlers were led by John Catawissa, who was a member of the Catawissa Indian tribe. The town was named after the tribe, and the name is derived from the Native American word “Kittawissa”, which means “place of many springs”.
The town was originally a farming community, but it soon developed into a manufacturing center. The first industry in the area was a sawmill, which was built in 1835. This was followed by a gristmill, a tannery, and a woolen mill. The town also had a number of stores and shops.
In 1845, the Catawissa Railroad was built, connecting the town to the rest of the state. This allowed for the transportation of goods and people, and it helped to spur the growth of the town.
In the late 19th century, Catawissa was a thriving industrial center. It had a number of factories, including a paper mill, a brickyard, a furniture factory, and a foundry. The town also had a number of stores and shops.
In the early 20th century, the town began to decline. The factories closed, and the population began to decline. The town was hit hard by the Great Depression, and many of the businesses closed.
Geography
Catawissa Borough is located in the southeastern corner of Columbia County, Pennsylvania. It is situated along the Susquehanna River, and it is bordered by Catawissa Township to the north, Roaring Creek Township to the east, and Montour County to the south.
The borough has a total area of 0.8 square miles, all of which is land. The terrain is mostly flat, with some rolling hills. The climate is humid continental, with hot summers and cold winters.
Economy
The economy of Catawissa Borough is largely based on manufacturing and services. The largest employers in the area are the Catawissa Manufacturing Company, which produces paper products, and the Catawissa Foundry, which produces metal products.
Other major employers in the area include the Catawissa Hospital, the Catawissa School District, and the Catawissa Post Office. There are also a number of small businesses in the area, including restaurants, retail stores, and professional services.
Demographics
As of the 2010 census, the population of Catawissa Borough was 1,717. The racial makeup of the borough was 97.2% White, 0.9% African American, 0.2% Native American, 0.3% Asian, 0.1% Pacific Islander, 0.3% from other races, and 0.9% from two or more races. Hispanic or Latino of any race were 1.2% of the population.
The median household income in Catawissa Borough was $37,917, and the median family income was $45,625. The per capita income was $19,945. About 11.2% of families and 13.3% of the population were below the poverty line, including 17.2% of those under age 18 and 8.2% of those age 65 or over.
Common Questions
What is Per Capita Income in Catawissa borough?
Per Capita income in Catawissa borough is $30,481.
What is the Median Family Income in Catawissa borough?
Median Family Income in Catawissa borough is $71,500.
What is the Median Household income in Catawissa borough?
Median Household Income in Catawissa borough is $48,950.
What is Income or Wage Gap in Catawissa borough?
Income or Wage Gap in Catawissa borough is 51.7%.
Women in Catawissa borough earn 48.3 cents for every dollar earned by a man.
What is Inequality or Gini Index in Catawissa borough?
Inequality or Gini Index in Catawissa borough is 0.41.
What is the Total Population of Catawissa borough?
Total Population of Catawissa borough is 1,387.
What is the Total Male Population of Catawissa borough?
Total Male Population of Catawissa borough is 640.
What is the Total Female Population of Catawissa borough?
Total Female Population of Catawissa borough is 747.
What is the Ratio of Males per 100 Females in Catawissa borough?
There are 85.68 Males per 100 Females in Catawissa borough.
What is the Ratio of Females per 100 Males in Catawissa borough?
There are 116.72 Females per 100 Males in Catawissa borough.
What is the Median Population Age in Catawissa borough?
Median Population Age in Catawissa borough is 43.9 Years.
What is the Average Family Size in Catawissa borough
Average Family Size in Catawissa borough is 2.7 People.
What is the Average Household Size in Catawissa borough
Average Household Size in Catawissa borough is 2.1 People.
How Large is the Labor Force in Catawissa borough?
There are 826 People in the Labor Forcein in Catawissa borough.
What is the Percentage of People in the Labor Force in Catawissa borough?
70.6% of People are in the Labor Force in Catawissa borough.
What is the Unemployment Rate in Catawissa borough?
Unemployment Rate in Catawissa borough is 5.4%.