Girard borough, PA Map & Demographics
Girard borough Overview
$39,521
PER CAPITA INCOME
$92,813
AVG FAMILY INCOME
$66,432
AVG HOUSEHOLD INCOME
0.38
INEQUALITY / GINI INDEX
2,991
TOTAL POPULATION
1,552
MALE POPULATION
1,439
FEMALE POPULATION
107.85
MALES / 100 FEMALES
92.72
FEMALES / 100 MALES
46.2
MEDIAN AGE
2.6
AVG FAMILY SIZE
2.1
AVG HOUSEHOLD SIZE
1,887
LABOR FORCE [ PEOPLE ]
69.5%
PERCENT IN LABOR FORCE
5.8%
UNEMPLOYMENT RATE
Income in Girard borough
Income Overview in Girard borough
Per Capita Income in Girard borough is $39,521, while median incomes of families and households are $92,813 and $66,432 respectively.
| Characteristic | Number | Measure |
| Per Capita Income | 2,991 | $39,521 |
| Median Family Income | 872 | $92,813 |
| Mean Family Income | 872 | $107,837 |
| Median Household Income | 1,421 | $66,432 |
| Mean Household Income | 1,421 | $81,616 |
| Income Deficit | 872 | $0 |
| Wage / Income Gap (%) | 2,991 | 0.00% |
| Wage / Income Gap ($) | 2,991 | 100.00¢ per $1 |
| Gini / Inequality Index | 2,991 | 0.38 |
Earnings by Sex in Girard borough
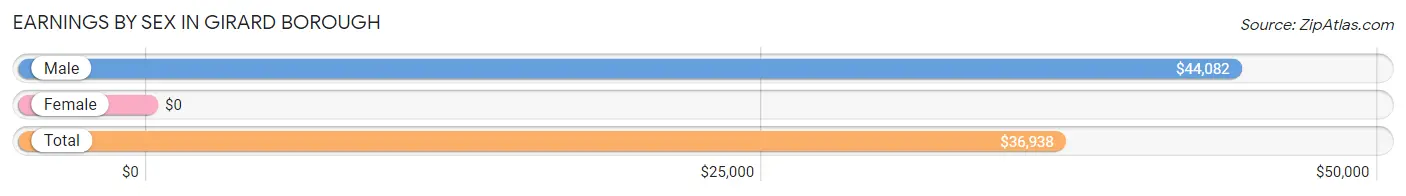
| Sex | Number | Average Earnings |
| Male | 1,028 (53.1%) | $44,082 |
| Female | 909 (46.9%) | $0 |
| Total | 1,937 (100.0%) | $36,938 |
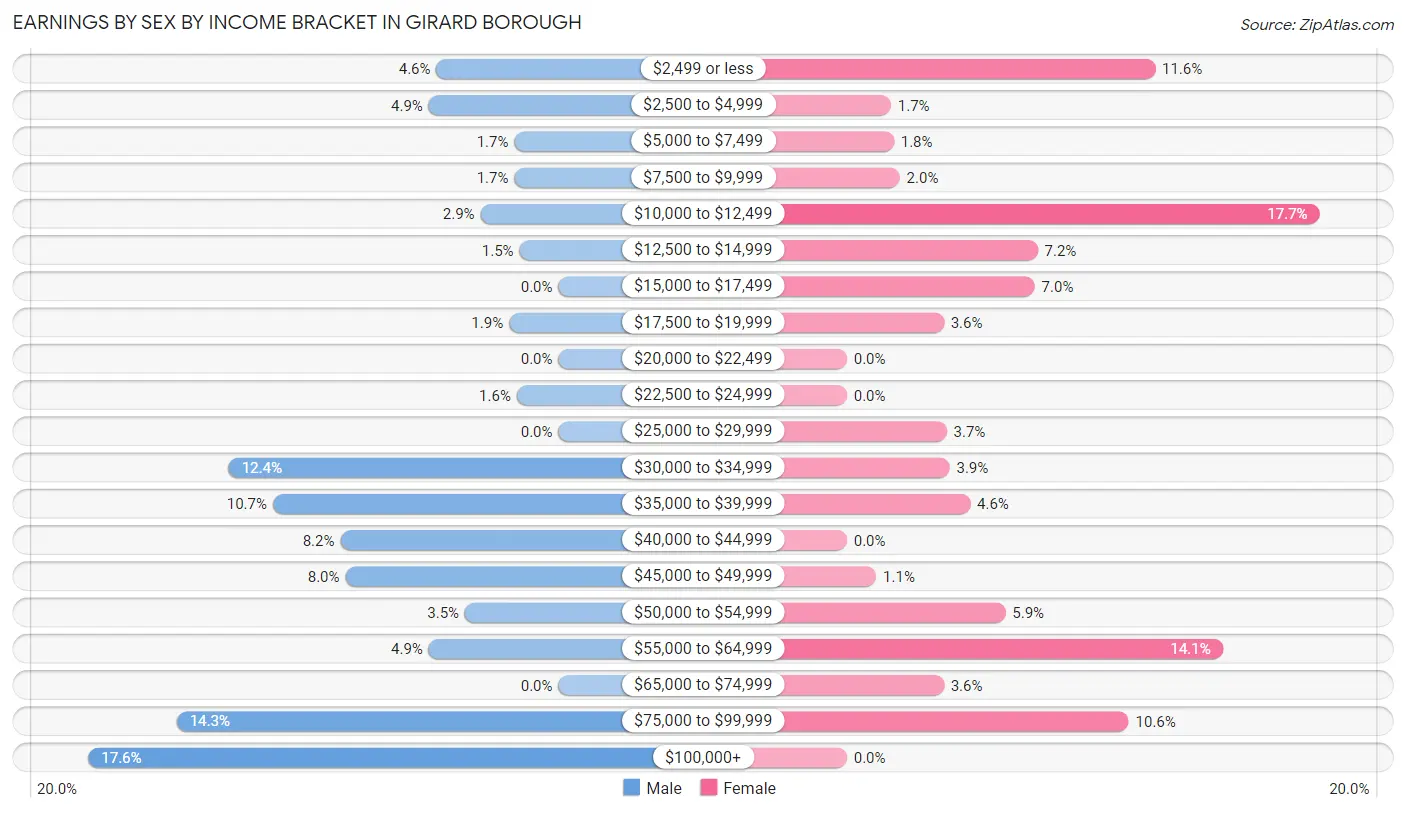
Earnings by Sex by Income Bracket in Girard borough
The most common earnings brackets in Girard borough are $100,000+ for men (181 | 17.6%) and $10,000 to $12,499 for women (161 | 17.7%).
| Income | Male | Female |
| $2,499 or less | 47 (4.6%) | 105 (11.6%) |
| $2,500 to $4,999 | 50 (4.9%) | 15 (1.7%) |
| $5,000 to $7,499 | 17 (1.7%) | 16 (1.8%) |
| $7,500 to $9,999 | 17 (1.7%) | 18 (2.0%) |
| $10,000 to $12,499 | 30 (2.9%) | 161 (17.7%) |
| $12,500 to $14,999 | 15 (1.5%) | 65 (7.1%) |
| $15,000 to $17,499 | 0 (0.0%) | 64 (7.0%) |
| $17,500 to $19,999 | 19 (1.8%) | 33 (3.6%) |
| $20,000 to $22,499 | 0 (0.0%) | 0 (0.0%) |
| $22,500 to $24,999 | 16 (1.6%) | 0 (0.0%) |
| $25,000 to $29,999 | 0 (0.0%) | 34 (3.7%) |
| $30,000 to $34,999 | 127 (12.3%) | 35 (3.8%) |
| $35,000 to $39,999 | 110 (10.7%) | 42 (4.6%) |
| $40,000 to $44,999 | 84 (8.2%) | 0 (0.0%) |
| $45,000 to $49,999 | 82 (8.0%) | 10 (1.1%) |
| $50,000 to $54,999 | 36 (3.5%) | 54 (5.9%) |
| $55,000 to $64,999 | 50 (4.9%) | 128 (14.1%) |
| $65,000 to $74,999 | 0 (0.0%) | 33 (3.6%) |
| $75,000 to $99,999 | 147 (14.3%) | 96 (10.6%) |
| $100,000+ | 181 (17.6%) | 0 (0.0%) |
| Total | 1,028 (100.0%) | 909 (100.0%) |
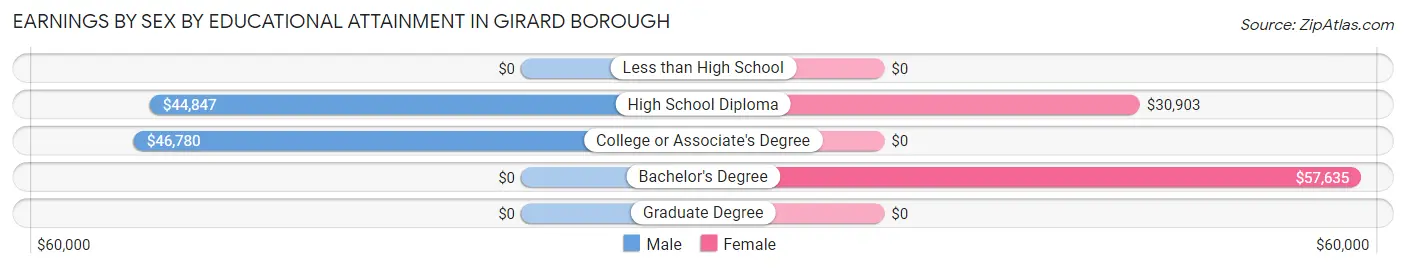
Earnings by Sex by Educational Attainment in Girard borough
Average earnings in Girard borough are $49,413 for men and $37,500 for women, a difference of 24.1%. Men with an educational attainment of college or associate's degree enjoy the highest average annual earnings of $46,780, while those with high school diploma education earn the least with $44,847. Women with an educational attainment of bachelor's degree earn the most with the average annual earnings of $57,635, while those with high school diploma education have the smallest earnings of $30,903.
| Educational Attainment | Male Income | Female Income |
| Less than High School | - | - |
| High School Diploma | $44,847 | $30,903 |
| College or Associate's Degree | $46,780 | $0 |
| Bachelor's Degree | - | - |
| Graduate Degree | - | - |
| Total | $49,413 | $37,500 |
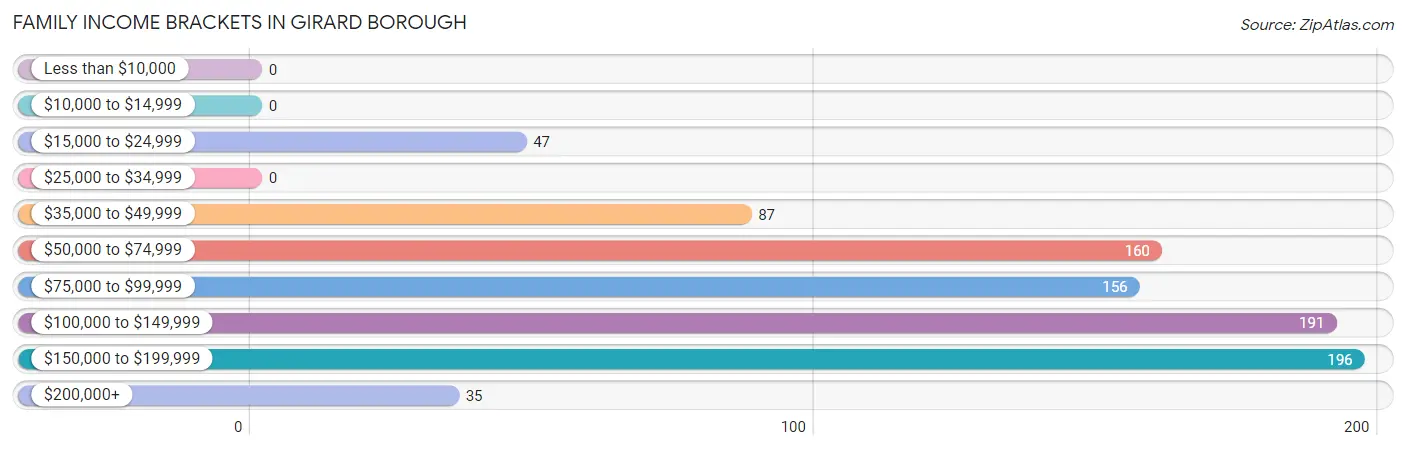
Family Income in Girard borough
Family Income Brackets in Girard borough
According to the Girard borough family income data, there are 196 families falling into the $150,000 to $199,999 income range, which is the most common income bracket and makes up 22.5% of all families.
| Income Bracket | # Families | % Families |
| Less than $10,000 | 0 | 0.0% |
| $10,000 to $14,999 | 0 | 0.0% |
| $15,000 to $24,999 | 47 | 5.4% |
| $25,000 to $34,999 | 0 | 0.0% |
| $35,000 to $49,999 | 87 | 10.0% |
| $50,000 to $74,999 | 160 | 18.3% |
| $75,000 to $99,999 | 156 | 17.9% |
| $100,000 to $149,999 | 191 | 21.9% |
| $150,000 to $199,999 | 196 | 22.5% |
| $200,000+ | 35 | 4.0% |
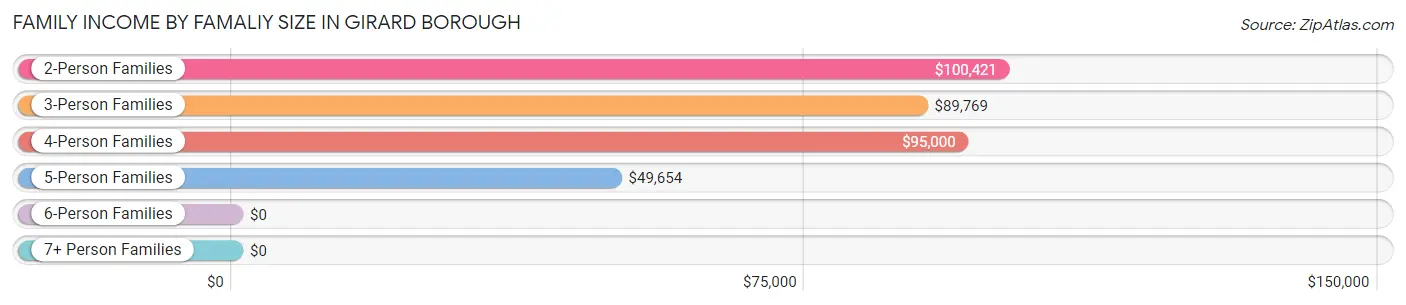
Family Income by Famaliy Size in Girard borough
2-person families (535 | 61.4%) account for the highest median family income in Girard borough with $100,421 per family, while 2-person families (535 | 61.4%) have the highest median income of $50,210 per family member.
| Income Bracket | # Families | Median Income |
| 2-Person Families | 535 (61.4%) | $100,421 |
| 3-Person Families | 186 (21.3%) | $89,769 |
| 4-Person Families | 70 (8.0%) | $95,000 |
| 5-Person Families | 81 (9.3%) | $49,654 |
| 6-Person Families | 0 (0.0%) | $0 |
| 7+ Person Families | 0 (0.0%) | $0 |
| Total | 872 (100.0%) | $92,813 |
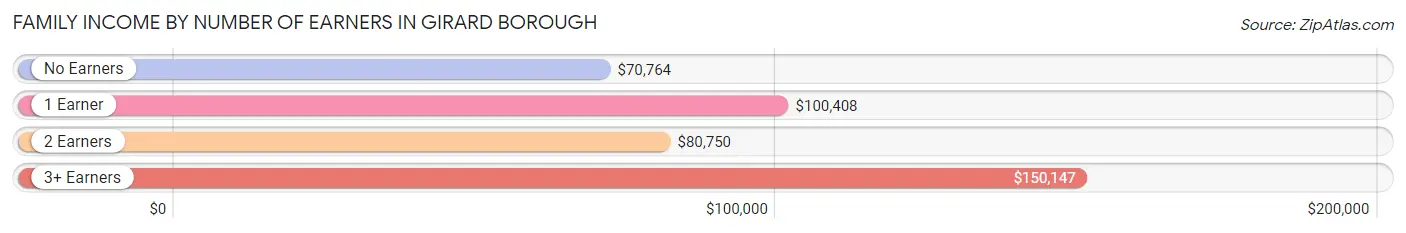
Family Income by Number of Earners in Girard borough
The median family income in Girard borough is $92,813, with families comprising 3+ earners (138) having the highest median family income of $150,147, while families with no earners (55) have the lowest median family income of $70,764, accounting for 15.8% and 6.3% of families, respectively.
| Number of Earners | # Families | Median Income |
| No Earners | 55 (6.3%) | $70,764 |
| 1 Earner | 412 (47.2%) | $100,408 |
| 2 Earners | 267 (30.6%) | $80,750 |
| 3+ Earners | 138 (15.8%) | $150,147 |
| Total | 872 (100.0%) | $92,813 |
Household Income in Girard borough
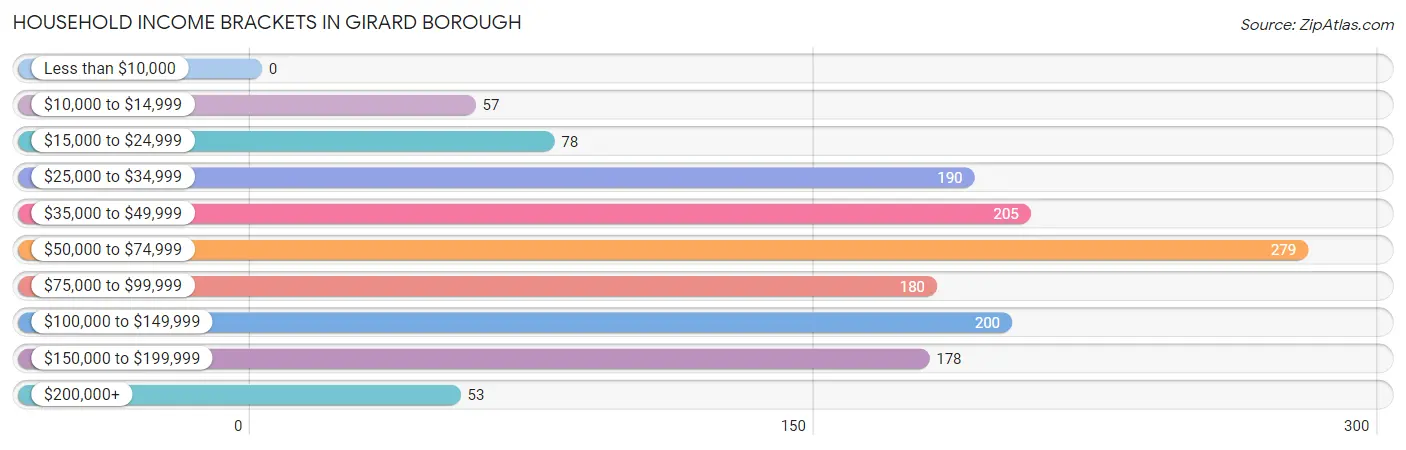
Household Income Brackets in Girard borough
With 279 households falling in the category, the $50,000 to $74,999 income range is the most frequent in Girard borough, accounting for 19.6% of all households.
| Income Bracket | # Households | % Households |
| Less than $10,000 | 0 | 0.0% |
| $10,000 to $14,999 | 57 | 4.0% |
| $15,000 to $24,999 | 78 | 5.5% |
| $25,000 to $34,999 | 190 | 13.4% |
| $35,000 to $49,999 | 205 | 14.4% |
| $50,000 to $74,999 | 279 | 19.6% |
| $75,000 to $99,999 | 180 | 12.7% |
| $100,000 to $149,999 | 200 | 14.1% |
| $150,000 to $199,999 | 178 | 12.5% |
| $200,000+ | 53 | 3.7% |
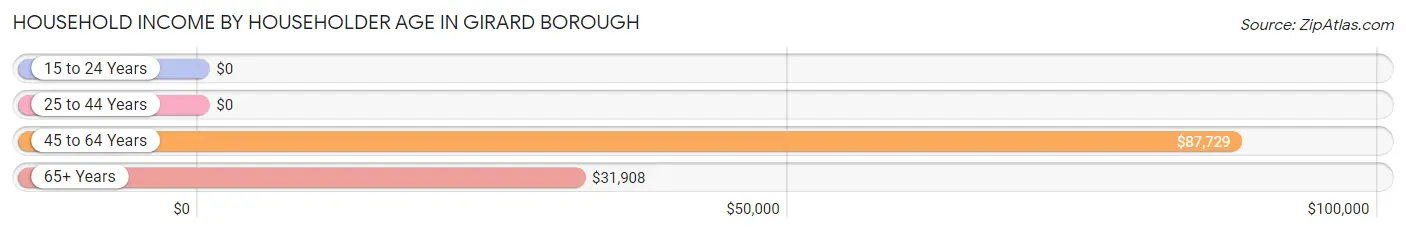
Household Income by Householder Age in Girard borough
The median household income in Girard borough is $66,432, with the highest median household income of $87,729 found in the 45 to 64 years age bracket for the primary householder. A total of 719 households (50.6%) fall into this category. Meanwhile, the 15 to 24 years age bracket for the primary householder has the lowest median household income of $0, with 102 households (7.2%) in this group.
| Income Bracket | # Households | Median Income |
| 15 to 24 Years | 102 (7.2%) | $0 |
| 25 to 44 Years | 315 (22.2%) | $0 |
| 45 to 64 Years | 719 (50.6%) | $87,729 |
| 65+ Years | 285 (20.1%) | $31,908 |
| Total | 1,421 (100.0%) | $66,432 |
Poverty in Girard borough
Income Below Poverty by Sex and Age in Girard borough
With 5.2% poverty level for males and 4.0% for females among the residents of Girard borough, 25 to 34 year old males and 75 year old and over females are the most vulnerable to poverty, with 18 males (16.7%) and 44 females (41.9%) in their respective age groups living below the poverty level.
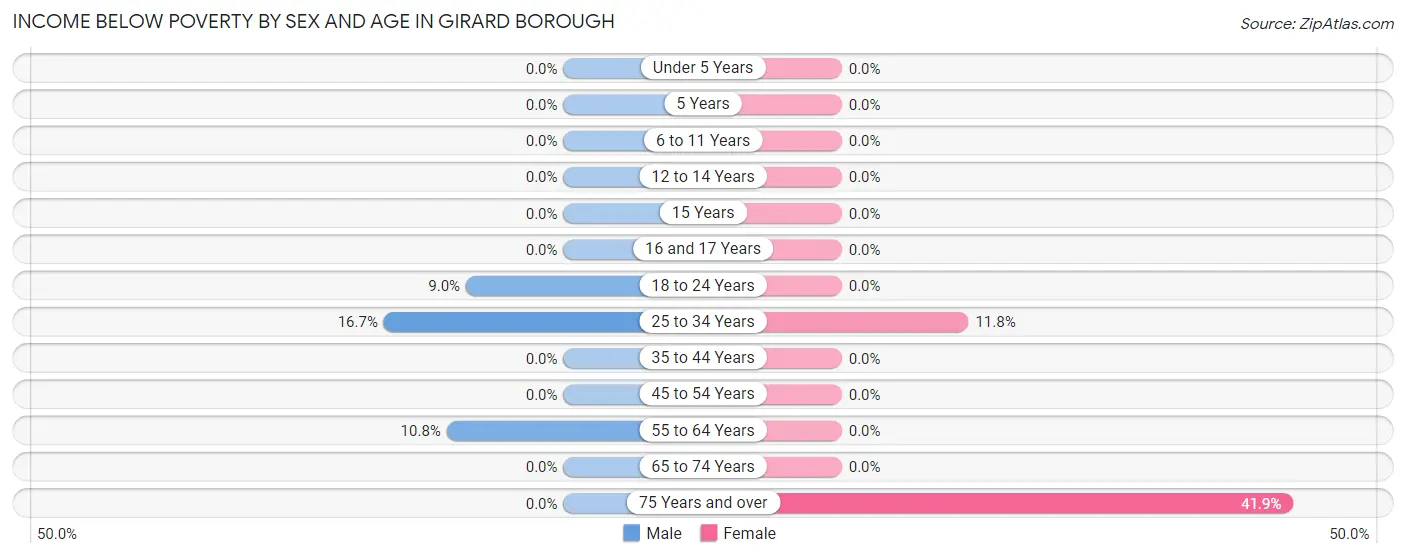
| Age Bracket | Male | Female |
| Under 5 Years | 0 (0.0%) | 0 (0.0%) |
| 5 Years | 0 (0.0%) | 0 (0.0%) |
| 6 to 11 Years | 0 (0.0%) | 0 (0.0%) |
| 12 to 14 Years | 0 (0.0%) | 0 (0.0%) |
| 15 Years | 0 (0.0%) | 0 (0.0%) |
| 16 and 17 Years | 0 (0.0%) | 0 (0.0%) |
| 18 to 24 Years | 16 (9.0%) | 0 (0.0%) |
| 25 to 34 Years | 18 (16.7%) | 14 (11.8%) |
| 35 to 44 Years | 0 (0.0%) | 0 (0.0%) |
| 45 to 54 Years | 0 (0.0%) | 0 (0.0%) |
| 55 to 64 Years | 47 (10.8%) | 0 (0.0%) |
| 65 to 74 Years | 0 (0.0%) | 0 (0.0%) |
| 75 Years and over | 0 (0.0%) | 44 (41.9%) |
| Total | 81 (5.2%) | 58 (4.0%) |
Income Above Poverty by Sex and Age in Girard borough
According to the poverty statistics in Girard borough, males aged 6 to 11 years and females aged under 5 years are the age groups that are most secure financially, with 100.0% of males and 100.0% of females in these age groups living above the poverty line.
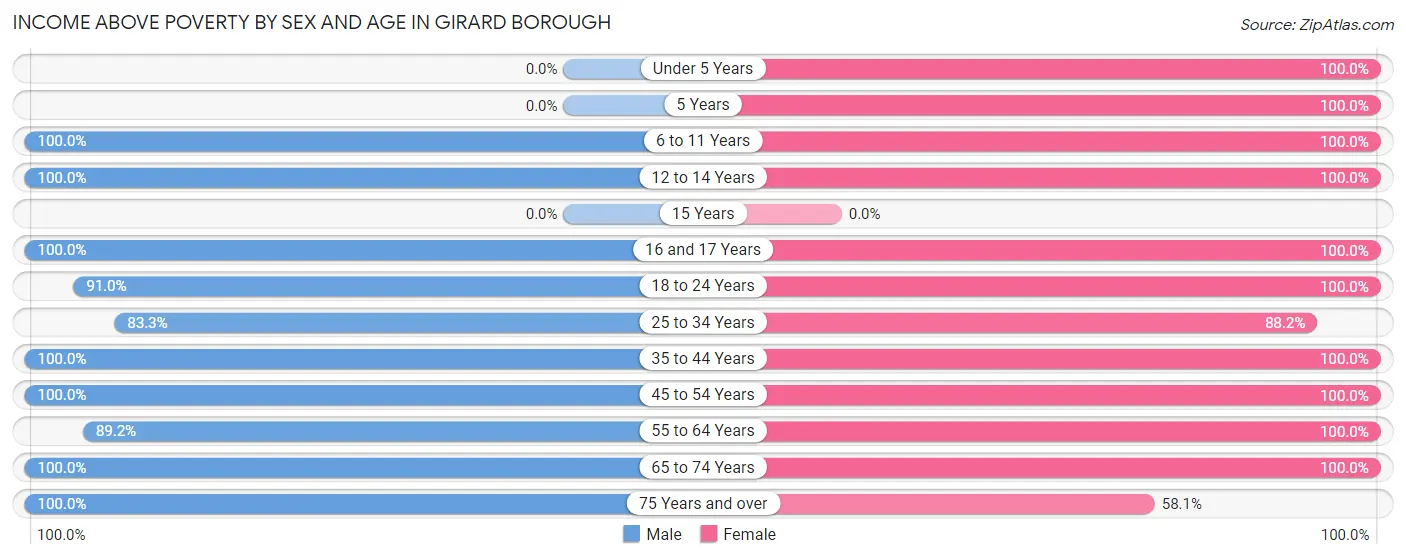
| Age Bracket | Male | Female |
| Under 5 Years | 0 (0.0%) | 34 (100.0%) |
| 5 Years | 0 (0.0%) | 16 (100.0%) |
| 6 to 11 Years | 117 (100.0%) | 35 (100.0%) |
| 12 to 14 Years | 32 (100.0%) | 42 (100.0%) |
| 15 Years | 0 (0.0%) | 0 (0.0%) |
| 16 and 17 Years | 109 (100.0%) | 131 (100.0%) |
| 18 to 24 Years | 161 (91.0%) | 163 (100.0%) |
| 25 to 34 Years | 90 (83.3%) | 105 (88.2%) |
| 35 to 44 Years | 185 (100.0%) | 120 (100.0%) |
| 45 to 54 Years | 155 (100.0%) | 280 (100.0%) |
| 55 to 64 Years | 387 (89.2%) | 312 (100.0%) |
| 65 to 74 Years | 149 (100.0%) | 82 (100.0%) |
| 75 Years and over | 86 (100.0%) | 61 (58.1%) |
| Total | 1,471 (94.8%) | 1,381 (96.0%) |
Income Below Poverty Among Married-Couple Families in Girard borough
| Children | Above Poverty | Below Poverty |
| No Children | 354 (100.0%) | 0 (0.0%) |
| 1 or 2 Children | 122 (100.0%) | 0 (0.0%) |
| 3 or 4 Children | 0 (0.0%) | 0 (0.0%) |
| 5 or more Children | 0 (0.0%) | 0 (0.0%) |
| Total | 476 (100.0%) | 0 (0.0%) |
Income Below Poverty Among Single-Parent Households in Girard borough
| Children | Single Father | Single Mother |
| No Children | 0 (0.0%) | 0 (0.0%) |
| 1 or 2 Children | 0 (0.0%) | 0 (0.0%) |
| 3 or 4 Children | 0 (0.0%) | 0 (0.0%) |
| 5 or more Children | 0 (0.0%) | 0 (0.0%) |
| Total | 0 (0.0%) | 0 (0.0%) |
Income Below Poverty Among Married-Couple vs Single-Parent Households in Girard borough
| Children | Married-Couple Families | Single-Parent Households |
| No Children | 0 (0.0%) | 0 (0.0%) |
| 1 or 2 Children | 0 (0.0%) | 0 (0.0%) |
| 3 or 4 Children | 0 (0.0%) | 0 (0.0%) |
| 5 or more Children | 0 (0.0%) | 0 (0.0%) |
| Total | 0 (0.0%) | 0 (0.0%) |
Race in Girard borough
The most populous races in Girard borough are White / Caucasian (2,827 | 94.5%), Hispanic or Latino (362 | 12.1%), and Two or more Races (164 | 5.5%).
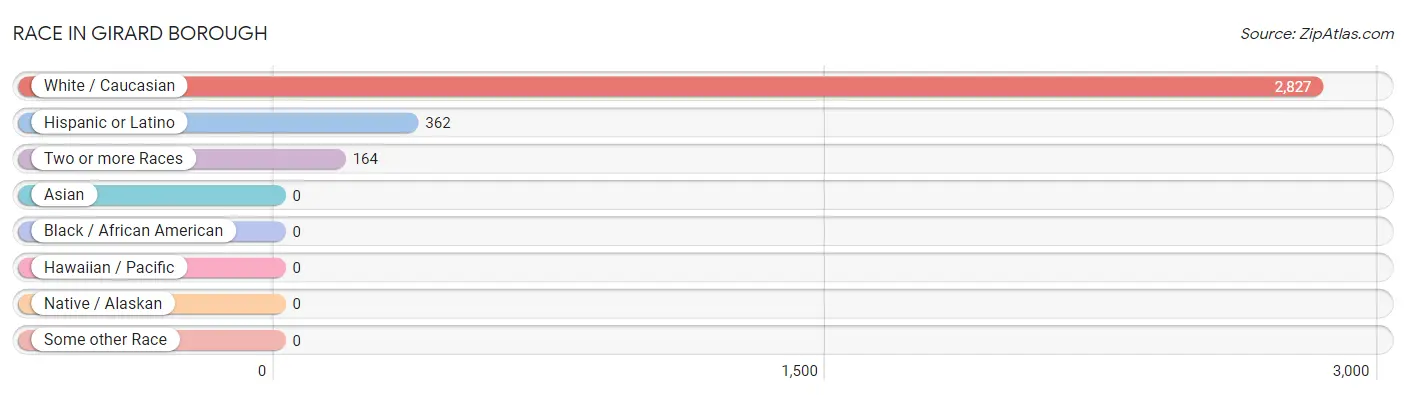
| Race | # Population | % Population |
| Asian | 0 | 0.0% |
| Black / African American | 0 | 0.0% |
| Hawaiian / Pacific | 0 | 0.0% |
| Hispanic or Latino | 362 | 12.1% |
| Native / Alaskan | 0 | 0.0% |
| White / Caucasian | 2,827 | 94.5% |
| Two or more Races | 164 | 5.5% |
| Some other Race | 0 | 0.0% |
| Total | 2,991 | 100.0% |
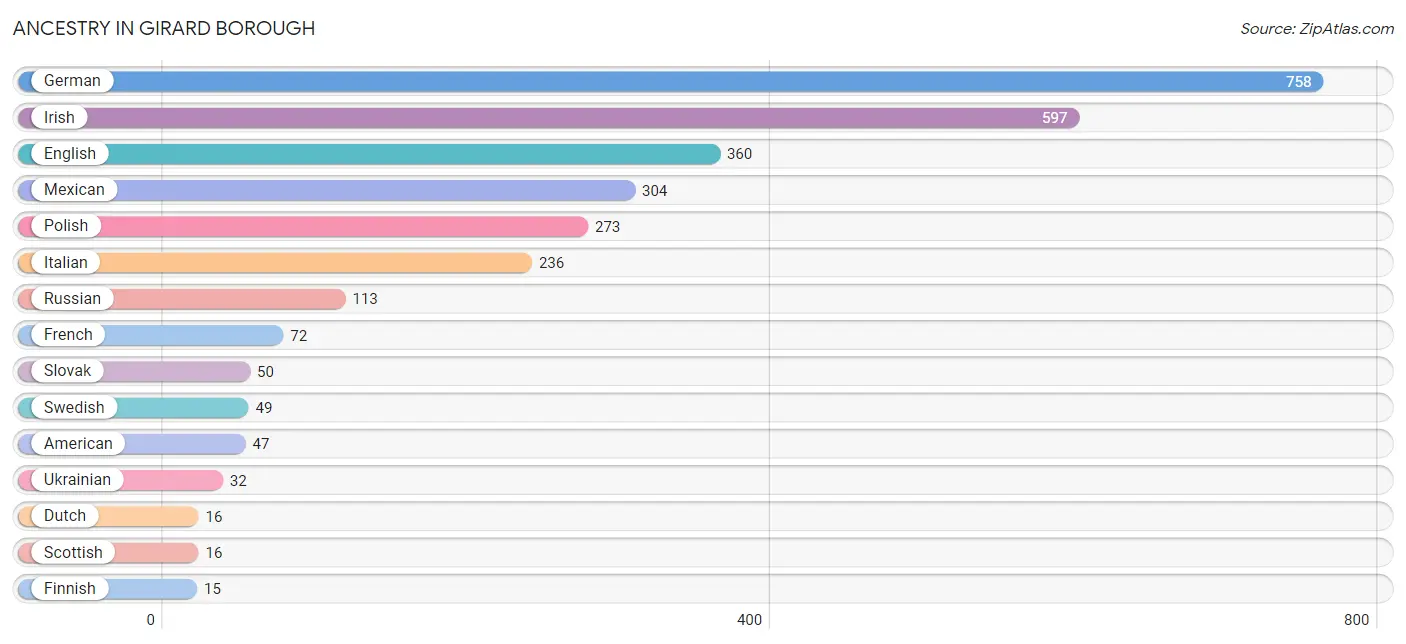
Ancestry in Girard borough
The most populous ancestries reported in Girard borough are German (758 | 25.3%), Irish (597 | 20.0%), English (360 | 12.0%), Mexican (304 | 10.2%), and Polish (273 | 9.1%), together accounting for 76.6% of all Girard borough residents.
| Ancestry | # Population | % Population |
| American | 47 | 1.6% |
| British | 12 | 0.4% |
| Dutch | 16 | 0.5% |
| Eastern European | 7 | 0.2% |
| English | 360 | 12.0% |
| Finnish | 15 | 0.5% |
| French | 72 | 2.4% |
| German | 758 | 25.3% |
| Greek | 15 | 0.5% |
| Irish | 597 | 20.0% |
| Italian | 236 | 7.9% |
| Mexican | 304 | 10.2% |
| Polish | 273 | 9.1% |
| Puerto Rican | 15 | 0.5% |
| Russian | 113 | 3.8% |
| Scottish | 16 | 0.5% |
| Slovak | 50 | 1.7% |
| Swedish | 49 | 1.6% |
| Ukrainian | 32 | 1.1% | View All 19 Rows |
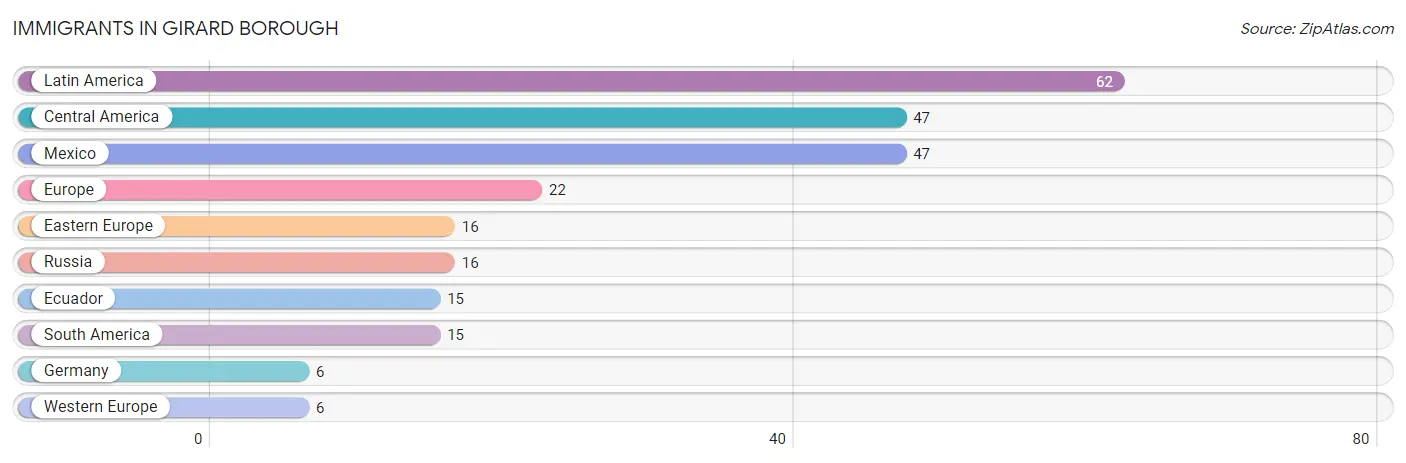
Immigrants in Girard borough
The most numerous immigrant groups reported in Girard borough came from Latin America (62 | 2.1%), Central America (47 | 1.6%), Mexico (47 | 1.6%), Europe (22 | 0.7%), and Eastern Europe (16 | 0.5%), together accounting for 6.5% of all Girard borough residents.
| Immigration Origin | # Population | % Population |
| Central America | 47 | 1.6% |
| Eastern Europe | 16 | 0.5% |
| Ecuador | 15 | 0.5% |
| Europe | 22 | 0.7% |
| Germany | 6 | 0.2% |
| Latin America | 62 | 2.1% |
| Mexico | 47 | 1.6% |
| Russia | 16 | 0.5% |
| South America | 15 | 0.5% |
| Western Europe | 6 | 0.2% | View All 10 Rows |
Sex and Age in Girard borough
Sex and Age in Girard borough
The most populous age groups in Girard borough are 55 to 59 Years (248 | 16.0%) for men and 55 to 59 Years (211 | 14.7%) for women.
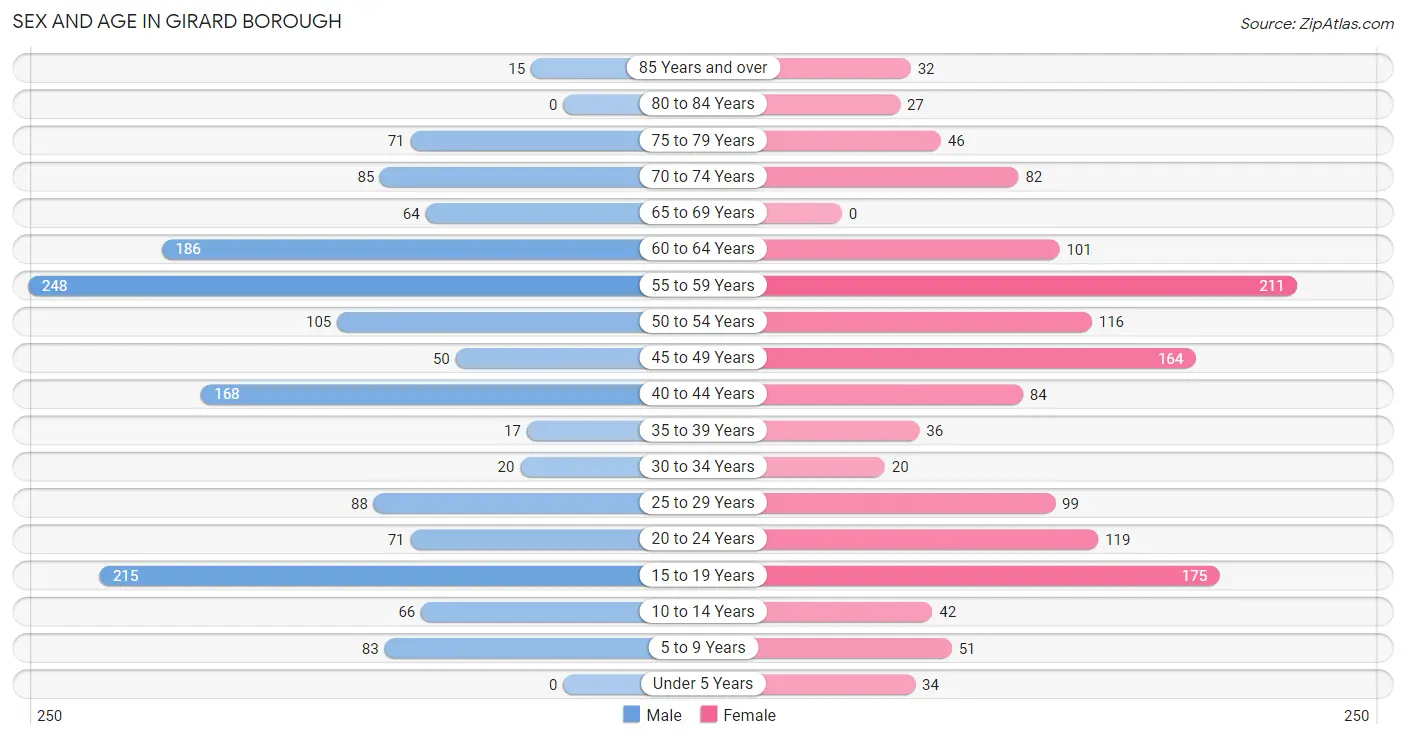
| Age Bracket | Male | Female |
| Under 5 Years | 0 (0.0%) | 34 (2.4%) |
| 5 to 9 Years | 83 (5.3%) | 51 (3.5%) |
| 10 to 14 Years | 66 (4.3%) | 42 (2.9%) |
| 15 to 19 Years | 215 (13.9%) | 175 (12.2%) |
| 20 to 24 Years | 71 (4.6%) | 119 (8.3%) |
| 25 to 29 Years | 88 (5.7%) | 99 (6.9%) |
| 30 to 34 Years | 20 (1.3%) | 20 (1.4%) |
| 35 to 39 Years | 17 (1.1%) | 36 (2.5%) |
| 40 to 44 Years | 168 (10.8%) | 84 (5.8%) |
| 45 to 49 Years | 50 (3.2%) | 164 (11.4%) |
| 50 to 54 Years | 105 (6.8%) | 116 (8.1%) |
| 55 to 59 Years | 248 (16.0%) | 211 (14.7%) |
| 60 to 64 Years | 186 (12.0%) | 101 (7.0%) |
| 65 to 69 Years | 64 (4.1%) | 0 (0.0%) |
| 70 to 74 Years | 85 (5.5%) | 82 (5.7%) |
| 75 to 79 Years | 71 (4.6%) | 46 (3.2%) |
| 80 to 84 Years | 0 (0.0%) | 27 (1.9%) |
| 85 Years and over | 15 (1.0%) | 32 (2.2%) |
| Total | 1,552 (100.0%) | 1,439 (100.0%) |
Families and Households in Girard borough
Median Family Size in Girard borough
The median family size in Girard borough is 2.60 persons per family, with single female/mother families (204 | 23.4%) accounting for the largest median family size of 3.12 persons per family. On the other hand, single male/father families (192 | 22.0%) represent the smallest median family size with 2.22 persons per family.
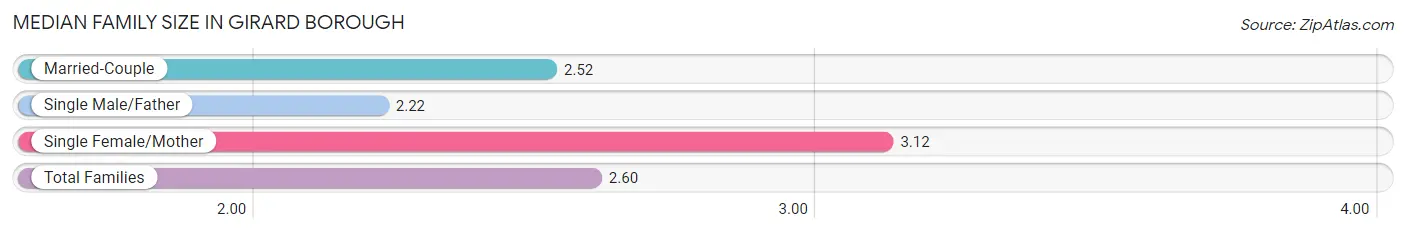
| Family Type | # Families | Family Size |
| Married-Couple | 476 (54.6%) | 2.52 |
| Single Male/Father | 192 (22.0%) | 2.22 |
| Single Female/Mother | 204 (23.4%) | 3.12 |
| Total Families | 872 (100.0%) | 2.60 |
Median Household Size in Girard borough
The median household size in Girard borough is 2.10 persons per household, with single female/mother households (204 | 14.4%) accounting for the largest median household size of 3.26 persons per household. non-family households (549 | 38.6%) represent the smallest median household size with 1.27 persons per household.
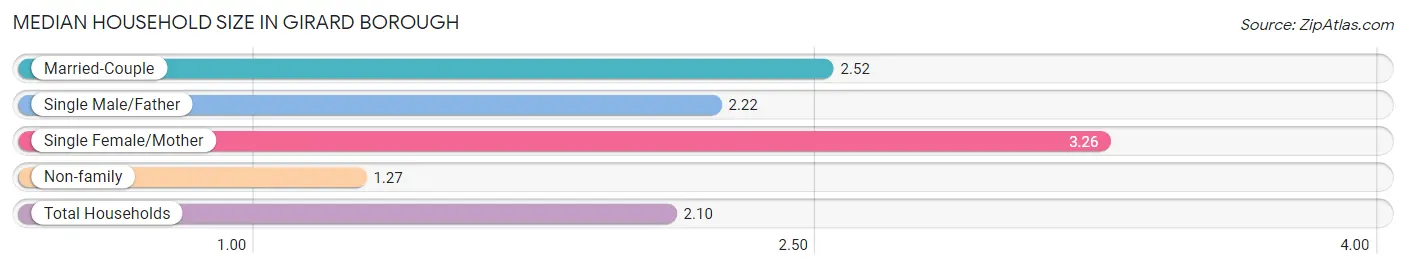
| Household Type | # Households | Household Size |
| Married-Couple | 476 (33.5%) | 2.52 |
| Single Male/Father | 192 (13.5%) | 2.22 |
| Single Female/Mother | 204 (14.4%) | 3.26 |
| Non-family | 549 (38.6%) | 1.27 |
| Total Households | 1,421 (100.0%) | 2.10 |
Household Size by Marriage Status in Girard borough
Out of a total of 1,421 households in Girard borough, 872 (61.4%) are family households, while 549 (38.6%) are nonfamily households. The most numerous type of family households are 2-person households, comprising 525, and the most common type of nonfamily households are 1-person households, comprising 322.
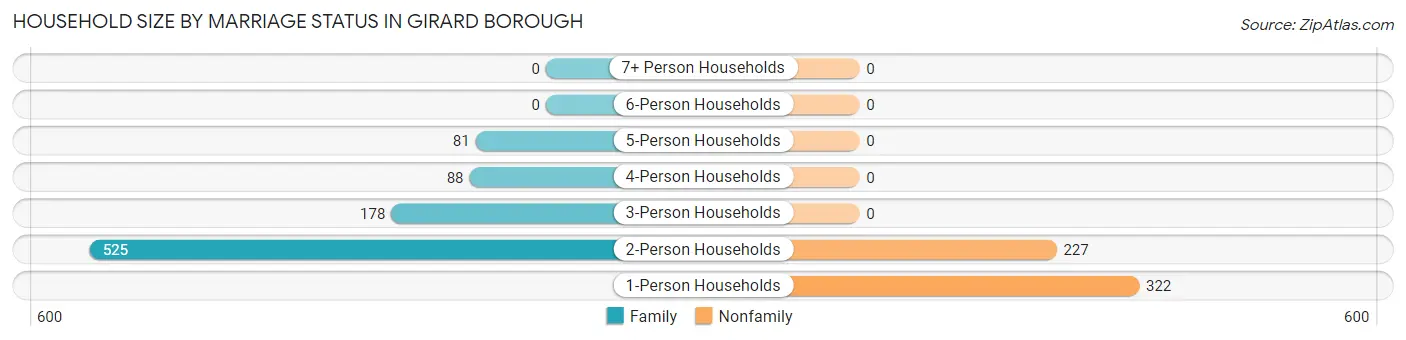
| Household Size | Family Households | Nonfamily Households |
| 1-Person Households | - | 322 (22.7%) |
| 2-Person Households | 525 (36.9%) | 227 (16.0%) |
| 3-Person Households | 178 (12.5%) | 0 (0.0%) |
| 4-Person Households | 88 (6.2%) | 0 (0.0%) |
| 5-Person Households | 81 (5.7%) | 0 (0.0%) |
| 6-Person Households | 0 (0.0%) | 0 (0.0%) |
| 7+ Person Households | 0 (0.0%) | 0 (0.0%) |
| Total | 872 (61.4%) | 549 (38.6%) |
Female Fertility in Girard borough
Fertility by Age in Girard borough
| Age Bracket | Women with Births | Births / 1,000 Women |
| 15 to 19 years | 0 (0.0%) | 0.0 |
| 20 to 34 years | 0 (0.0%) | 0.0 |
| 35 to 50 years | 0 (0.0%) | 0.0 |
| Total | 0 (0.0%) | 0.0 |
Fertility by Age by Marriage Status in Girard borough
| Age Bracket | Married | Unmarried |
| 15 to 19 years | 0 (0.0%) | 0 (0.0%) |
| 20 to 34 years | 0 (0.0%) | 0 (0.0%) |
| 35 to 50 years | 0 (0.0%) | 0 (0.0%) |
| Total | 0 (0.0%) | 0 (0.0%) |
Fertility by Education in Girard borough
| Educational Attainment | Women with Births | Births / 1,000 Women |
| Less than High School | 0 (0.0%) | 0.0 |
| High School Diploma | 0 (0.0%) | 0.0 |
| College or Associate's Degree | 0 (0.0%) | 0.0 |
| Bachelor's Degree | 0 (0.0%) | 0.0 |
| Graduate Degree | 0 (0.0%) | 0.0 |
| Total | 0 (0.0%) | 0.0 |
Fertility by Education by Marriage Status in Girard borough
| Educational Attainment | Married | Unmarried |
| Less than High School | 0 (0.0%) | 0 (0.0%) |
| High School Diploma | 0 (0.0%) | 0 (0.0%) |
| College or Associate's Degree | 0 (0.0%) | 0 (0.0%) |
| Bachelor's Degree | 0 (0.0%) | 0 (0.0%) |
| Graduate Degree | 0 (0.0%) | 0 (0.0%) |
| Total | 0 (0.0%) | 0 (0.0%) |
Employment Characteristics in Girard borough
Employment by Class of Employer in Girard borough
Among the 1,779 employed individuals in Girard borough, private company employees (1,266 | 71.2%), local government employees (279 | 15.7%), and not-for-profit organizations (165 | 9.3%) make up the most common classes of employment.
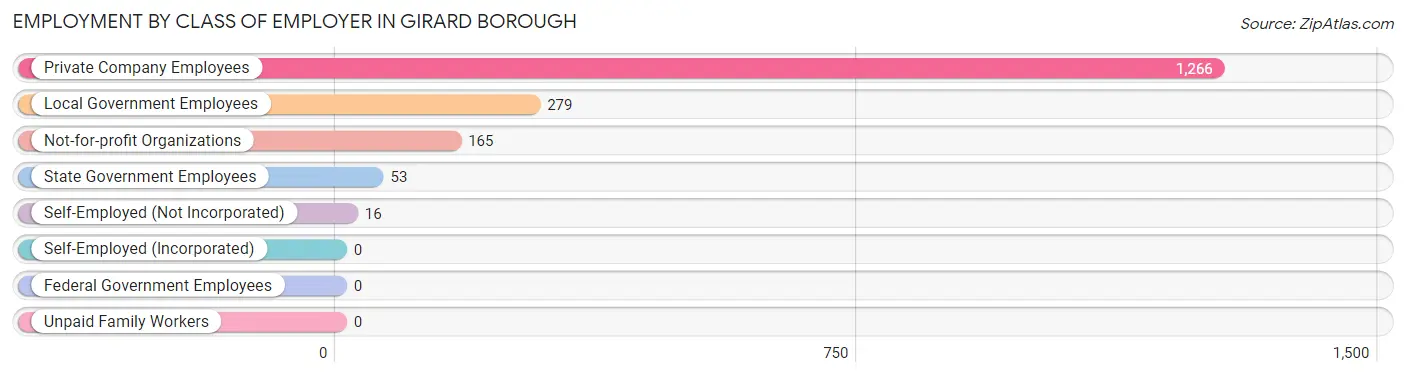
| Employer Class | # Employees | % Employees |
| Private Company Employees | 1,266 | 71.2% |
| Self-Employed (Incorporated) | 0 | 0.0% |
| Self-Employed (Not Incorporated) | 16 | 0.9% |
| Not-for-profit Organizations | 165 | 9.3% |
| Local Government Employees | 279 | 15.7% |
| State Government Employees | 53 | 3.0% |
| Federal Government Employees | 0 | 0.0% |
| Unpaid Family Workers | 0 | 0.0% |
| Total | 1,779 | 100.0% |
Employment Status by Age in Girard borough
According to the labor force statistics for Girard borough, out of the total population over 16 years of age (2,715), 69.5% or 1,887 individuals are in the labor force, with 5.8% or 109 of them unemployed. The age group with the highest labor force participation rate is 20 to 24 years, with 100.0% or 190 individuals in the labor force. Within the labor force, the 65 to 74 years age range has the highest percentage of unemployed individuals, with 46.9% or 15 of them being unemployed.
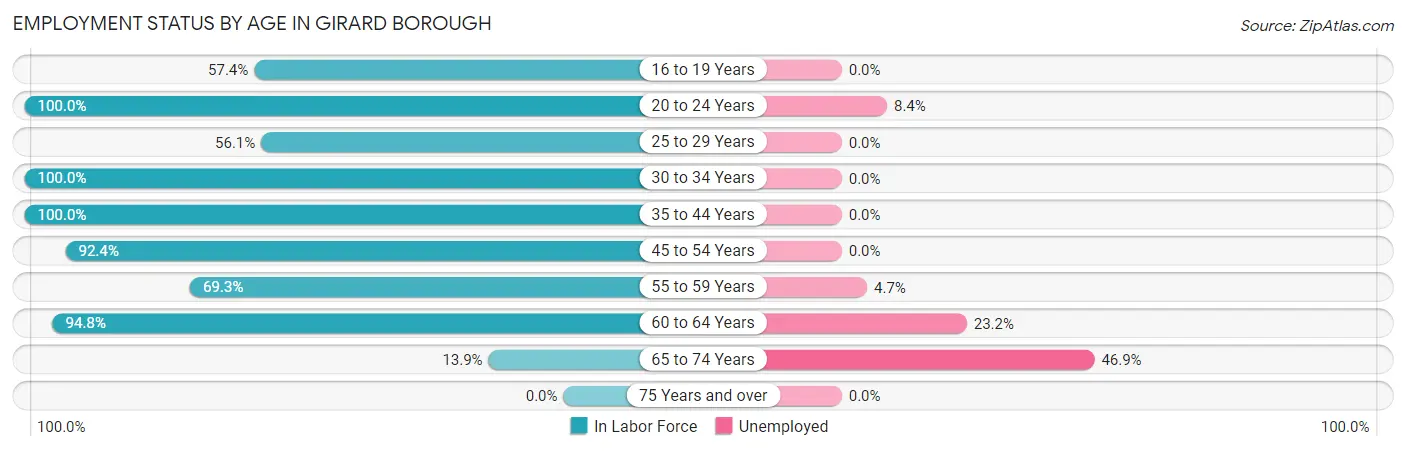
| Age Bracket | In Labor Force | Unemployed |
| 16 to 19 Years | 224 (57.4%) | 0 (0.0%) |
| 20 to 24 Years | 190 (100.0%) | 16 (8.4%) |
| 25 to 29 Years | 105 (56.1%) | 0 (0.0%) |
| 30 to 34 Years | 40 (100.0%) | 0 (0.0%) |
| 35 to 44 Years | 305 (100.0%) | 0 (0.0%) |
| 45 to 54 Years | 402 (92.4%) | 0 (0.0%) |
| 55 to 59 Years | 318 (69.3%) | 15 (4.7%) |
| 60 to 64 Years | 272 (94.8%) | 63 (23.2%) |
| 65 to 74 Years | 32 (13.9%) | 15 (46.9%) |
| 75 Years and over | 0 (0.0%) | 0 (0.0%) |
| Total | 1,887 (69.5%) | 109 (5.8%) |
Employment Status by Educational Attainment in Girard borough
According to labor force statistics for Girard borough, 84.2% of individuals (1,442) out of the total population between 25 and 64 years of age (1,713) are in the labor force, with 5.4% or 78 of them being unemployed. The group with the highest labor force participation rate are those with the educational attainment of bachelor's degree or higher, with 96.6% or 519 individuals in the labor force. Within the labor force, individuals with bachelor's degree or higher education have the highest percentage of unemployment, with 12.1% or 63 of them being unemployed.
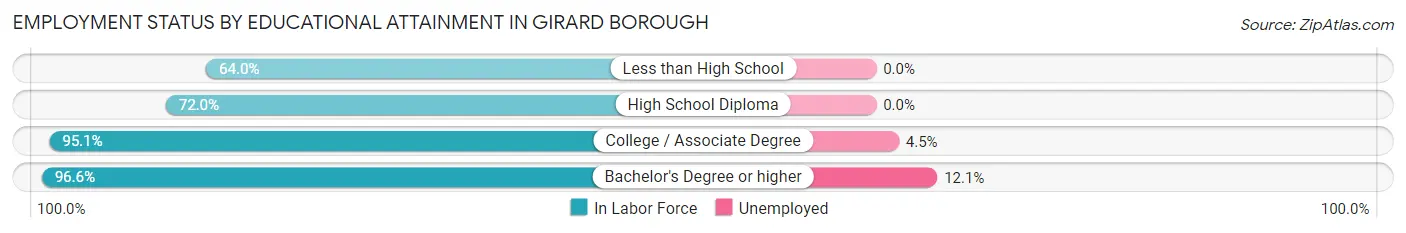
| Educational Attainment | In Labor Force | Unemployed |
| Less than High School | 32 (64.0%) | 0 (0.0%) |
| High School Diploma | 560 (72.0%) | 0 (0.0%) |
| College / Associate Degree | 331 (95.1%) | 16 (4.5%) |
| Bachelor's Degree or higher | 519 (96.6%) | 65 (12.1%) |
| Total | 1,442 (84.2%) | 93 (5.4%) |
Employment Occupations by Sex in Girard borough
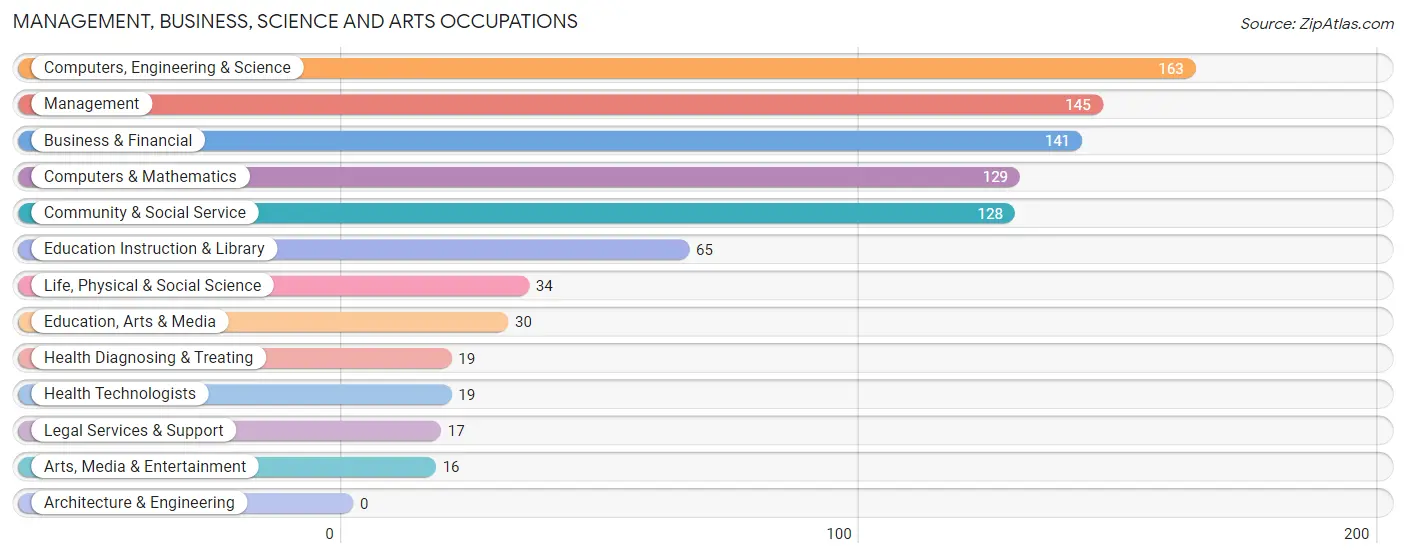
Management, Business, Science and Arts Occupations
The most common Management, Business, Science and Arts occupations in Girard borough are Computers, Engineering & Science (163 | 9.2%), Management (145 | 8.2%), Business & Financial (141 | 7.9%), Computers & Mathematics (129 | 7.2%), and Community & Social Service (128 | 7.2%).
Management, Business, Science and Arts Occupations by Sex
Within the Management, Business, Science and Arts occupations in Girard borough, the most male-oriented occupations are Computers & Mathematics (100.0%), Arts, Media & Entertainment (100.0%), and Computers, Engineering & Science (90.8%), while the most female-oriented occupations are Legal Services & Support (100.0%), Education Instruction & Library (100.0%), and Health Diagnosing & Treating (100.0%).
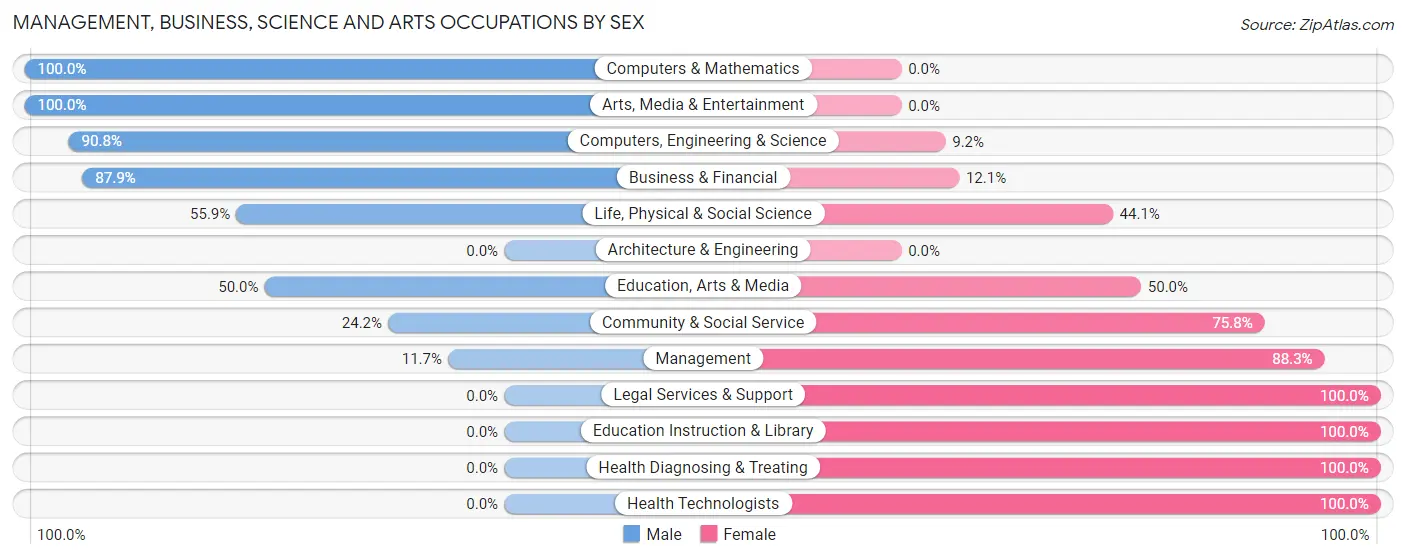
| Occupation | Male | Female |
| Management | 17 (11.7%) | 128 (88.3%) |
| Business & Financial | 124 (87.9%) | 17 (12.1%) |
| Computers, Engineering & Science | 148 (90.8%) | 15 (9.2%) |
| Computers & Mathematics | 129 (100.0%) | 0 (0.0%) |
| Architecture & Engineering | 0 (0.0%) | 0 (0.0%) |
| Life, Physical & Social Science | 19 (55.9%) | 15 (44.1%) |
| Community & Social Service | 31 (24.2%) | 97 (75.8%) |
| Education, Arts & Media | 15 (50.0%) | 15 (50.0%) |
| Legal Services & Support | 0 (0.0%) | 17 (100.0%) |
| Education Instruction & Library | 0 (0.0%) | 65 (100.0%) |
| Arts, Media & Entertainment | 16 (100.0%) | 0 (0.0%) |
| Health Diagnosing & Treating | 0 (0.0%) | 19 (100.0%) |
| Health Technologists | 0 (0.0%) | 19 (100.0%) |
| Total (Category) | 320 (53.7%) | 276 (46.3%) |
| Total (Overall) | 899 (50.5%) | 880 (49.5%) |
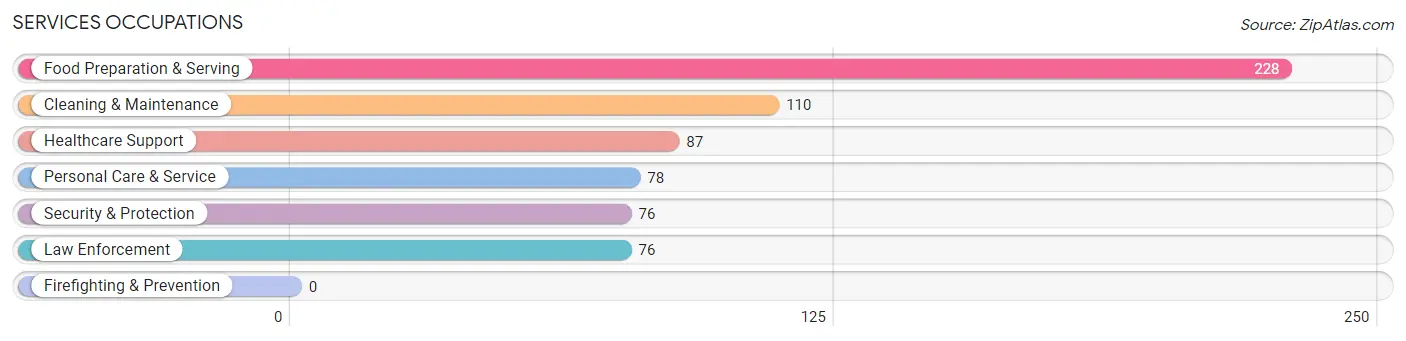
Services Occupations
The most common Services occupations in Girard borough are Food Preparation & Serving (228 | 12.8%), Cleaning & Maintenance (110 | 6.2%), Healthcare Support (87 | 4.9%), Personal Care & Service (78 | 4.4%), and Security & Protection (76 | 4.3%).
Services Occupations by Sex
Within the Services occupations in Girard borough, the most male-oriented occupations are Security & Protection (73.7%), Law Enforcement (73.7%), and Food Preparation & Serving (46.5%), while the most female-oriented occupations are Cleaning & Maintenance (100.0%), Personal Care & Service (100.0%), and Healthcare Support (78.2%).
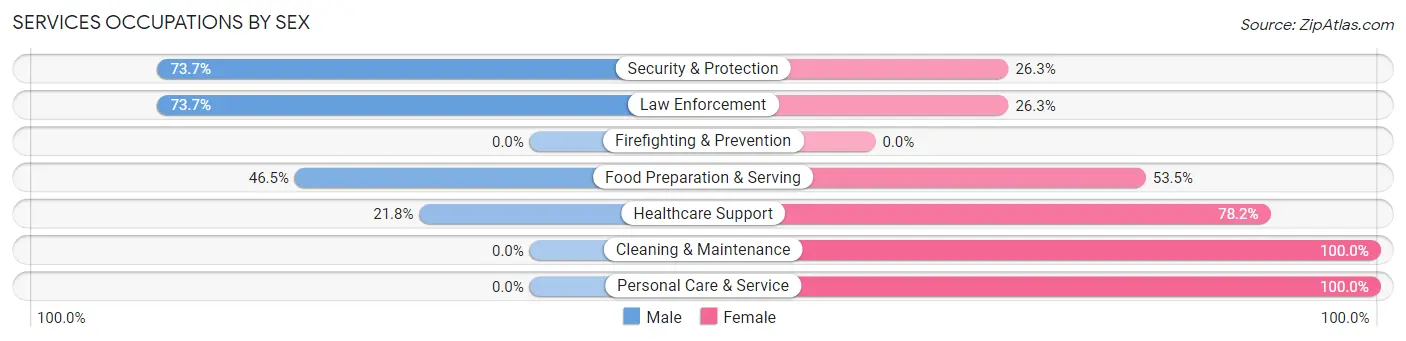
| Occupation | Male | Female |
| Healthcare Support | 19 (21.8%) | 68 (78.2%) |
| Security & Protection | 56 (73.7%) | 20 (26.3%) |
| Firefighting & Prevention | 0 (0.0%) | 0 (0.0%) |
| Law Enforcement | 56 (73.7%) | 20 (26.3%) |
| Food Preparation & Serving | 106 (46.5%) | 122 (53.5%) |
| Cleaning & Maintenance | 0 (0.0%) | 110 (100.0%) |
| Personal Care & Service | 0 (0.0%) | 78 (100.0%) |
| Total (Category) | 181 (31.3%) | 398 (68.7%) |
| Total (Overall) | 899 (50.5%) | 880 (49.5%) |
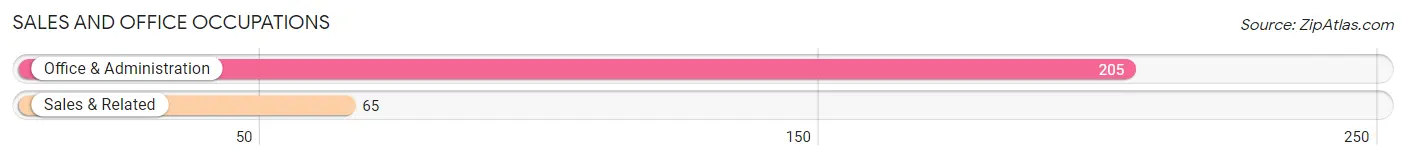
Sales and Office Occupations
The most common Sales and Office occupations in Girard borough are Office & Administration (205 | 11.5%), and Sales & Related (65 | 3.6%).
Sales and Office Occupations by Sex
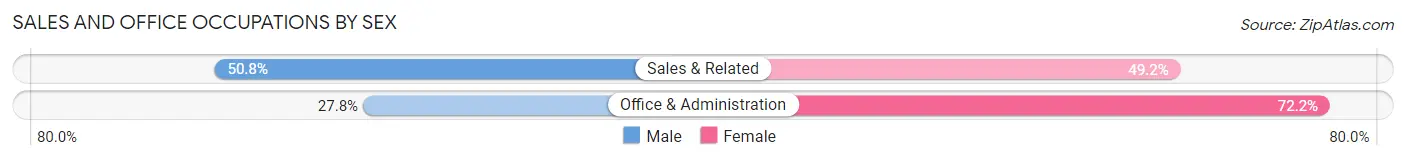
| Occupation | Male | Female |
| Sales & Related | 33 (50.8%) | 32 (49.2%) |
| Office & Administration | 57 (27.8%) | 148 (72.2%) |
| Total (Category) | 90 (33.3%) | 180 (66.7%) |
| Total (Overall) | 899 (50.5%) | 880 (49.5%) |
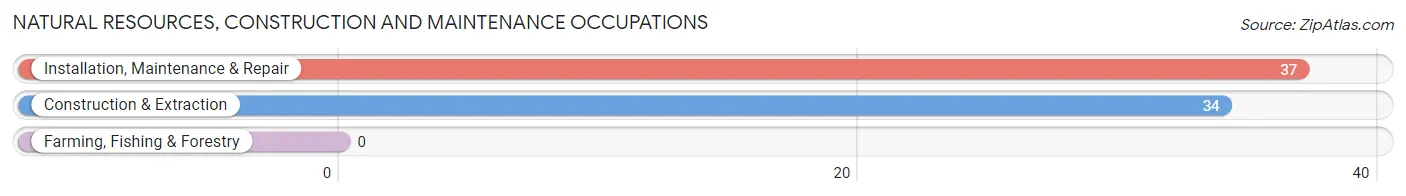
Natural Resources, Construction and Maintenance Occupations
The most common Natural Resources, Construction and Maintenance occupations in Girard borough are Installation, Maintenance & Repair (37 | 2.1%), and Construction & Extraction (34 | 1.9%).
Natural Resources, Construction and Maintenance Occupations by Sex
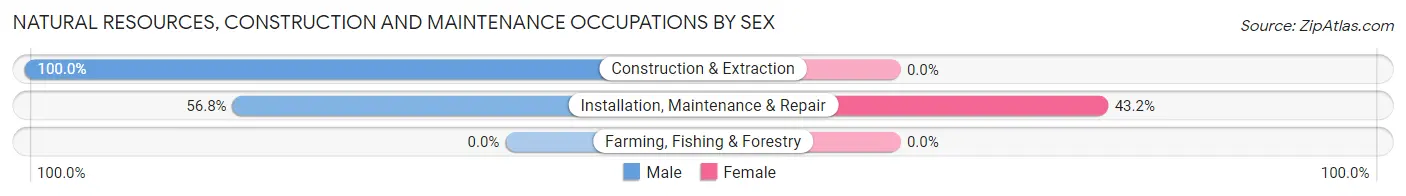
| Occupation | Male | Female |
| Farming, Fishing & Forestry | 0 (0.0%) | 0 (0.0%) |
| Construction & Extraction | 34 (100.0%) | 0 (0.0%) |
| Installation, Maintenance & Repair | 21 (56.8%) | 16 (43.2%) |
| Total (Category) | 55 (77.5%) | 16 (22.5%) |
| Total (Overall) | 899 (50.5%) | 880 (49.5%) |
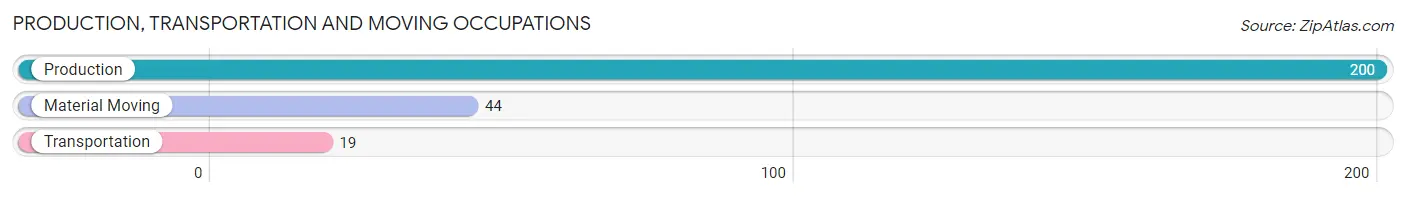
Production, Transportation and Moving Occupations
The most common Production, Transportation and Moving occupations in Girard borough are Production (200 | 11.2%), Material Moving (44 | 2.5%), and Transportation (19 | 1.1%).
Production, Transportation and Moving Occupations by Sex
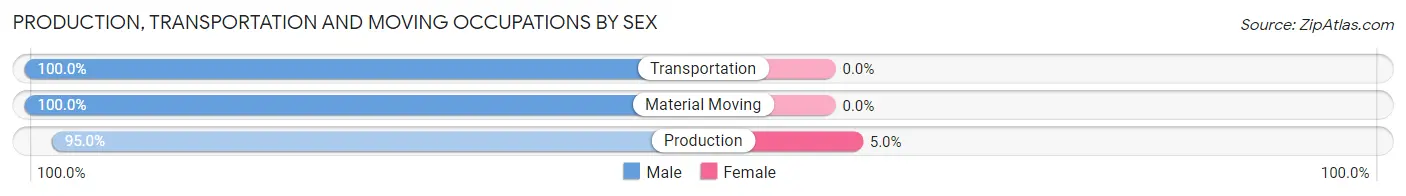
| Occupation | Male | Female |
| Production | 190 (95.0%) | 10 (5.0%) |
| Transportation | 19 (100.0%) | 0 (0.0%) |
| Material Moving | 44 (100.0%) | 0 (0.0%) |
| Total (Category) | 253 (96.2%) | 10 (3.8%) |
| Total (Overall) | 899 (50.5%) | 880 (49.5%) |
Employment Industries by Sex in Girard borough
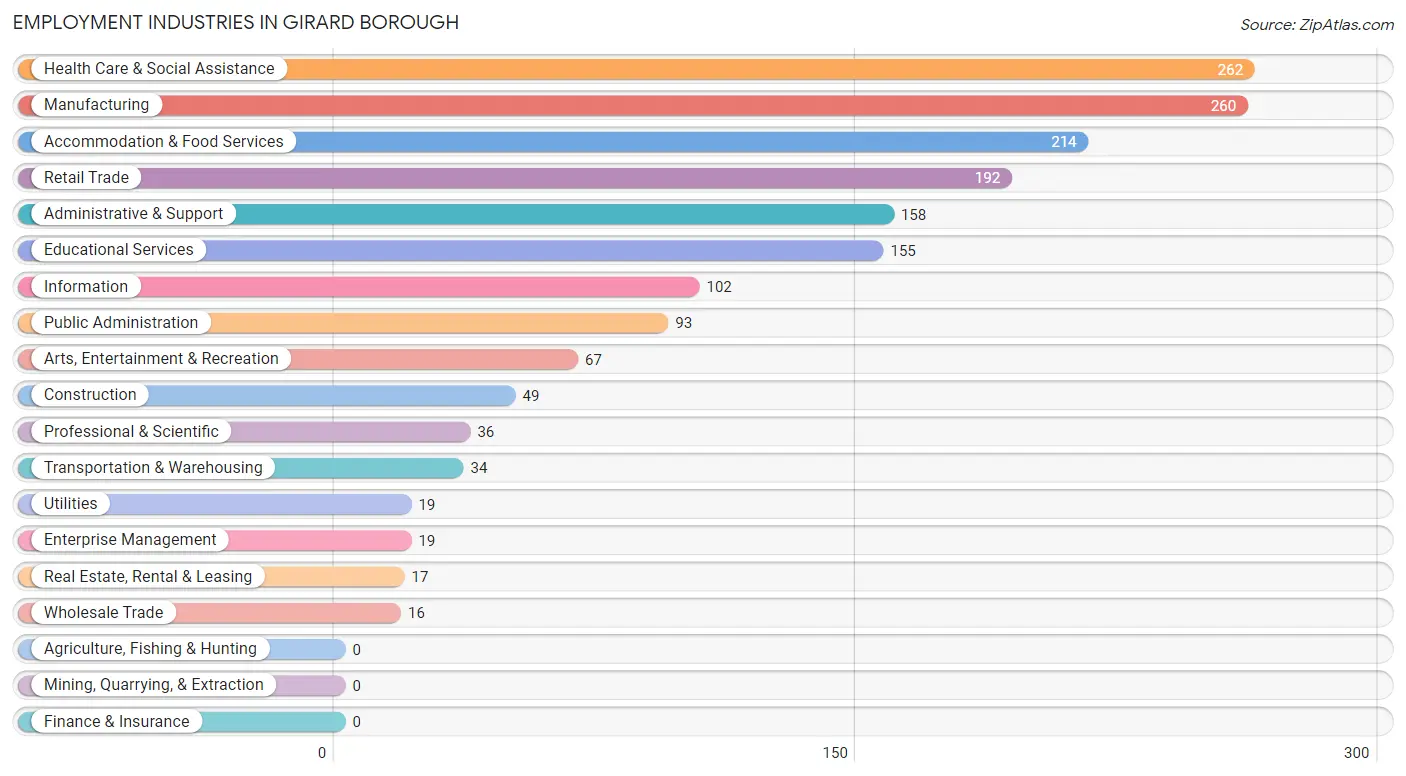
Employment Industries in Girard borough
The major employment industries in Girard borough include Health Care & Social Assistance (262 | 14.7%), Manufacturing (260 | 14.6%), Accommodation & Food Services (214 | 12.0%), Retail Trade (192 | 10.8%), and Administrative & Support (158 | 8.9%).
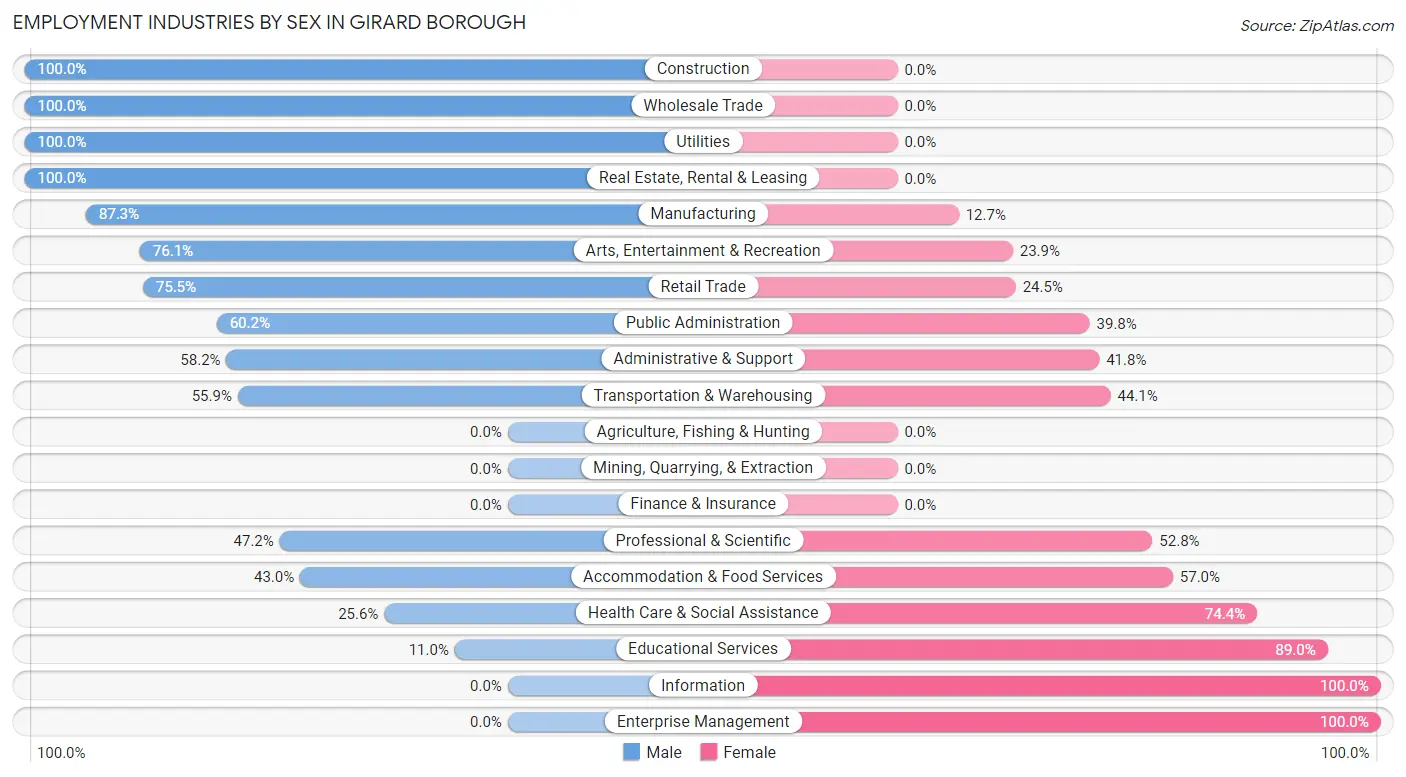
Employment Industries by Sex in Girard borough
The Girard borough industries that see more men than women are Construction (100.0%), Wholesale Trade (100.0%), and Utilities (100.0%), whereas the industries that tend to have a higher number of women are Information (100.0%), Enterprise Management (100.0%), and Educational Services (89.0%).
| Industry | Male | Female |
| Agriculture, Fishing & Hunting | 0 (0.0%) | 0 (0.0%) |
| Mining, Quarrying, & Extraction | 0 (0.0%) | 0 (0.0%) |
| Construction | 49 (100.0%) | 0 (0.0%) |
| Manufacturing | 227 (87.3%) | 33 (12.7%) |
| Wholesale Trade | 16 (100.0%) | 0 (0.0%) |
| Retail Trade | 145 (75.5%) | 47 (24.5%) |
| Transportation & Warehousing | 19 (55.9%) | 15 (44.1%) |
| Utilities | 19 (100.0%) | 0 (0.0%) |
| Information | 0 (0.0%) | 102 (100.0%) |
| Finance & Insurance | 0 (0.0%) | 0 (0.0%) |
| Real Estate, Rental & Leasing | 17 (100.0%) | 0 (0.0%) |
| Professional & Scientific | 17 (47.2%) | 19 (52.8%) |
| Enterprise Management | 0 (0.0%) | 19 (100.0%) |
| Administrative & Support | 92 (58.2%) | 66 (41.8%) |
| Educational Services | 17 (11.0%) | 138 (89.0%) |
| Health Care & Social Assistance | 67 (25.6%) | 195 (74.4%) |
| Arts, Entertainment & Recreation | 51 (76.1%) | 16 (23.9%) |
| Accommodation & Food Services | 92 (43.0%) | 122 (57.0%) |
| Public Administration | 56 (60.2%) | 37 (39.8%) |
| Total | 899 (50.5%) | 880 (49.5%) |
Education in Girard borough
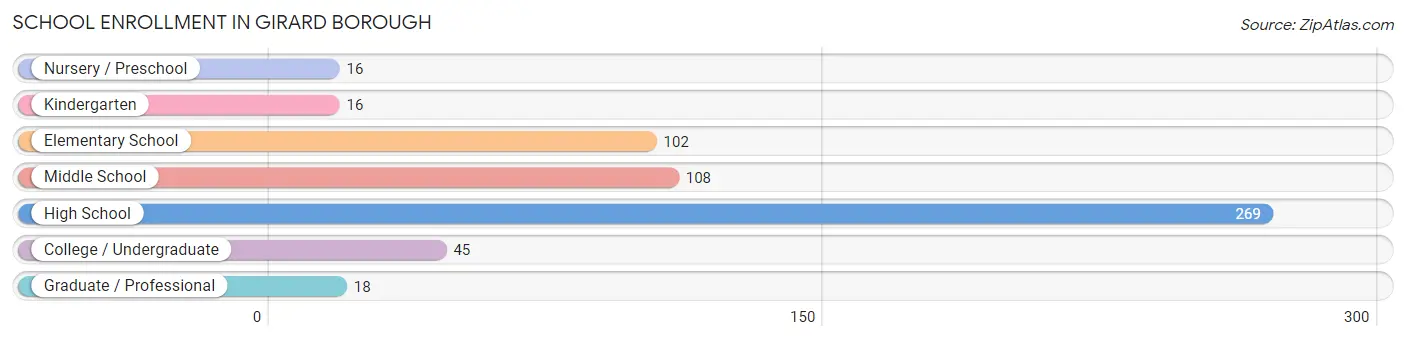
School Enrollment in Girard borough
The most common levels of schooling among the 574 students in Girard borough are high school (269 | 46.9%), middle school (108 | 18.8%), and elementary school (102 | 17.8%).
| School Level | # Students | % Students |
| Nursery / Preschool | 16 | 2.8% |
| Kindergarten | 16 | 2.8% |
| Elementary School | 102 | 17.8% |
| Middle School | 108 | 18.8% |
| High School | 269 | 46.9% |
| College / Undergraduate | 45 | 7.8% |
| Graduate / Professional | 18 | 3.1% |
| Total | 574 | 100.0% |
School Enrollment by Age by Funding Source in Girard borough
Out of a total of 574 students who are enrolled in schools in Girard borough, 64 (11.1%) attend a private institution, while the remaining 510 (88.9%) are enrolled in public schools. The age group of 25 to 34 year olds has the highest likelihood of being enrolled in private schools, with 34 (100.0% in the age bracket) enrolled. Conversely, the age group of 10 to 14 year olds has the lowest likelihood of being enrolled in a private school, with 108 (100.0% in the age bracket) attending a public institution.
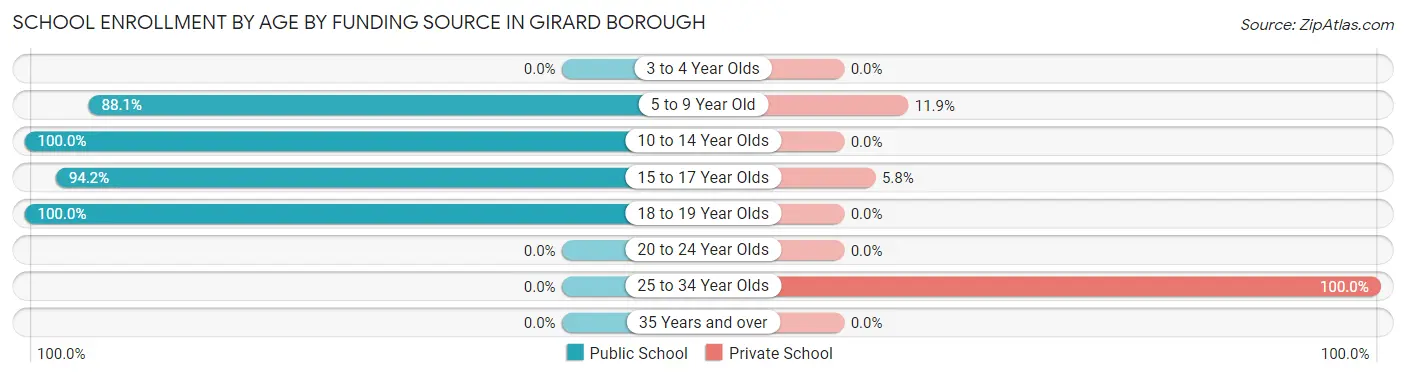
| Age Bracket | Public School | Private School |
| 3 to 4 Year Olds | 0 (0.0%) | 0 (0.0%) |
| 5 to 9 Year Old | 118 (88.1%) | 16 (11.9%) |
| 10 to 14 Year Olds | 108 (100.0%) | 0 (0.0%) |
| 15 to 17 Year Olds | 226 (94.2%) | 14 (5.8%) |
| 18 to 19 Year Olds | 58 (100.0%) | 0 (0.0%) |
| 20 to 24 Year Olds | 0 (0.0%) | 0 (0.0%) |
| 25 to 34 Year Olds | 0 (0.0%) | 34 (100.0%) |
| 35 Years and over | 0 (0.0%) | 0 (0.0%) |
| Total | 510 (88.9%) | 64 (11.1%) |
Educational Attainment by Field of Study in Girard borough
Business (162 | 25.8%), education (114 | 18.2%), science & technology (88 | 14.0%), communications (64 | 10.2%), and psychology (49 | 7.8%) are the most common fields of study among 627 individuals in Girard borough who have obtained a bachelor's degree or higher.
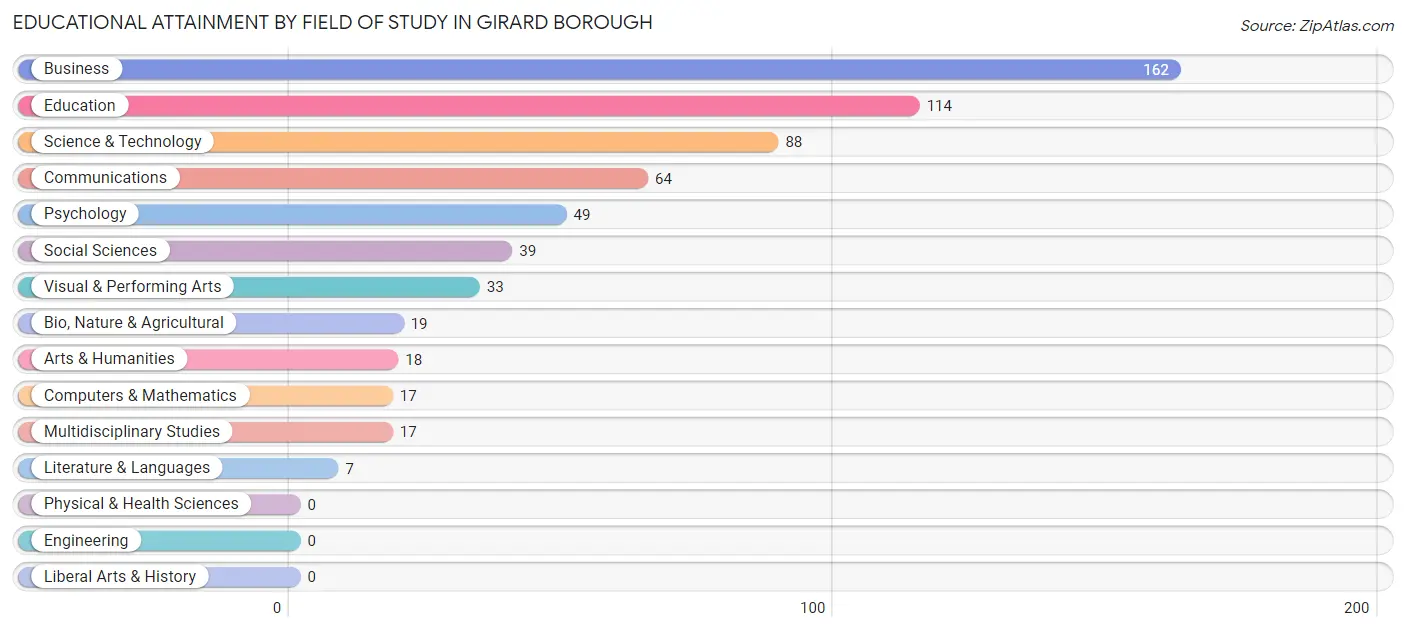
| Field of Study | # Graduates | % Graduates |
| Computers & Mathematics | 17 | 2.7% |
| Bio, Nature & Agricultural | 19 | 3.0% |
| Physical & Health Sciences | 0 | 0.0% |
| Psychology | 49 | 7.8% |
| Social Sciences | 39 | 6.2% |
| Engineering | 0 | 0.0% |
| Multidisciplinary Studies | 17 | 2.7% |
| Science & Technology | 88 | 14.0% |
| Business | 162 | 25.8% |
| Education | 114 | 18.2% |
| Literature & Languages | 7 | 1.1% |
| Liberal Arts & History | 0 | 0.0% |
| Visual & Performing Arts | 33 | 5.3% |
| Communications | 64 | 10.2% |
| Arts & Humanities | 18 | 2.9% |
| Total | 627 | 100.0% |
Transportation & Commute in Girard borough
Vehicle Availability by Sex in Girard borough
The most prevalent vehicle ownership categories in Girard borough are males with 1 vehicle (275, accounting for 30.6%) and females with 1 vehicle (274, making up 31.2%).
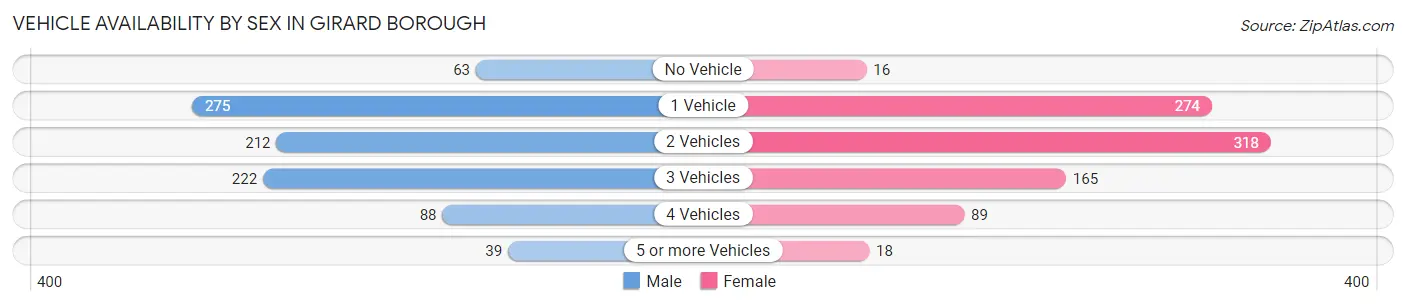
| Vehicles Available | Male | Female |
| No Vehicle | 63 (7.0%) | 16 (1.8%) |
| 1 Vehicle | 275 (30.6%) | 274 (31.1%) |
| 2 Vehicles | 212 (23.6%) | 318 (36.1%) |
| 3 Vehicles | 222 (24.7%) | 165 (18.8%) |
| 4 Vehicles | 88 (9.8%) | 89 (10.1%) |
| 5 or more Vehicles | 39 (4.3%) | 18 (2.1%) |
| Total | 899 (100.0%) | 880 (100.0%) |
Commute Time in Girard borough
The most frequently occuring commute durations in Girard borough are 20 to 24 minutes (391 commuters, 22.6%), 10 to 14 minutes (281 commuters, 16.3%), and 5 to 9 minutes (275 commuters, 15.9%).
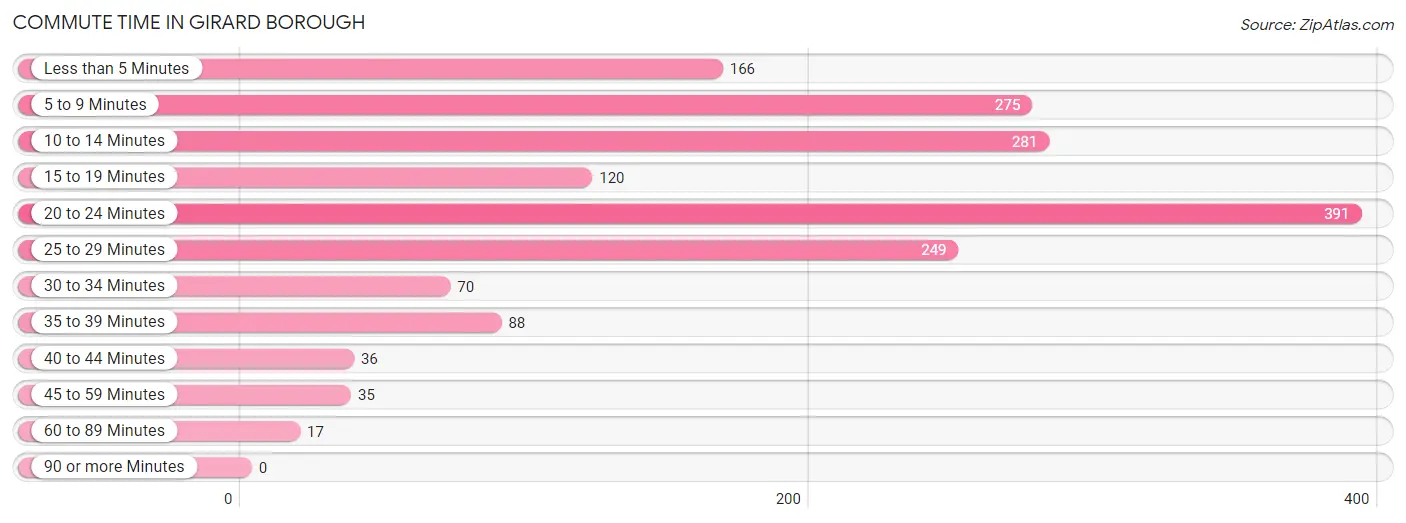
| Commute Time | # Commuters | % Commuters |
| Less than 5 Minutes | 166 | 9.6% |
| 5 to 9 Minutes | 275 | 15.9% |
| 10 to 14 Minutes | 281 | 16.3% |
| 15 to 19 Minutes | 120 | 6.9% |
| 20 to 24 Minutes | 391 | 22.6% |
| 25 to 29 Minutes | 249 | 14.4% |
| 30 to 34 Minutes | 70 | 4.1% |
| 35 to 39 Minutes | 88 | 5.1% |
| 40 to 44 Minutes | 36 | 2.1% |
| 45 to 59 Minutes | 35 | 2.0% |
| 60 to 89 Minutes | 17 | 1.0% |
| 90 or more Minutes | 0 | 0.0% |
Commute Time by Sex in Girard borough
The most common commute times in Girard borough are 20 to 24 minutes (311 commuters, 35.9%) for males and 10 to 14 minutes (234 commuters, 27.2%) for females.
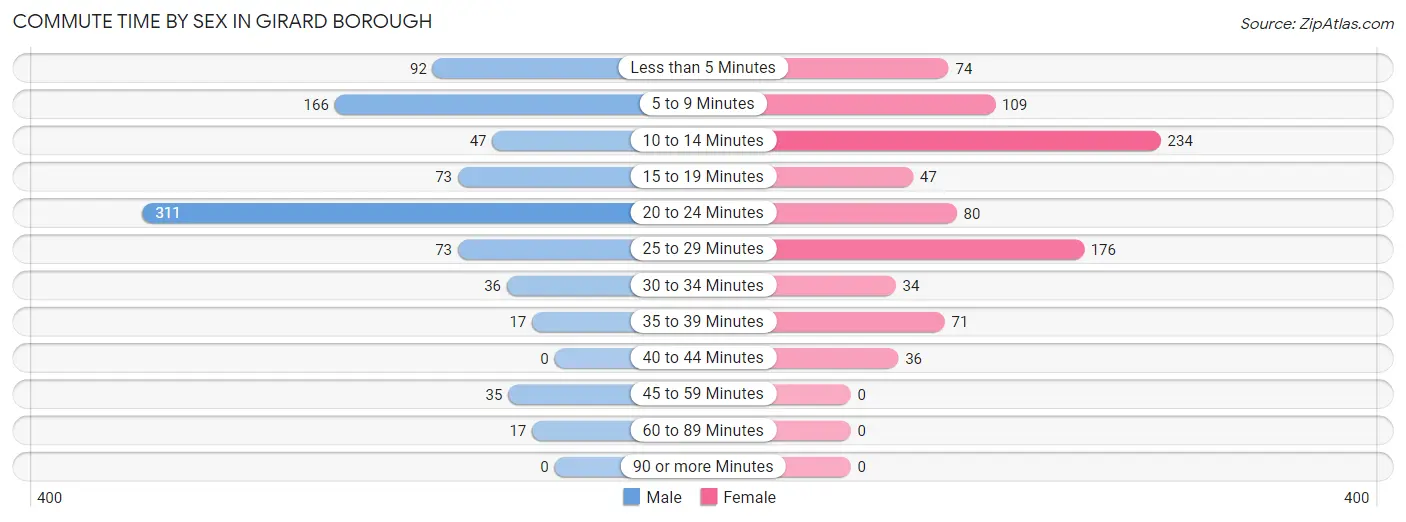
| Commute Time | Male | Female |
| Less than 5 Minutes | 92 (10.6%) | 74 (8.6%) |
| 5 to 9 Minutes | 166 (19.2%) | 109 (12.7%) |
| 10 to 14 Minutes | 47 (5.4%) | 234 (27.2%) |
| 15 to 19 Minutes | 73 (8.4%) | 47 (5.5%) |
| 20 to 24 Minutes | 311 (35.9%) | 80 (9.3%) |
| 25 to 29 Minutes | 73 (8.4%) | 176 (20.4%) |
| 30 to 34 Minutes | 36 (4.2%) | 34 (4.0%) |
| 35 to 39 Minutes | 17 (2.0%) | 71 (8.3%) |
| 40 to 44 Minutes | 0 (0.0%) | 36 (4.2%) |
| 45 to 59 Minutes | 35 (4.0%) | 0 (0.0%) |
| 60 to 89 Minutes | 17 (2.0%) | 0 (0.0%) |
| 90 or more Minutes | 0 (0.0%) | 0 (0.0%) |
Time of Departure to Work by Sex in Girard borough
The most frequent times of departure to work in Girard borough are 7:30 AM to 7:59 AM (140, 16.2%) for males and 6:00 AM to 6:29 AM (172, 20.0%) for females.
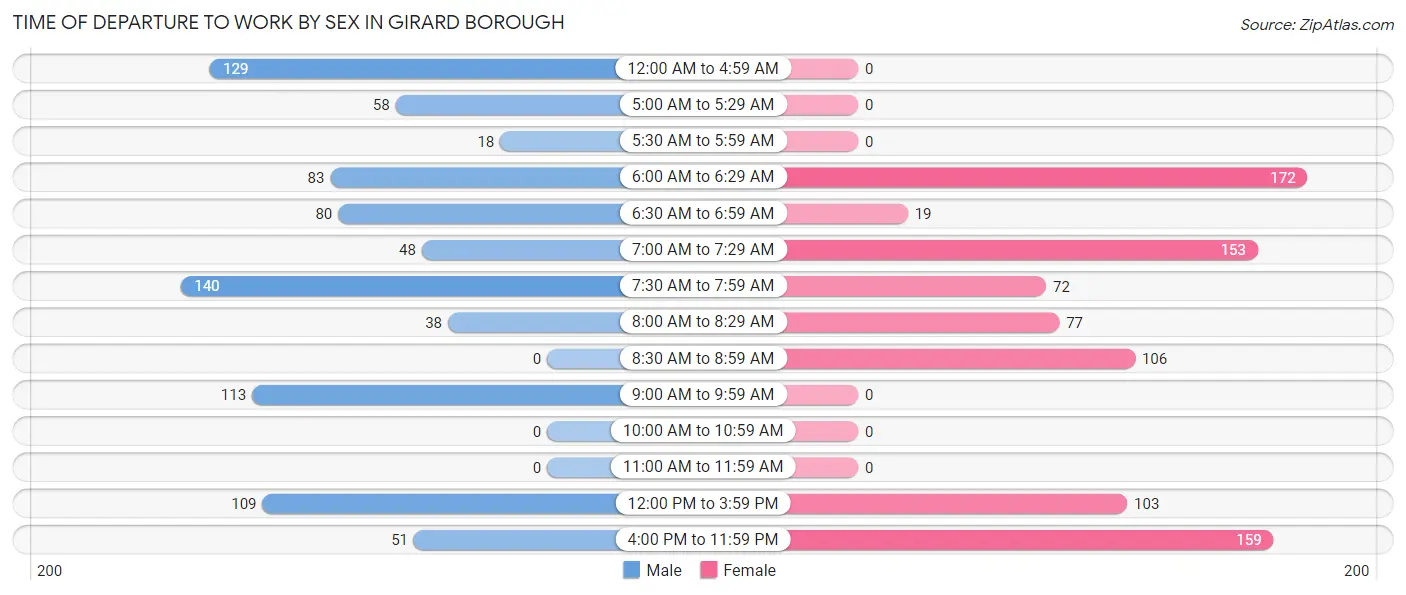
| Time of Departure | Male | Female |
| 12:00 AM to 4:59 AM | 129 (14.9%) | 0 (0.0%) |
| 5:00 AM to 5:29 AM | 58 (6.7%) | 0 (0.0%) |
| 5:30 AM to 5:59 AM | 18 (2.1%) | 0 (0.0%) |
| 6:00 AM to 6:29 AM | 83 (9.6%) | 172 (20.0%) |
| 6:30 AM to 6:59 AM | 80 (9.2%) | 19 (2.2%) |
| 7:00 AM to 7:29 AM | 48 (5.5%) | 153 (17.8%) |
| 7:30 AM to 7:59 AM | 140 (16.2%) | 72 (8.4%) |
| 8:00 AM to 8:29 AM | 38 (4.4%) | 77 (8.9%) |
| 8:30 AM to 8:59 AM | 0 (0.0%) | 106 (12.3%) |
| 9:00 AM to 9:59 AM | 113 (13.0%) | 0 (0.0%) |
| 10:00 AM to 10:59 AM | 0 (0.0%) | 0 (0.0%) |
| 11:00 AM to 11:59 AM | 0 (0.0%) | 0 (0.0%) |
| 12:00 PM to 3:59 PM | 109 (12.6%) | 103 (12.0%) |
| 4:00 PM to 11:59 PM | 51 (5.9%) | 159 (18.5%) |
| Total | 867 (100.0%) | 861 (100.0%) |
Housing Occupancy in Girard borough
Occupancy by Ownership in Girard borough
Of the total 1,421 dwellings in Girard borough, owner-occupied units account for 781 (55.0%), while renter-occupied units make up 640 (45.0%).
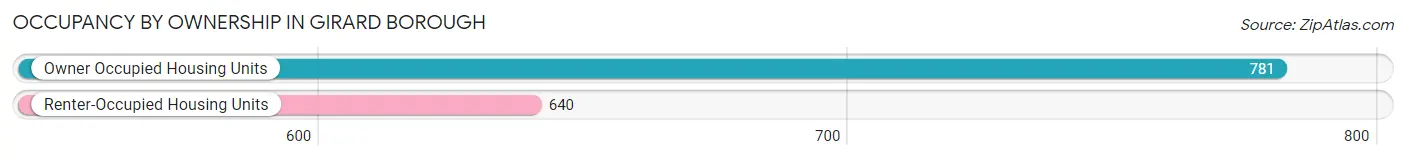
| Occupancy | # Housing Units | % Housing Units |
| Owner Occupied Housing Units | 781 | 55.0% |
| Renter-Occupied Housing Units | 640 | 45.0% |
| Total Occupied Housing Units | 1,421 | 100.0% |
Occupancy by Household Size in Girard borough
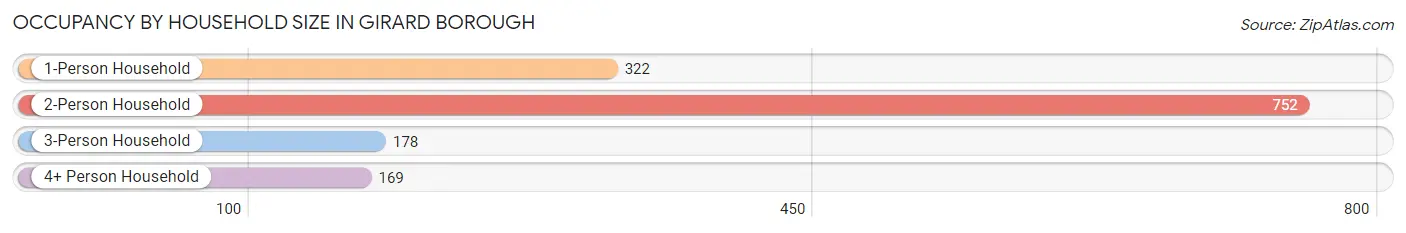
| Household Size | # Housing Units | % Housing Units |
| 1-Person Household | 322 | 22.7% |
| 2-Person Household | 752 | 52.9% |
| 3-Person Household | 178 | 12.5% |
| 4+ Person Household | 169 | 11.9% |
| Total Housing Units | 1,421 | 100.0% |
Occupancy by Ownership by Household Size in Girard borough
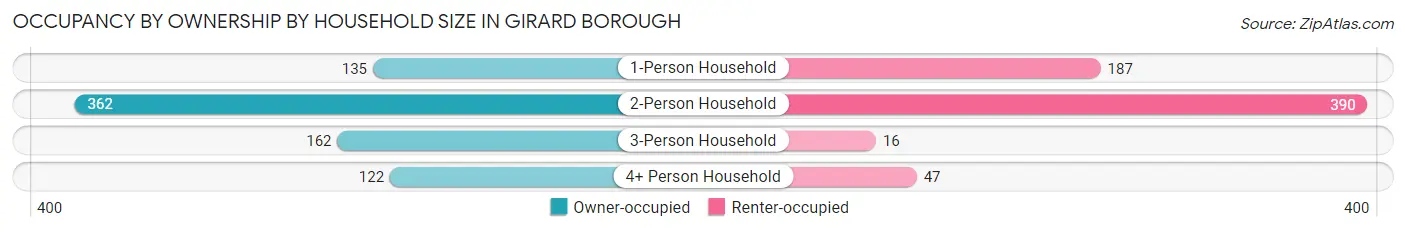
| Household Size | Owner-occupied | Renter-occupied |
| 1-Person Household | 135 (41.9%) | 187 (58.1%) |
| 2-Person Household | 362 (48.1%) | 390 (51.9%) |
| 3-Person Household | 162 (91.0%) | 16 (9.0%) |
| 4+ Person Household | 122 (72.2%) | 47 (27.8%) |
| Total Housing Units | 781 (55.0%) | 640 (45.0%) |
Occupancy by Educational Attainment in Girard borough
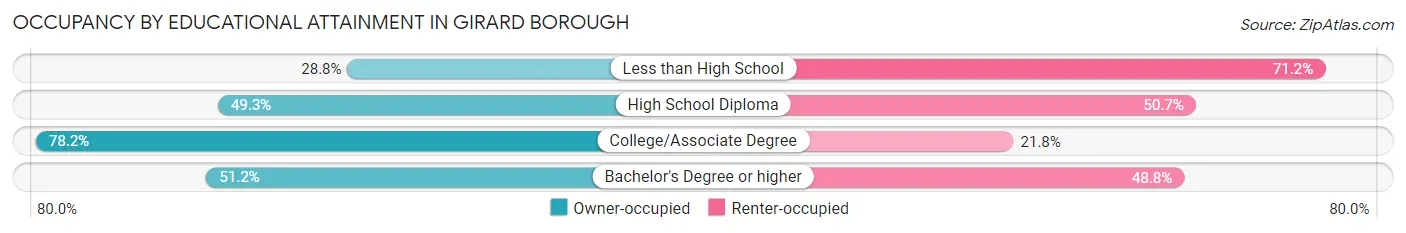
| Household Size | Owner-occupied | Renter-occupied |
| Less than High School | 17 (28.8%) | 42 (71.2%) |
| High School Diploma | 296 (49.3%) | 304 (50.7%) |
| College/Associate Degree | 226 (78.2%) | 63 (21.8%) |
| Bachelor's Degree or higher | 242 (51.2%) | 231 (48.8%) |
Occupancy by Age of Householder in Girard borough
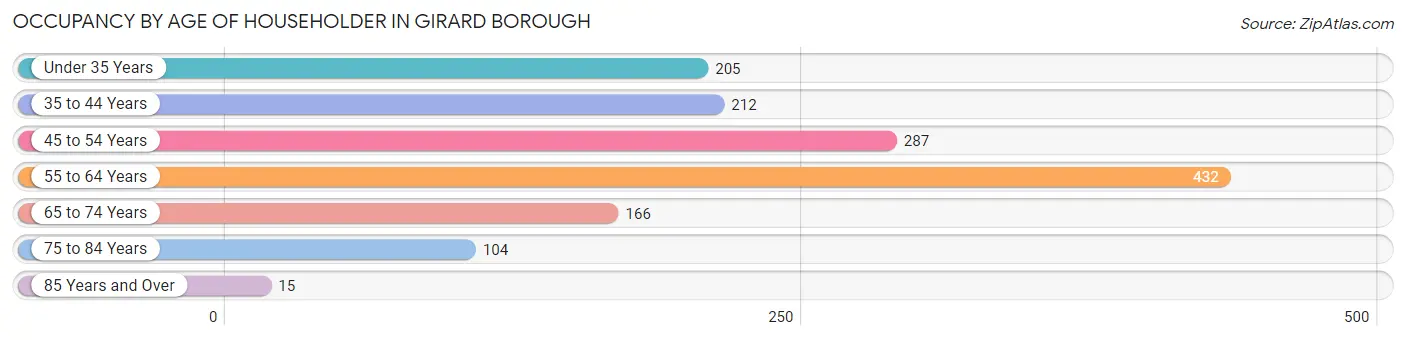
| Age Bracket | # Households | % Households |
| Under 35 Years | 205 | 14.4% |
| 35 to 44 Years | 212 | 14.9% |
| 45 to 54 Years | 287 | 20.2% |
| 55 to 64 Years | 432 | 30.4% |
| 65 to 74 Years | 166 | 11.7% |
| 75 to 84 Years | 104 | 7.3% |
| 85 Years and Over | 15 | 1.1% |
| Total | 1,421 | 100.0% |
Housing Finances in Girard borough
Median Income by Occupancy in Girard borough
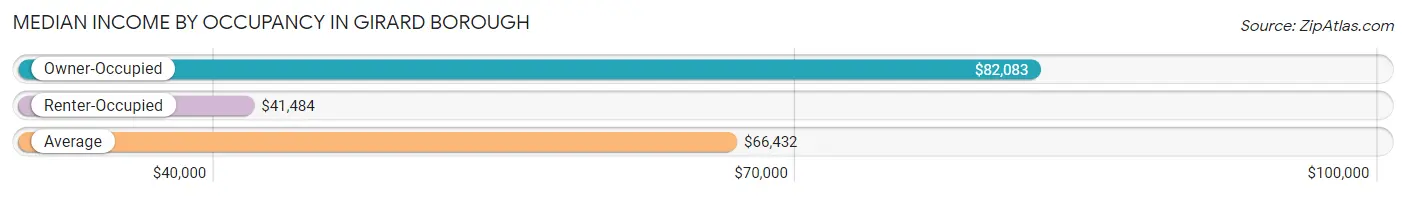
| Occupancy Type | # Households | Median Income |
| Owner-Occupied | 781 (55.0%) | $82,083 |
| Renter-Occupied | 640 (45.0%) | $41,484 |
| Average | 1,421 (100.0%) | $66,432 |
Occupancy by Householder Income Bracket in Girard borough
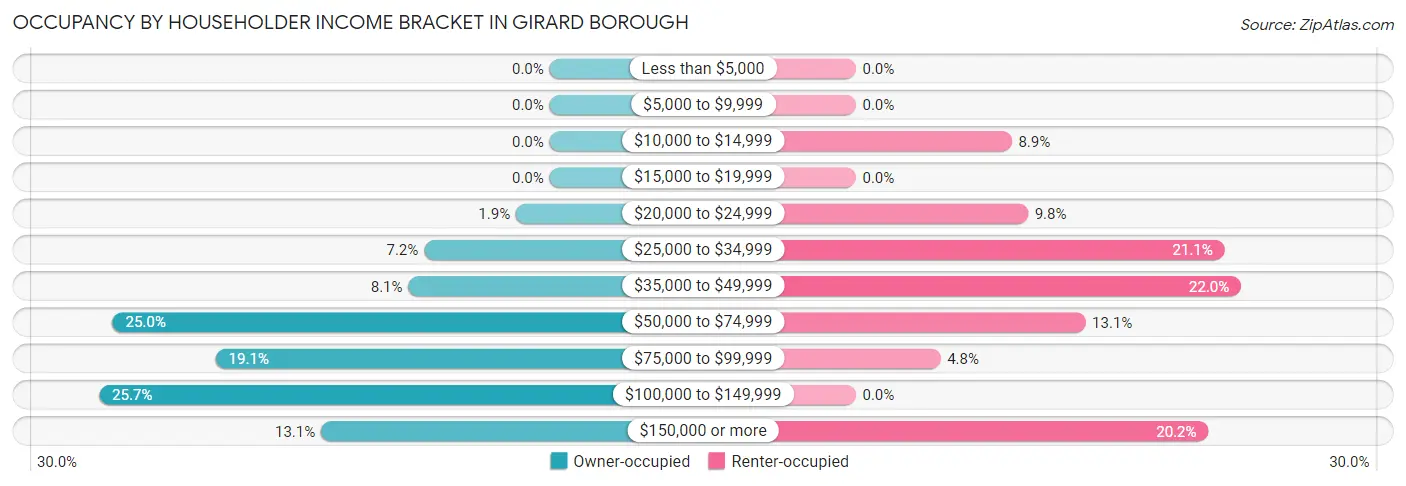
| Income Bracket | Owner-occupied | Renter-occupied |
| Less than $5,000 | 0 (0.0%) | 0 (0.0%) |
| $5,000 to $9,999 | 0 (0.0%) | 0 (0.0%) |
| $10,000 to $14,999 | 0 (0.0%) | 57 (8.9%) |
| $15,000 to $19,999 | 0 (0.0%) | 0 (0.0%) |
| $20,000 to $24,999 | 15 (1.9%) | 63 (9.8%) |
| $25,000 to $34,999 | 56 (7.2%) | 135 (21.1%) |
| $35,000 to $49,999 | 63 (8.1%) | 141 (22.0%) |
| $50,000 to $74,999 | 195 (25.0%) | 84 (13.1%) |
| $75,000 to $99,999 | 149 (19.1%) | 31 (4.8%) |
| $100,000 to $149,999 | 201 (25.7%) | 0 (0.0%) |
| $150,000 or more | 102 (13.1%) | 129 (20.2%) |
| Total | 781 (100.0%) | 640 (100.0%) |
Monthly Housing Cost Tiers in Girard borough
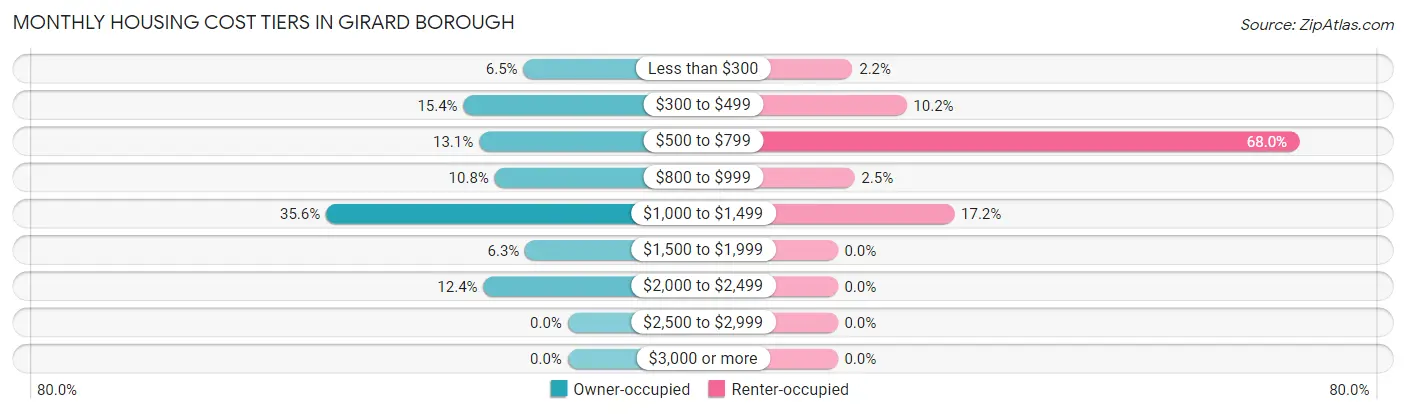
| Monthly Cost | Owner-occupied | Renter-occupied |
| Less than $300 | 51 (6.5%) | 14 (2.2%) |
| $300 to $499 | 120 (15.4%) | 65 (10.2%) |
| $500 to $799 | 102 (13.1%) | 435 (68.0%) |
| $800 to $999 | 84 (10.8%) | 16 (2.5%) |
| $1,000 to $1,499 | 278 (35.6%) | 110 (17.2%) |
| $1,500 to $1,999 | 49 (6.3%) | 0 (0.0%) |
| $2,000 to $2,499 | 97 (12.4%) | 0 (0.0%) |
| $2,500 to $2,999 | 0 (0.0%) | 0 (0.0%) |
| $3,000 or more | 0 (0.0%) | 0 (0.0%) |
| Total | 781 (100.0%) | 640 (100.0%) |
Physical Housing Characteristics in Girard borough
Housing Structures in Girard borough
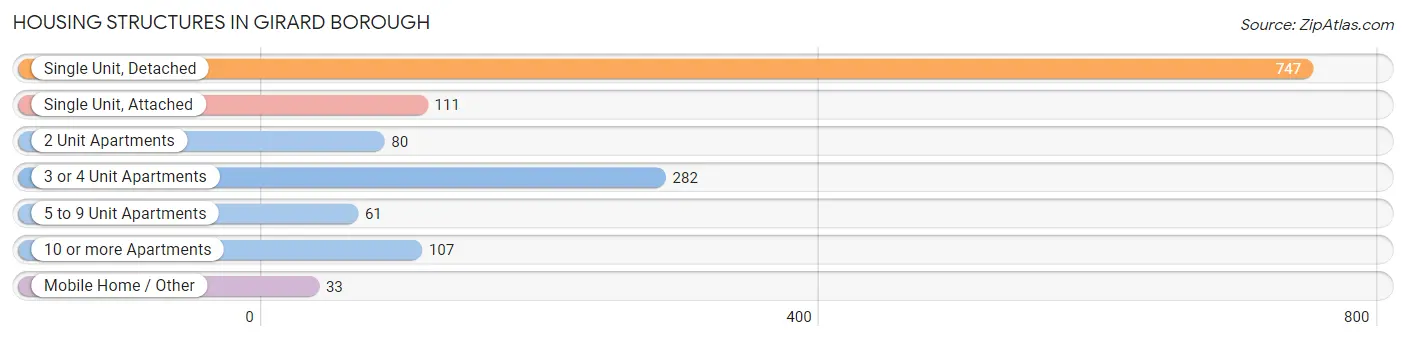
| Structure Type | # Housing Units | % Housing Units |
| Single Unit, Detached | 747 | 52.6% |
| Single Unit, Attached | 111 | 7.8% |
| 2 Unit Apartments | 80 | 5.6% |
| 3 or 4 Unit Apartments | 282 | 19.9% |
| 5 to 9 Unit Apartments | 61 | 4.3% |
| 10 or more Apartments | 107 | 7.5% |
| Mobile Home / Other | 33 | 2.3% |
| Total | 1,421 | 100.0% |
Housing Structures by Occupancy in Girard borough
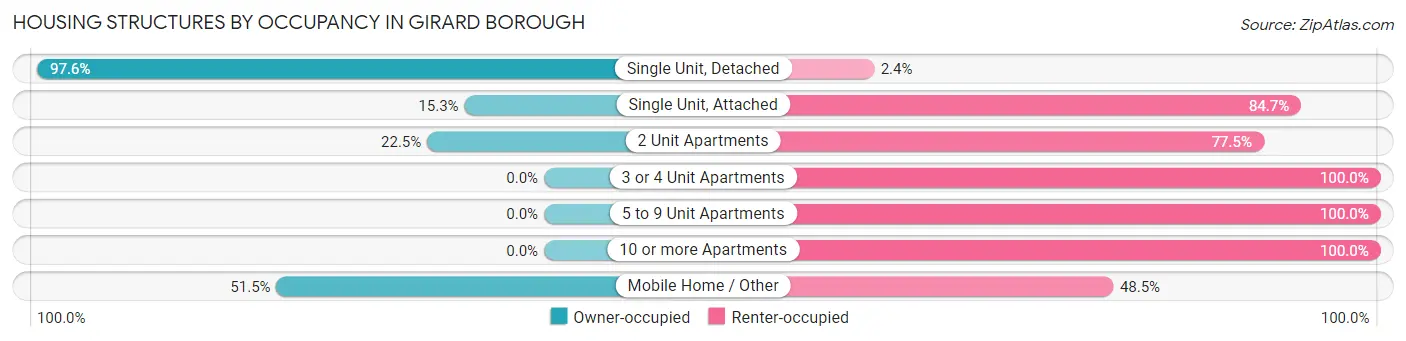
| Structure Type | Owner-occupied | Renter-occupied |
| Single Unit, Detached | 729 (97.6%) | 18 (2.4%) |
| Single Unit, Attached | 17 (15.3%) | 94 (84.7%) |
| 2 Unit Apartments | 18 (22.5%) | 62 (77.5%) |
| 3 or 4 Unit Apartments | 0 (0.0%) | 282 (100.0%) |
| 5 to 9 Unit Apartments | 0 (0.0%) | 61 (100.0%) |
| 10 or more Apartments | 0 (0.0%) | 107 (100.0%) |
| Mobile Home / Other | 17 (51.5%) | 16 (48.5%) |
| Total | 781 (55.0%) | 640 (45.0%) |
Housing Structures by Number of Rooms in Girard borough
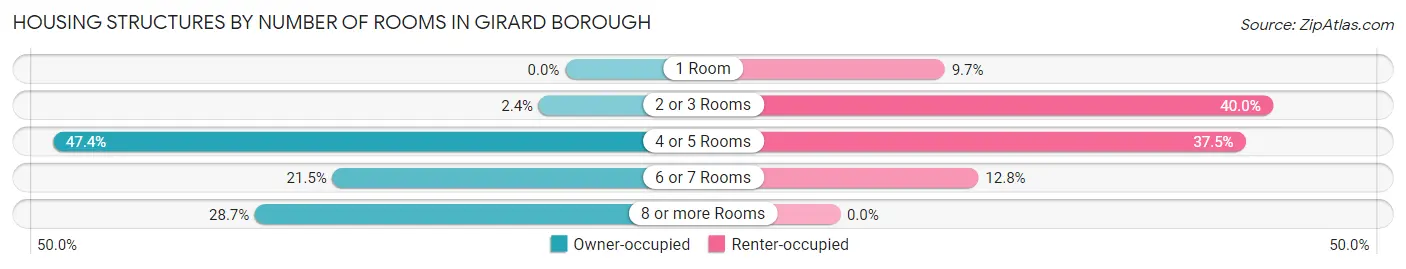
| Number of Rooms | Owner-occupied | Renter-occupied |
| 1 Room | 0 (0.0%) | 62 (9.7%) |
| 2 or 3 Rooms | 19 (2.4%) | 256 (40.0%) |
| 4 or 5 Rooms | 370 (47.4%) | 240 (37.5%) |
| 6 or 7 Rooms | 168 (21.5%) | 82 (12.8%) |
| 8 or more Rooms | 224 (28.7%) | 0 (0.0%) |
| Total | 781 (100.0%) | 640 (100.0%) |
Housing Structure by Heating Type in Girard borough
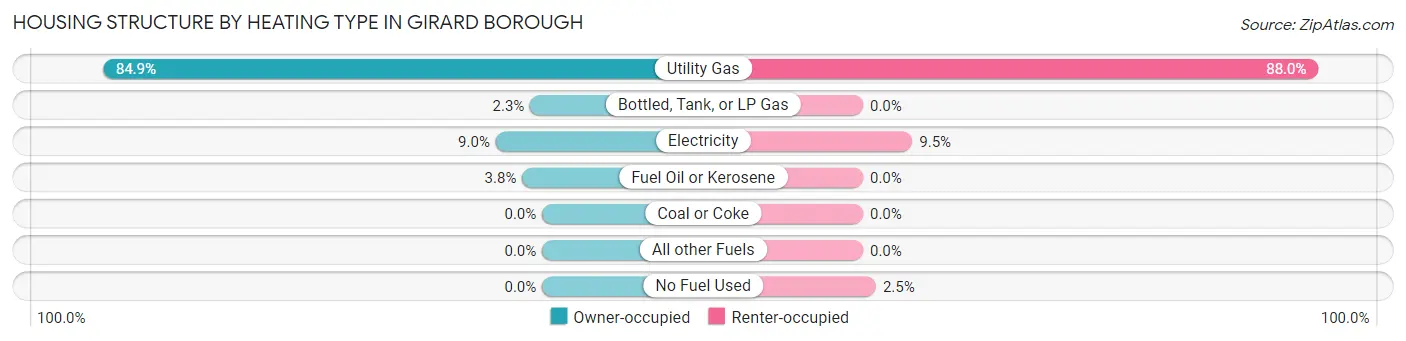
| Heating Type | Owner-occupied | Renter-occupied |
| Utility Gas | 663 (84.9%) | 563 (88.0%) |
| Bottled, Tank, or LP Gas | 18 (2.3%) | 0 (0.0%) |
| Electricity | 70 (9.0%) | 61 (9.5%) |
| Fuel Oil or Kerosene | 30 (3.8%) | 0 (0.0%) |
| Coal or Coke | 0 (0.0%) | 0 (0.0%) |
| All other Fuels | 0 (0.0%) | 0 (0.0%) |
| No Fuel Used | 0 (0.0%) | 16 (2.5%) |
| Total | 781 (100.0%) | 640 (100.0%) |
Household Vehicle Usage in Girard borough
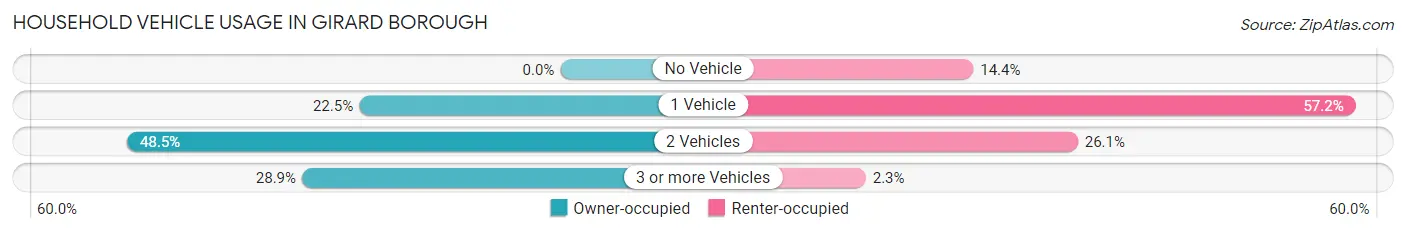
| Vehicles per Household | Owner-occupied | Renter-occupied |
| No Vehicle | 0 (0.0%) | 92 (14.4%) |
| 1 Vehicle | 176 (22.5%) | 366 (57.2%) |
| 2 Vehicles | 379 (48.5%) | 167 (26.1%) |
| 3 or more Vehicles | 226 (28.9%) | 15 (2.3%) |
| Total | 781 (100.0%) | 640 (100.0%) |
Real Estate & Mortgages in Girard borough
Real Estate and Mortgage Overview in Girard borough
| Characteristic | Without Mortgage | With Mortgage |
| Housing Units | 253 | 528 |
| Median Property Value | $152,500 | $164,800 |
| Median Household Income | $70,903 | $53 |
| Monthly Housing Costs | $440 | $0 |
| Real Estate Taxes | $1,664 | $0 |
Property Value by Mortgage Status in Girard borough
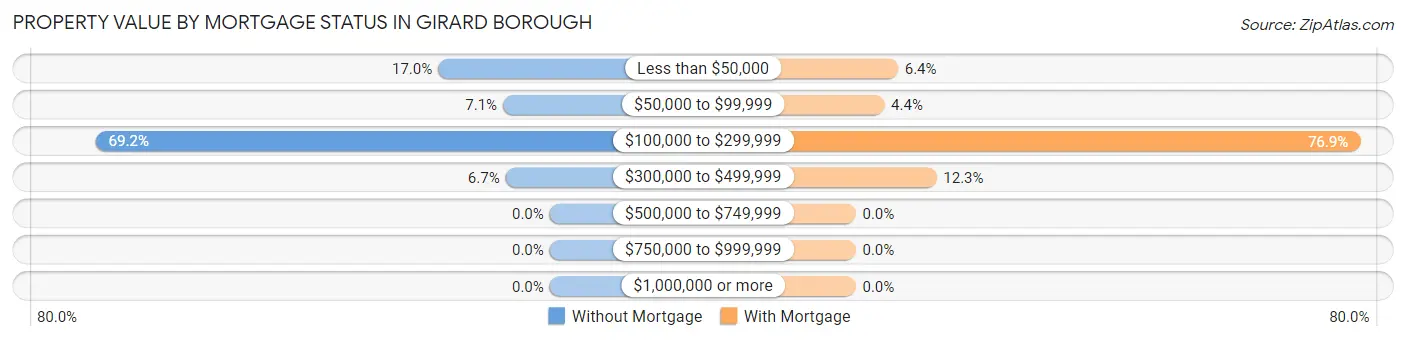
| Property Value | Without Mortgage | With Mortgage |
| Less than $50,000 | 43 (17.0%) | 34 (6.4%) |
| $50,000 to $99,999 | 18 (7.1%) | 23 (4.4%) |
| $100,000 to $299,999 | 175 (69.2%) | 406 (76.9%) |
| $300,000 to $499,999 | 17 (6.7%) | 65 (12.3%) |
| $500,000 to $749,999 | 0 (0.0%) | 0 (0.0%) |
| $750,000 to $999,999 | 0 (0.0%) | 0 (0.0%) |
| $1,000,000 or more | 0 (0.0%) | 0 (0.0%) |
| Total | 253 (100.0%) | 528 (100.0%) |
Household Income by Mortgage Status in Girard borough
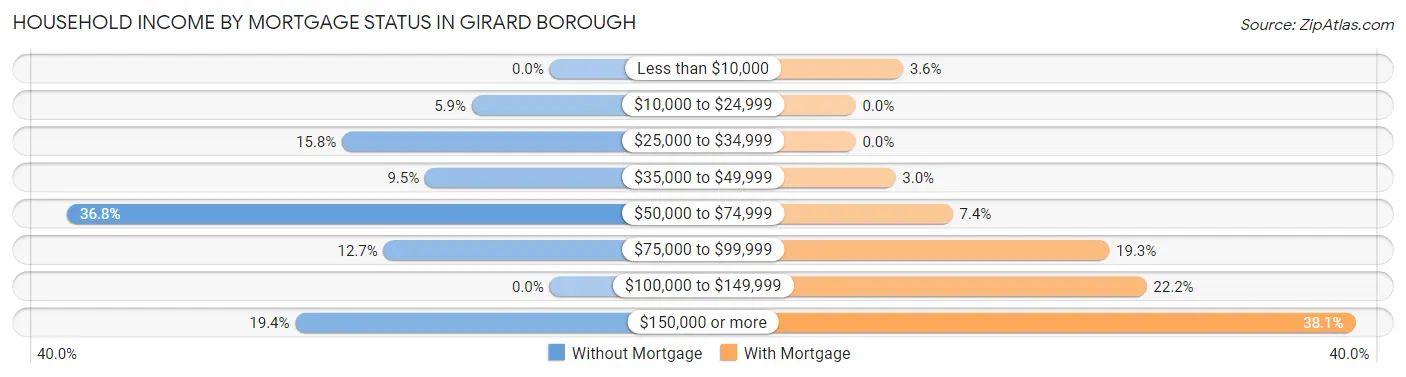
| Household Income | Without Mortgage | With Mortgage |
| Less than $10,000 | 0 (0.0%) | 19 (3.6%) |
| $10,000 to $24,999 | 15 (5.9%) | 0 (0.0%) |
| $25,000 to $34,999 | 40 (15.8%) | 0 (0.0%) |
| $35,000 to $49,999 | 24 (9.5%) | 16 (3.0%) |
| $50,000 to $74,999 | 93 (36.8%) | 39 (7.4%) |
| $75,000 to $99,999 | 32 (12.7%) | 102 (19.3%) |
| $100,000 to $149,999 | 0 (0.0%) | 117 (22.2%) |
| $150,000 or more | 49 (19.4%) | 201 (38.1%) |
| Total | 253 (100.0%) | 528 (100.0%) |
Property Value to Household Income Ratio in Girard borough
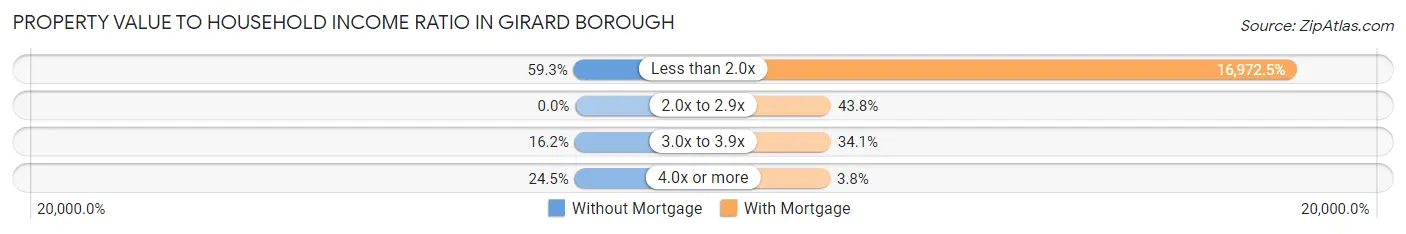
| Value-to-Income Ratio | Without Mortgage | With Mortgage |
| Less than 2.0x | 150 (59.3%) | 89,615 (16,972.5%) |
| 2.0x to 2.9x | 0 (0.0%) | 231 (43.8%) |
| 3.0x to 3.9x | 41 (16.2%) | 180 (34.1%) |
| 4.0x or more | 62 (24.5%) | 20 (3.8%) |
| Total | 253 (100.0%) | 528 (100.0%) |
Real Estate Taxes by Mortgage Status in Girard borough
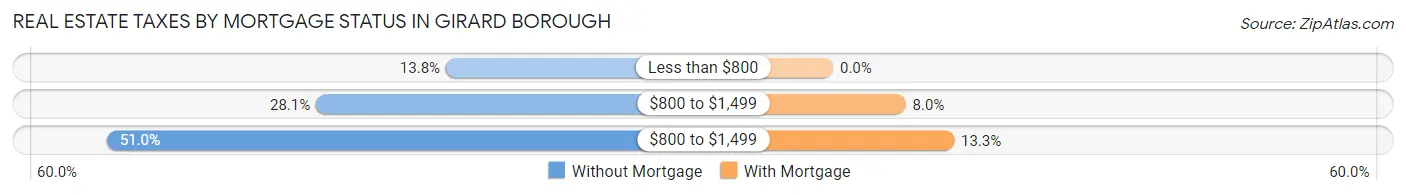
| Property Taxes | Without Mortgage | With Mortgage |
| Less than $800 | 35 (13.8%) | 0 (0.0%) |
| $800 to $1,499 | 71 (28.1%) | 42 (8.0%) |
| $800 to $1,499 | 129 (51.0%) | 70 (13.3%) |
| Total | 253 (100.0%) | 528 (100.0%) |
Health & Disability in Girard borough
Health Insurance Coverage by Age in Girard borough
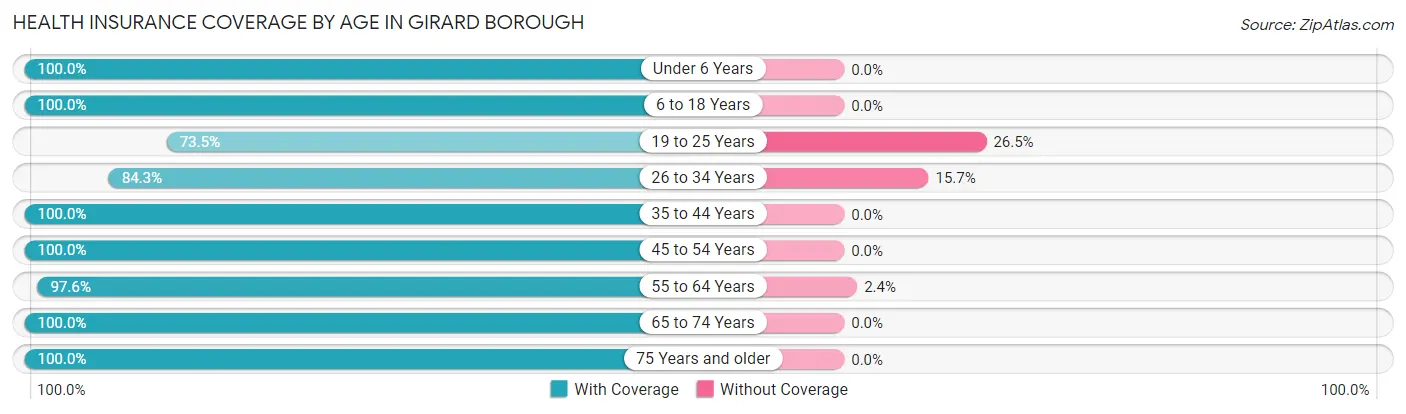
| Age Bracket | With Coverage | Without Coverage |
| Under 6 Years | 50 (100.0%) | 0 (0.0%) |
| 6 to 18 Years | 495 (100.0%) | 0 (0.0%) |
| 19 to 25 Years | 255 (73.5%) | 92 (26.5%) |
| 26 to 34 Years | 161 (84.3%) | 30 (15.7%) |
| 35 to 44 Years | 305 (100.0%) | 0 (0.0%) |
| 45 to 54 Years | 435 (100.0%) | 0 (0.0%) |
| 55 to 64 Years | 728 (97.6%) | 18 (2.4%) |
| 65 to 74 Years | 231 (100.0%) | 0 (0.0%) |
| 75 Years and older | 191 (100.0%) | 0 (0.0%) |
| Total | 2,851 (95.3%) | 140 (4.7%) |
Health Insurance Coverage by Citizenship Status in Girard borough
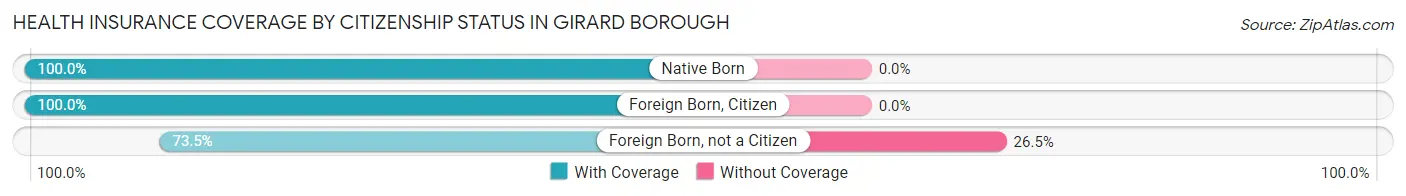
| Citizenship Status | With Coverage | Without Coverage |
| Native Born | 50 (100.0%) | 0 (0.0%) |
| Foreign Born, Citizen | 495 (100.0%) | 0 (0.0%) |
| Foreign Born, not a Citizen | 255 (73.5%) | 92 (26.5%) |
Health Insurance Coverage by Household Income in Girard borough
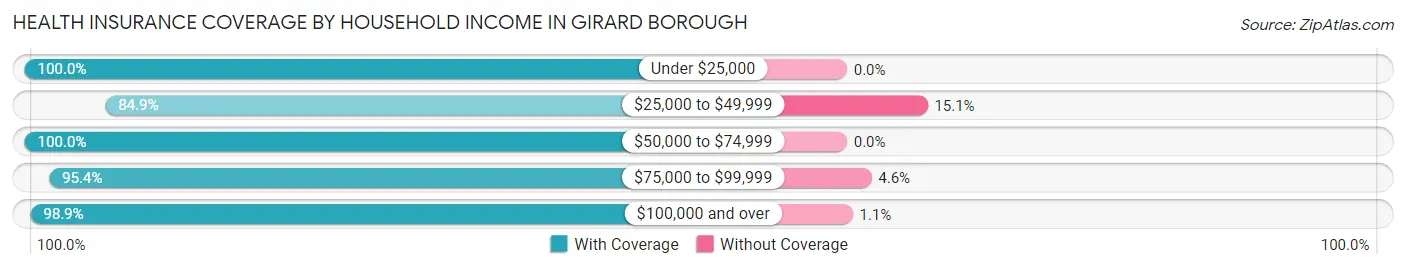
| Household Income | With Coverage | Without Coverage |
| Under $25,000 | 177 (100.0%) | 0 (0.0%) |
| $25,000 to $49,999 | 618 (84.9%) | 110 (15.1%) |
| $50,000 to $74,999 | 596 (100.0%) | 0 (0.0%) |
| $75,000 to $99,999 | 373 (95.4%) | 18 (4.6%) |
| $100,000 and over | 1,087 (98.9%) | 12 (1.1%) |
Public vs Private Health Insurance Coverage by Age in Girard borough
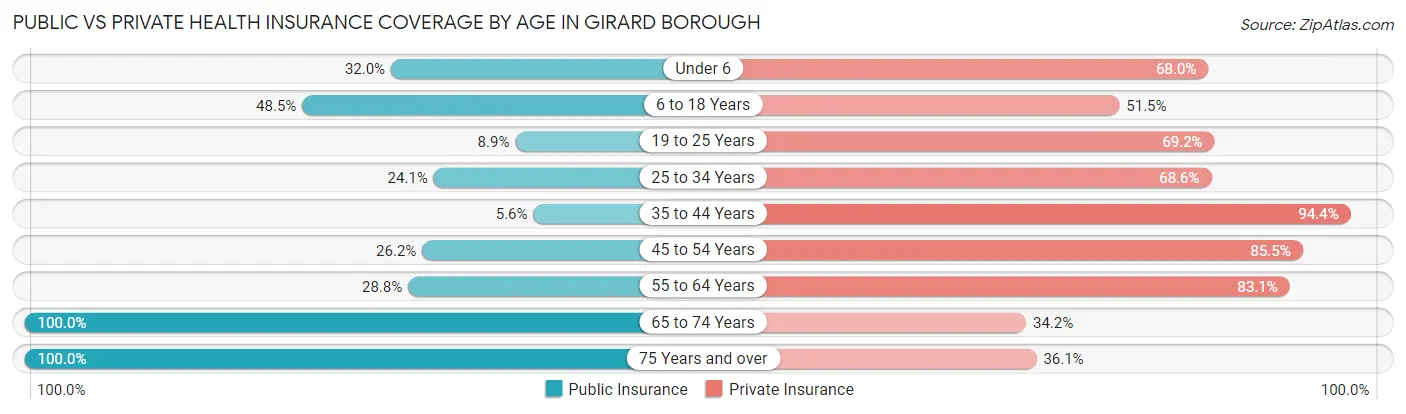
| Age Bracket | Public Insurance | Private Insurance |
| Under 6 | 16 (32.0%) | 34 (68.0%) |
| 6 to 18 Years | 240 (48.5%) | 255 (51.5%) |
| 19 to 25 Years | 31 (8.9%) | 240 (69.2%) |
| 25 to 34 Years | 46 (24.1%) | 131 (68.6%) |
| 35 to 44 Years | 17 (5.6%) | 288 (94.4%) |
| 45 to 54 Years | 114 (26.2%) | 372 (85.5%) |
| 55 to 64 Years | 215 (28.8%) | 620 (83.1%) |
| 65 to 74 Years | 231 (100.0%) | 79 (34.2%) |
| 75 Years and over | 191 (100.0%) | 69 (36.1%) |
| Total | 1,101 (36.8%) | 2,088 (69.8%) |
Disability Status by Sex by Age in Girard borough
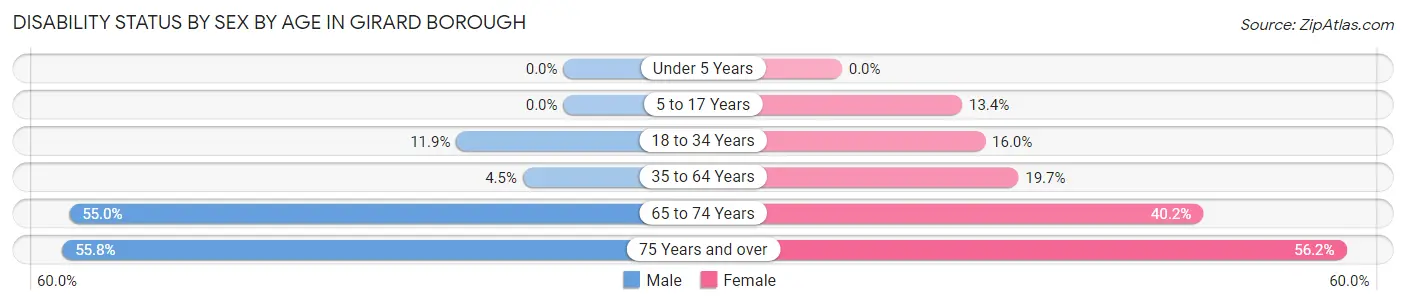
| Age Bracket | Male | Female |
| Under 5 Years | 0 (0.0%) | 0 (0.0%) |
| 5 to 17 Years | 0 (0.0%) | 30 (13.4%) |
| 18 to 34 Years | 34 (11.9%) | 45 (16.0%) |
| 35 to 64 Years | 35 (4.5%) | 140 (19.7%) |
| 65 to 74 Years | 82 (55.0%) | 33 (40.2%) |
| 75 Years and over | 48 (55.8%) | 59 (56.2%) |
Disability Class by Sex by Age in Girard borough
Disability Class: Hearing Difficulty
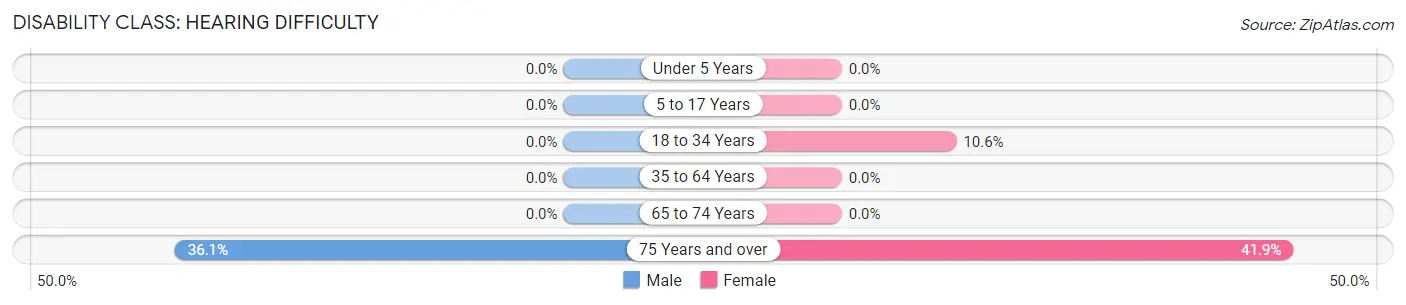
| Age Bracket | Male | Female |
| Under 5 Years | 0 (0.0%) | 0 (0.0%) |
| 5 to 17 Years | 0 (0.0%) | 0 (0.0%) |
| 18 to 34 Years | 0 (0.0%) | 30 (10.6%) |
| 35 to 64 Years | 0 (0.0%) | 0 (0.0%) |
| 65 to 74 Years | 0 (0.0%) | 0 (0.0%) |
| 75 Years and over | 31 (36.0%) | 44 (41.9%) |
Disability Class: Vision Difficulty
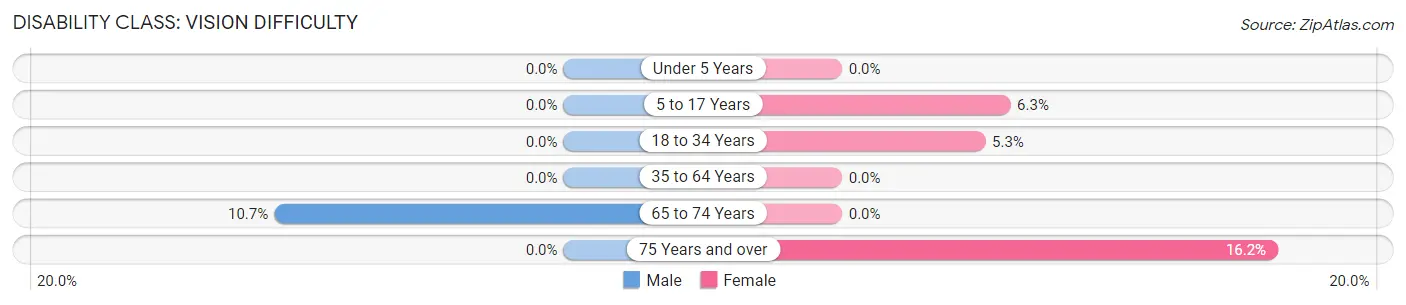
| Age Bracket | Male | Female |
| Under 5 Years | 0 (0.0%) | 0 (0.0%) |
| 5 to 17 Years | 0 (0.0%) | 14 (6.2%) |
| 18 to 34 Years | 0 (0.0%) | 15 (5.3%) |
| 35 to 64 Years | 0 (0.0%) | 0 (0.0%) |
| 65 to 74 Years | 16 (10.7%) | 0 (0.0%) |
| 75 Years and over | 0 (0.0%) | 17 (16.2%) |
Disability Class: Cognitive Difficulty
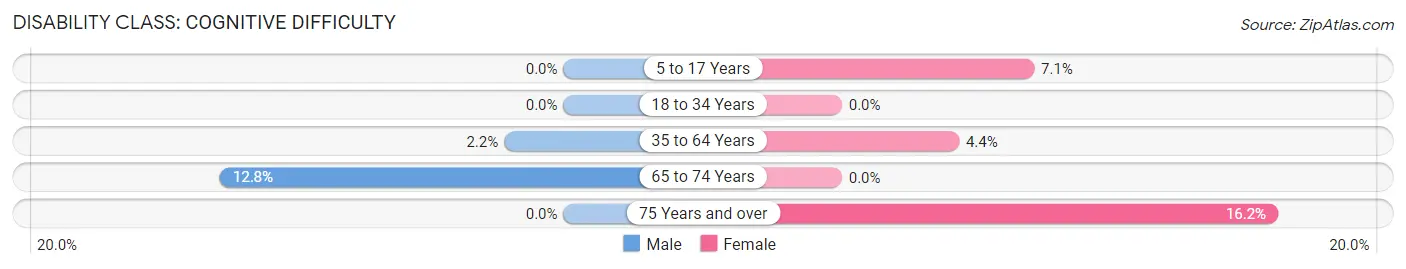
| Age Bracket | Male | Female |
| 5 to 17 Years | 0 (0.0%) | 16 (7.1%) |
| 18 to 34 Years | 0 (0.0%) | 0 (0.0%) |
| 35 to 64 Years | 17 (2.2%) | 31 (4.3%) |
| 65 to 74 Years | 19 (12.8%) | 0 (0.0%) |
| 75 Years and over | 0 (0.0%) | 17 (16.2%) |
Disability Class: Ambulatory Difficulty
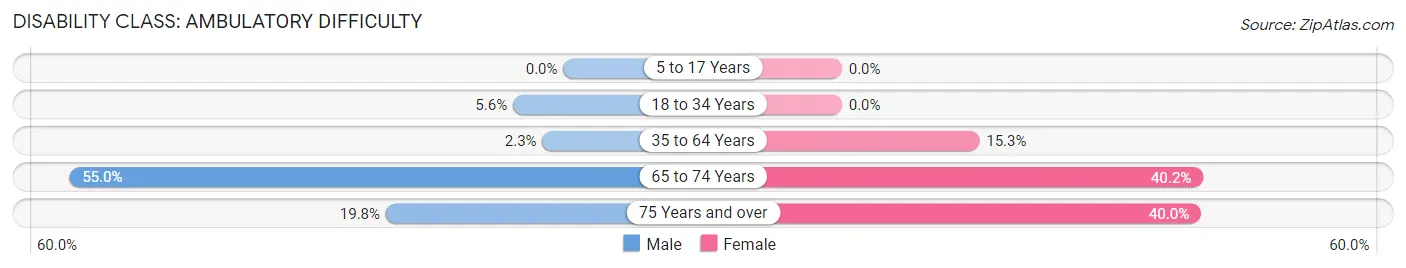
| Age Bracket | Male | Female |
| 5 to 17 Years | 0 (0.0%) | 0 (0.0%) |
| 18 to 34 Years | 16 (5.6%) | 0 (0.0%) |
| 35 to 64 Years | 18 (2.3%) | 109 (15.3%) |
| 65 to 74 Years | 82 (55.0%) | 33 (40.2%) |
| 75 Years and over | 17 (19.8%) | 42 (40.0%) |
Disability Class: Self-Care Difficulty
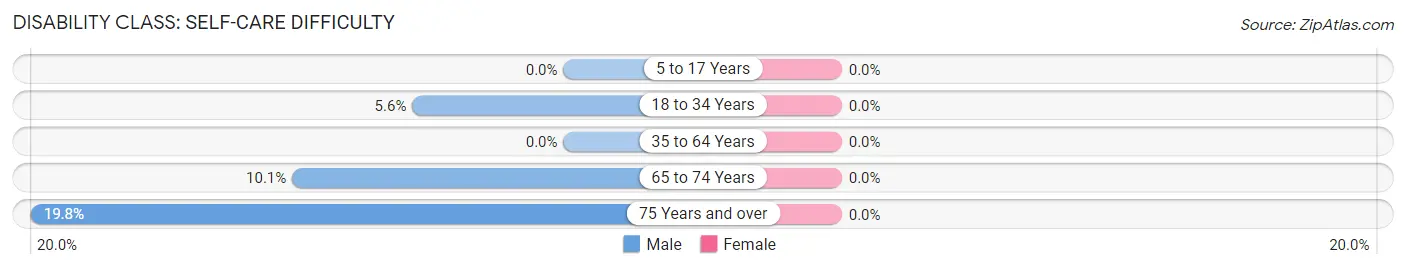
| Age Bracket | Male | Female |
| 5 to 17 Years | 0 (0.0%) | 0 (0.0%) |
| 18 to 34 Years | 16 (5.6%) | 0 (0.0%) |
| 35 to 64 Years | 0 (0.0%) | 0 (0.0%) |
| 65 to 74 Years | 15 (10.1%) | 0 (0.0%) |
| 75 Years and over | 17 (19.8%) | 0 (0.0%) |
Technology Access in Girard borough
Computing Device Access in Girard borough
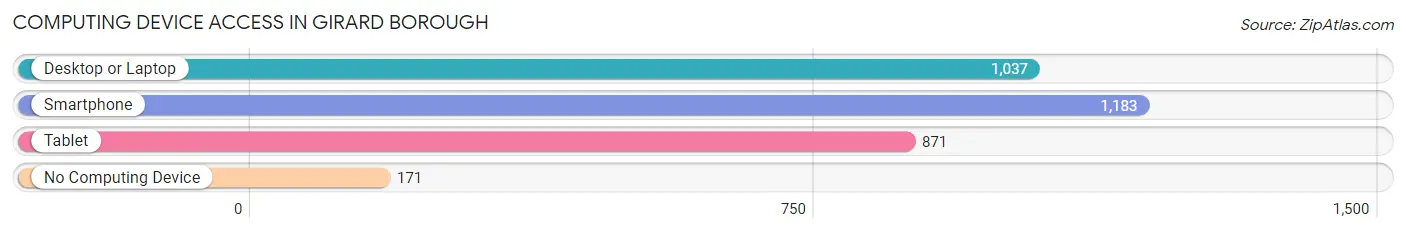
| Device Type | # Households | % Households |
| Desktop or Laptop | 1,037 | 73.0% |
| Smartphone | 1,183 | 83.3% |
| Tablet | 871 | 61.3% |
| No Computing Device | 171 | 12.0% |
| Total | 1,421 | 100.0% |
Internet Access in Girard borough
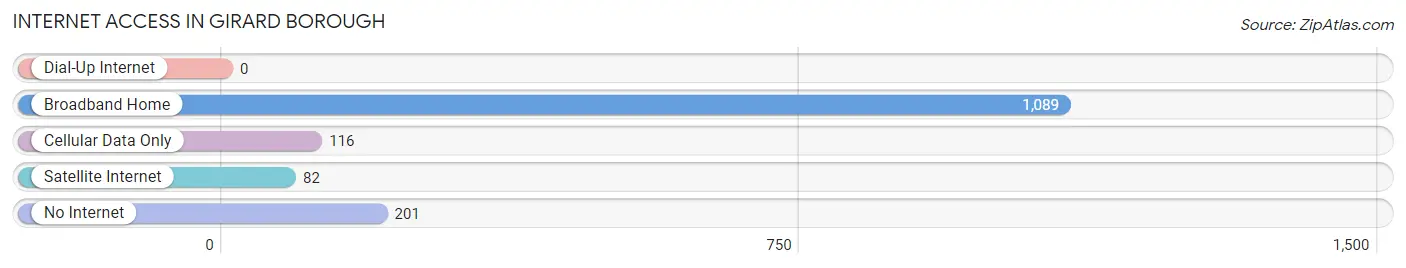
| Internet Type | # Households | % Households |
| Dial-Up Internet | 0 | 0.0% |
| Broadband Home | 1,089 | 76.6% |
| Cellular Data Only | 116 | 8.2% |
| Satellite Internet | 82 | 5.8% |
| No Internet | 201 | 14.1% |
| Total | 1,421 | 100.0% |
Girard borough Summary
Girard Borough is a small borough located in Erie County, Pennsylvania. It is situated in the northwest corner of the county, just south of the city of Erie. The borough is bordered by the townships of Fairview, McKean, and Washington. According to the 2010 census, the population of Girard Borough was 2,743.
Geography
Girard Borough is located at 41°51'N 79°59'W (41.8500, -79.9833). It has a total area of 1.2 square miles, all of which is land. The borough is situated in a hilly area, with the highest elevation being 1,000 feet above sea level. The terrain is mostly wooded, with some open fields. The borough is drained by several small creeks, including the East Branch of Elk Creek, which flows through the center of the borough.
Climate
Girard Borough has a humid continental climate, with cold, snowy winters and warm, humid summers. The average annual temperature is 46°F, with an average high of 68°F in July and an average low of 24°F in January. The average annual precipitation is 37 inches, with an average of 56 inches of snowfall per year.
Demographics
As of the 2010 census, there were 2,743 people, 1,093 households, and 745 families residing in the borough. The population density was 2,269.2 people per square mile. The racial makeup of the borough was 97.2% White, 0.7% African American, 0.2% Native American, 0.4% Asian, 0.1% Pacific Islander, 0.4% from other races, and 1.0% from two or more races. Hispanic or Latino of any race were 1.2% of the population.
There were 1,093 households, out of which 28.7% had children under the age of 18 living with them, 51.2% were married couples living together, 11.7% had a female householder with no husband present, and 32.2% were non-families. 27.2% of all households were made up of individuals, and 12.7% had someone living alone who was 65 years of age or older. The average household size was 2.50 and the average family size was 3.04.
The median age in the borough was 41.2 years. 22.7% of residents were under the age of 18; 7.2% were between the ages of 18 and 24; 24.3% were from 25 to 44; 28.7% were from 45 to 64; and 17.1% were 65 years of age or older. The gender makeup of the borough was 48.2% male and 51.8% female.
Economy
Girard Borough is a small, rural community with a primarily agricultural economy. The main crops grown in the area are corn, soybeans, hay, and wheat. There are also several small businesses in the borough, including a grocery store, a hardware store, and a few restaurants.
The borough is served by the Erie Metropolitan Transit Authority, which provides public transportation to the surrounding area. The nearest airport is the Erie International Airport, located about 15 miles away.
Education
Girard Borough is served by the Girard School District, which consists of two elementary schools, one middle school, and one high school. The district also operates a public library.
Conclusion
Girard Borough is a small, rural community located in Erie County, Pennsylvania. It has a population of 2,743, and is situated in a hilly area with a humid continental climate. The economy is primarily agricultural, with some small businesses in the area. The borough is served by the Girard School District, which provides public education to the area.
Common Questions
What is Per Capita Income in Girard borough?
Per Capita income in Girard borough is $39,521.
What is the Median Family Income in Girard borough?
Median Family Income in Girard borough is $92,813.
What is the Median Household income in Girard borough?
Median Household Income in Girard borough is $66,432.
What is Inequality or Gini Index in Girard borough?
Inequality or Gini Index in Girard borough is 0.38.
What is the Total Population of Girard borough?
Total Population of Girard borough is 2,991.
What is the Total Male Population of Girard borough?
Total Male Population of Girard borough is 1,552.
What is the Total Female Population of Girard borough?
Total Female Population of Girard borough is 1,439.
What is the Ratio of Males per 100 Females in Girard borough?
There are 107.85 Males per 100 Females in Girard borough.
What is the Ratio of Females per 100 Males in Girard borough?
There are 92.72 Females per 100 Males in Girard borough.
What is the Median Population Age in Girard borough?
Median Population Age in Girard borough is 46.2 Years.
What is the Average Family Size in Girard borough
Average Family Size in Girard borough is 2.6 People.
What is the Average Household Size in Girard borough
Average Household Size in Girard borough is 2.1 People.
How Large is the Labor Force in Girard borough?
There are 1,887 People in the Labor Forcein in Girard borough.
What is the Percentage of People in the Labor Force in Girard borough?
69.5% of People are in the Labor Force in Girard borough.
What is the Unemployment Rate in Girard borough?
Unemployment Rate in Girard borough is 5.8%.