New Bedford, PA Map & Demographics
New Bedford Map
New Bedford Overview
$30,788
PER CAPITA INCOME
$74,914
AVG FAMILY INCOME
$72,672
AVG HOUSEHOLD INCOME
47.9%
WAGE / INCOME GAP [ % ]
52.1¢/ $1
WAGE / INCOME GAP [ $ ]
0.34
INEQUALITY / GINI INDEX
875
TOTAL POPULATION
464
MALE POPULATION
411
FEMALE POPULATION
112.90
MALES / 100 FEMALES
88.58
FEMALES / 100 MALES
40.4
MEDIAN AGE
3.2
AVG FAMILY SIZE
2.6
AVG HOUSEHOLD SIZE
377
LABOR FORCE [ PEOPLE ]
57.5%
PERCENT IN LABOR FORCE
New Bedford Zip Codes
New Bedford Area Codes
Income in New Bedford
Income Overview in New Bedford
Per Capita Income in New Bedford is $30,788, while median incomes of families and households are $74,914 and $72,672 respectively.
| Characteristic | Number | Measure |
| Per Capita Income | 875 | $30,788 |
| Median Family Income | 220 | $74,914 |
| Mean Family Income | 220 | $92,542 |
| Median Household Income | 336 | $72,672 |
| Mean Household Income | 336 | $84,081 |
| Income Deficit | 220 | $0 |
| Wage / Income Gap (%) | 875 | 47.93% |
| Wage / Income Gap ($) | 875 | 52.07¢ per $1 |
| Gini / Inequality Index | 875 | 0.34 |
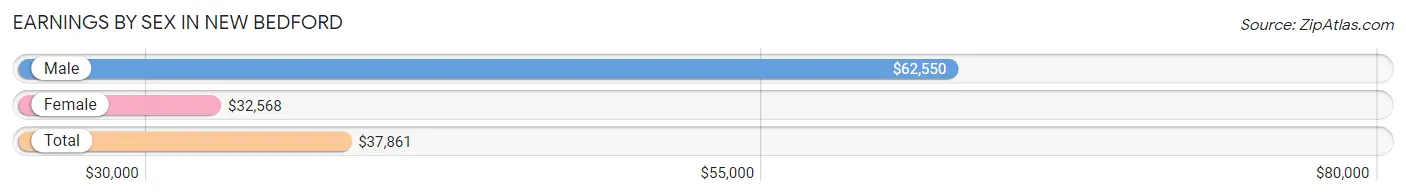
Earnings by Sex in New Bedford
Average Earnings in New Bedford are $37,861, $62,550 for men and $32,568 for women, a difference of 47.9%.
| Sex | Number | Average Earnings |
| Male | 211 (56.0%) | $62,550 |
| Female | 166 (44.0%) | $32,568 |
| Total | 377 (100.0%) | $37,861 |
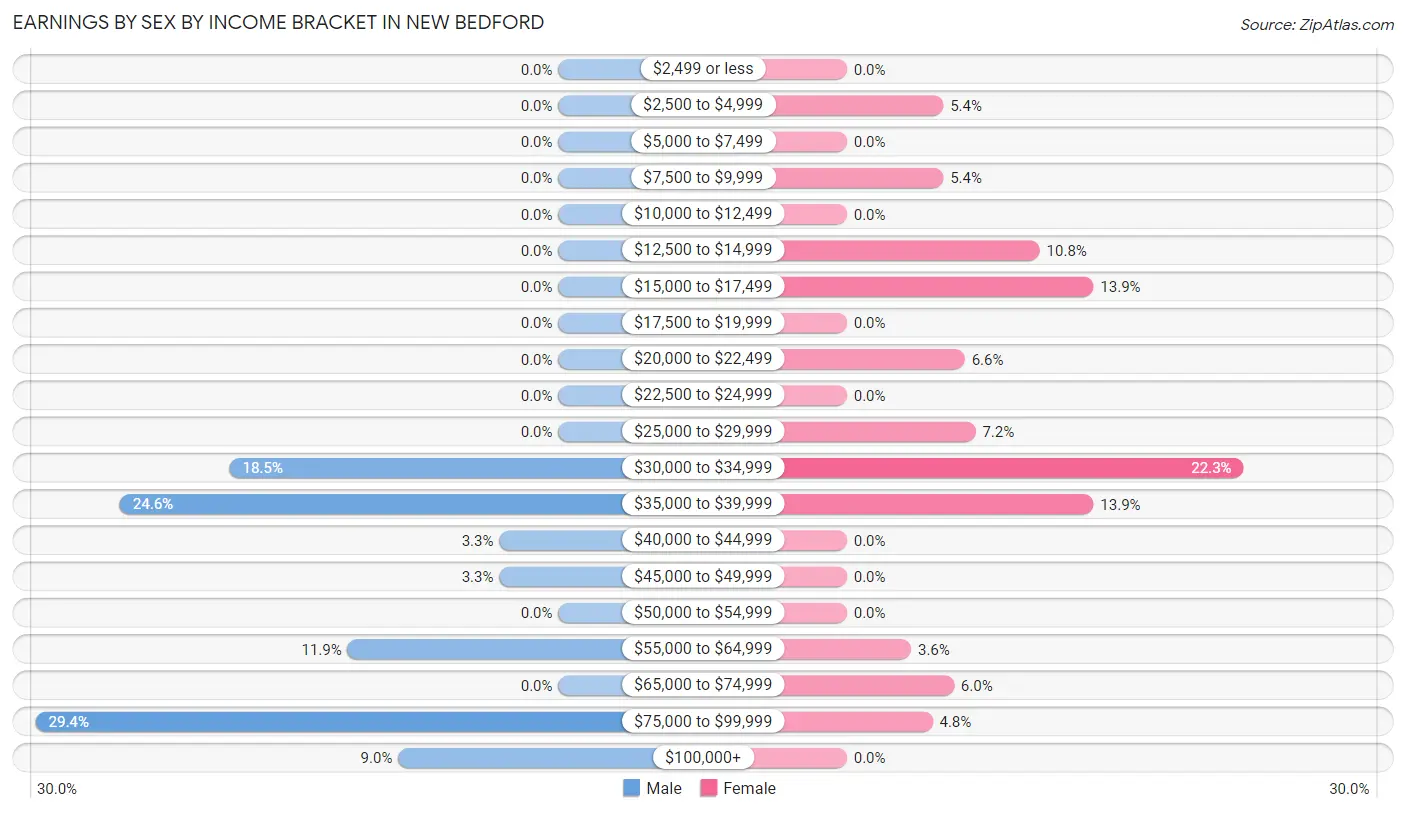
Earnings by Sex by Income Bracket in New Bedford
The most common earnings brackets in New Bedford are $75,000 to $99,999 for men (62 | 29.4%) and $30,000 to $34,999 for women (37 | 22.3%).
| Income | Male | Female |
| $2,499 or less | 0 (0.0%) | 0 (0.0%) |
| $2,500 to $4,999 | 0 (0.0%) | 9 (5.4%) |
| $5,000 to $7,499 | 0 (0.0%) | 0 (0.0%) |
| $7,500 to $9,999 | 0 (0.0%) | 9 (5.4%) |
| $10,000 to $12,499 | 0 (0.0%) | 0 (0.0%) |
| $12,500 to $14,999 | 0 (0.0%) | 18 (10.8%) |
| $15,000 to $17,499 | 0 (0.0%) | 23 (13.9%) |
| $17,500 to $19,999 | 0 (0.0%) | 0 (0.0%) |
| $20,000 to $22,499 | 0 (0.0%) | 11 (6.6%) |
| $22,500 to $24,999 | 0 (0.0%) | 0 (0.0%) |
| $25,000 to $29,999 | 0 (0.0%) | 12 (7.2%) |
| $30,000 to $34,999 | 39 (18.5%) | 37 (22.3%) |
| $35,000 to $39,999 | 52 (24.6%) | 23 (13.9%) |
| $40,000 to $44,999 | 7 (3.3%) | 0 (0.0%) |
| $45,000 to $49,999 | 7 (3.3%) | 0 (0.0%) |
| $50,000 to $54,999 | 0 (0.0%) | 0 (0.0%) |
| $55,000 to $64,999 | 25 (11.8%) | 6 (3.6%) |
| $65,000 to $74,999 | 0 (0.0%) | 10 (6.0%) |
| $75,000 to $99,999 | 62 (29.4%) | 8 (4.8%) |
| $100,000+ | 19 (9.0%) | 0 (0.0%) |
| Total | 211 (100.0%) | 166 (100.0%) |
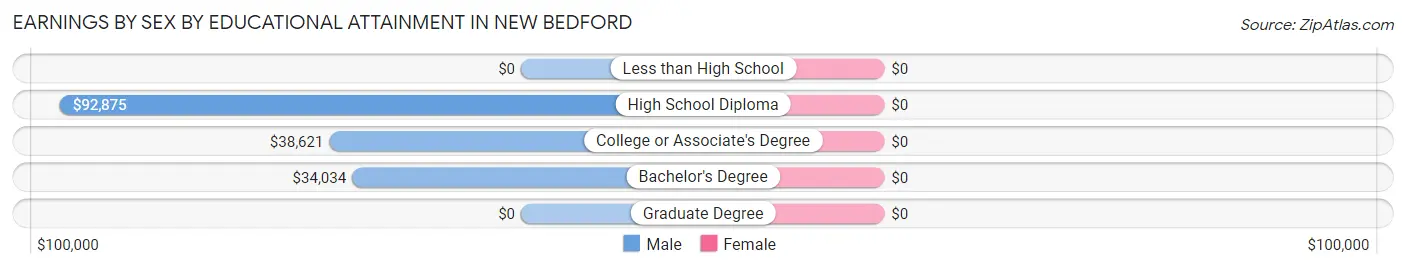
Earnings by Sex by Educational Attainment in New Bedford
| Educational Attainment | Male Income | Female Income |
| Less than High School | - | - |
| High School Diploma | $92,875 | $0 |
| College or Associate's Degree | $38,621 | $0 |
| Bachelor's Degree | $34,034 | $0 |
| Graduate Degree | - | - |
| Total | $43,214 | $32,703 |
Family Income in New Bedford
Family Income Brackets in New Bedford
According to the New Bedford family income data, there are 53 families falling into the $100,000 to $149,999 income range, which is the most common income bracket and makes up 24.1% of all families.
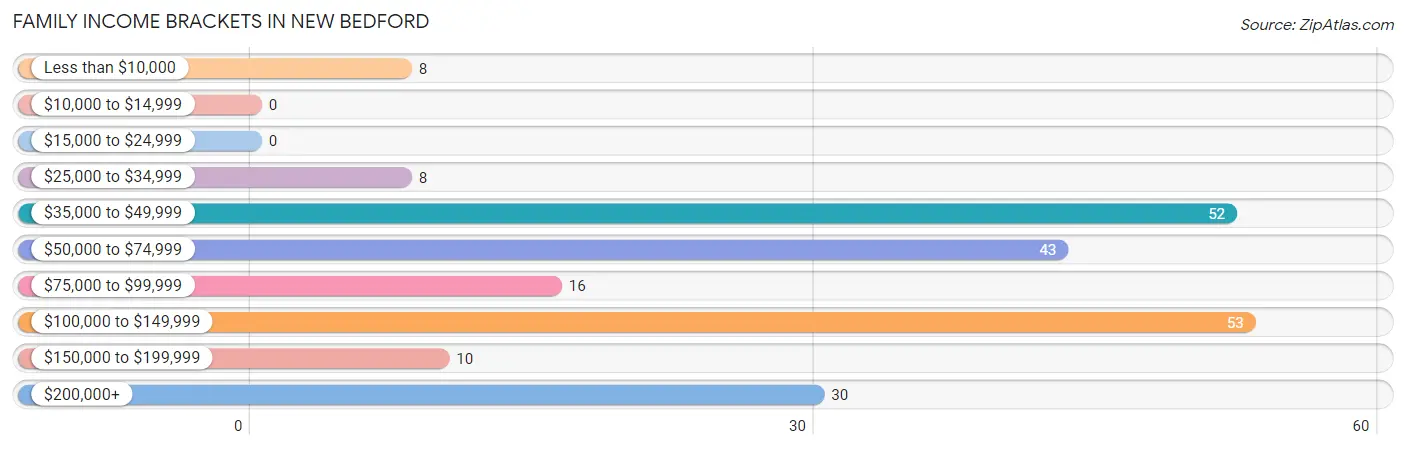
| Income Bracket | # Families | % Families |
| Less than $10,000 | 8 | 3.6% |
| $10,000 to $14,999 | 0 | 0.0% |
| $15,000 to $24,999 | 0 | 0.0% |
| $25,000 to $34,999 | 8 | 3.6% |
| $35,000 to $49,999 | 52 | 23.6% |
| $50,000 to $74,999 | 43 | 19.5% |
| $75,000 to $99,999 | 16 | 7.3% |
| $100,000 to $149,999 | 53 | 24.1% |
| $150,000 to $199,999 | 10 | 4.5% |
| $200,000+ | 30 | 13.6% |
Family Income by Famaliy Size in New Bedford
3-person families (80 | 36.4%) account for the highest median family income in New Bedford with $73,276 per family, while 2-person families (79 | 35.9%) have the highest median income of $28,125 per family member.
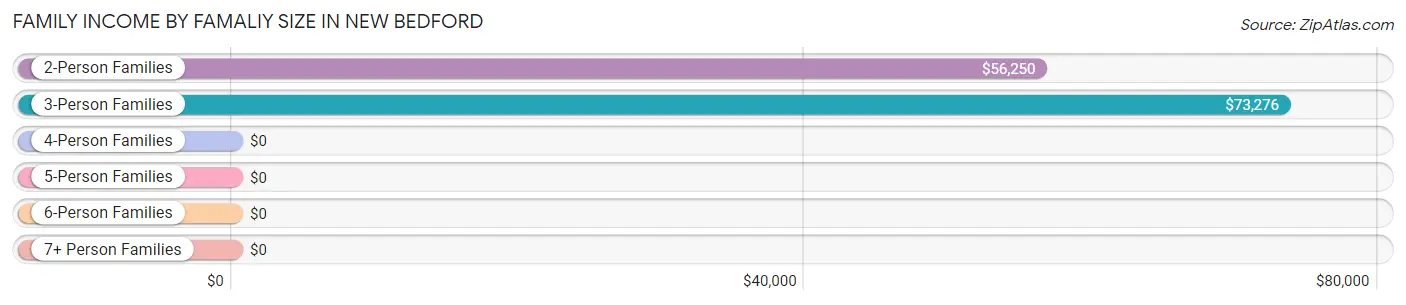
| Income Bracket | # Families | Median Income |
| 2-Person Families | 79 (35.9%) | $56,250 |
| 3-Person Families | 80 (36.4%) | $73,276 |
| 4-Person Families | 20 (9.1%) | $0 |
| 5-Person Families | 0 (0.0%) | $0 |
| 6-Person Families | 41 (18.6%) | $0 |
| 7+ Person Families | 0 (0.0%) | $0 |
| Total | 220 (100.0%) | $74,914 |
Family Income by Number of Earners in New Bedford
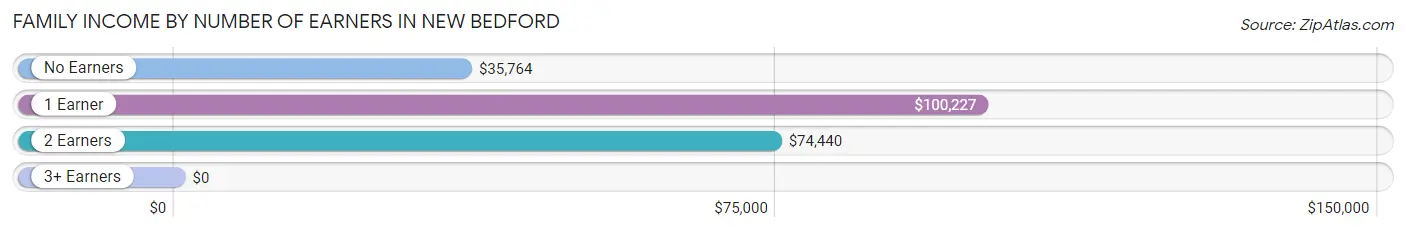
| Number of Earners | # Families | Median Income |
| No Earners | 43 (19.6%) | $35,764 |
| 1 Earner | 104 (47.3%) | $100,227 |
| 2 Earners | 45 (20.4%) | $74,440 |
| 3+ Earners | 28 (12.7%) | $0 |
| Total | 220 (100.0%) | $74,914 |
Household Income in New Bedford
Household Income Brackets in New Bedford
With 93 households falling in the category, the $50,000 to $74,999 income range is the most frequent in New Bedford, accounting for 27.7% of all households.
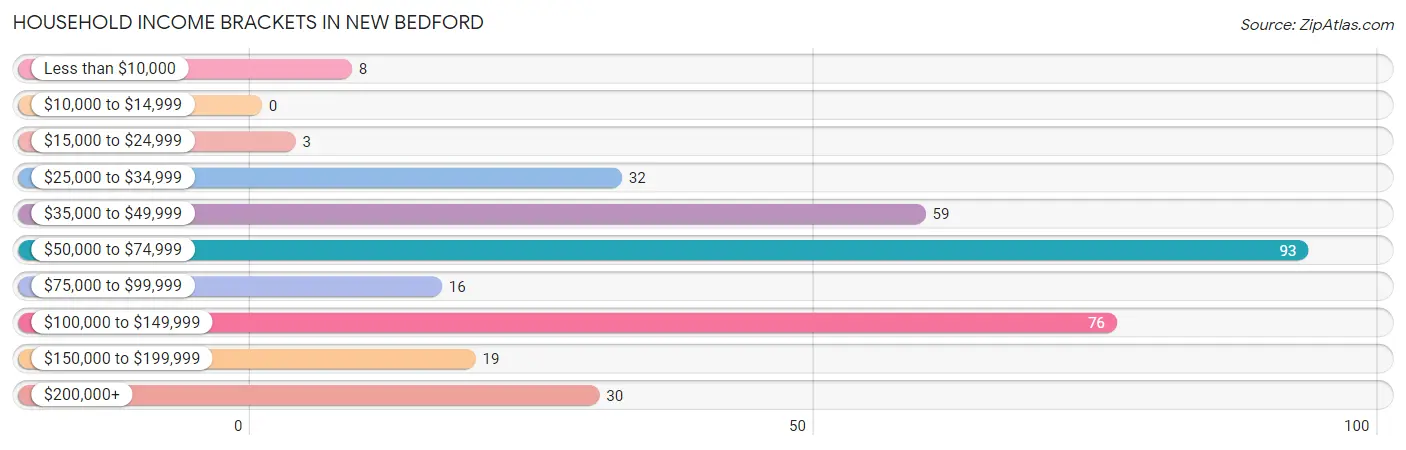
| Income Bracket | # Households | % Households |
| Less than $10,000 | 8 | 2.4% |
| $10,000 to $14,999 | 0 | 0.0% |
| $15,000 to $24,999 | 3 | 0.9% |
| $25,000 to $34,999 | 32 | 9.5% |
| $35,000 to $49,999 | 59 | 17.6% |
| $50,000 to $74,999 | 93 | 27.7% |
| $75,000 to $99,999 | 16 | 4.8% |
| $100,000 to $149,999 | 76 | 22.6% |
| $150,000 to $199,999 | 19 | 5.7% |
| $200,000+ | 30 | 8.9% |
Household Income by Householder Age in New Bedford
The median household income in New Bedford is $72,672, with the highest median household income of $87,875 found in the 45 to 64 years age bracket for the primary householder. A total of 109 households (32.4%) fall into this category. Meanwhile, the 15 to 24 years age bracket for the primary householder has the lowest median household income of $0, with 23 households (6.9%) in this group.
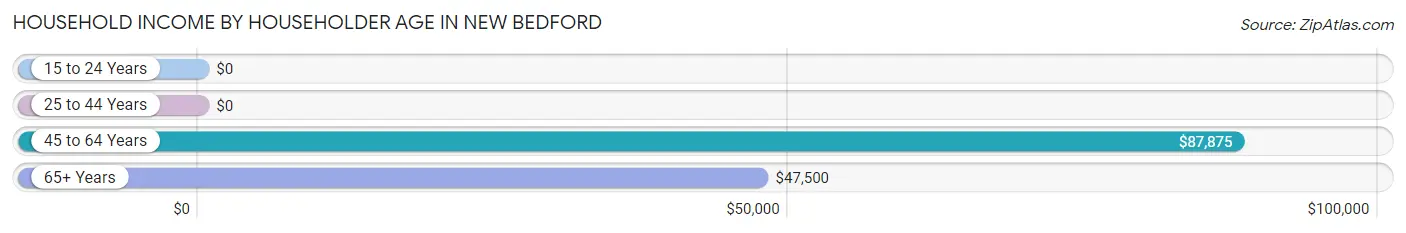
| Income Bracket | # Households | Median Income |
| 15 to 24 Years | 23 (6.9%) | $0 |
| 25 to 44 Years | 56 (16.7%) | $0 |
| 45 to 64 Years | 109 (32.4%) | $87,875 |
| 65+ Years | 148 (44.1%) | $47,500 |
| Total | 336 (100.0%) | $72,672 |
Poverty in New Bedford
Income Below Poverty by Sex and Age in New Bedford
With 3.5% poverty level for males and 1.9% for females among the residents of New Bedford, 5 year old males and 45 to 54 year old females are the most vulnerable to poverty, with 8 males (100.0%) and 8 females (16.3%) in their respective age groups living below the poverty level.
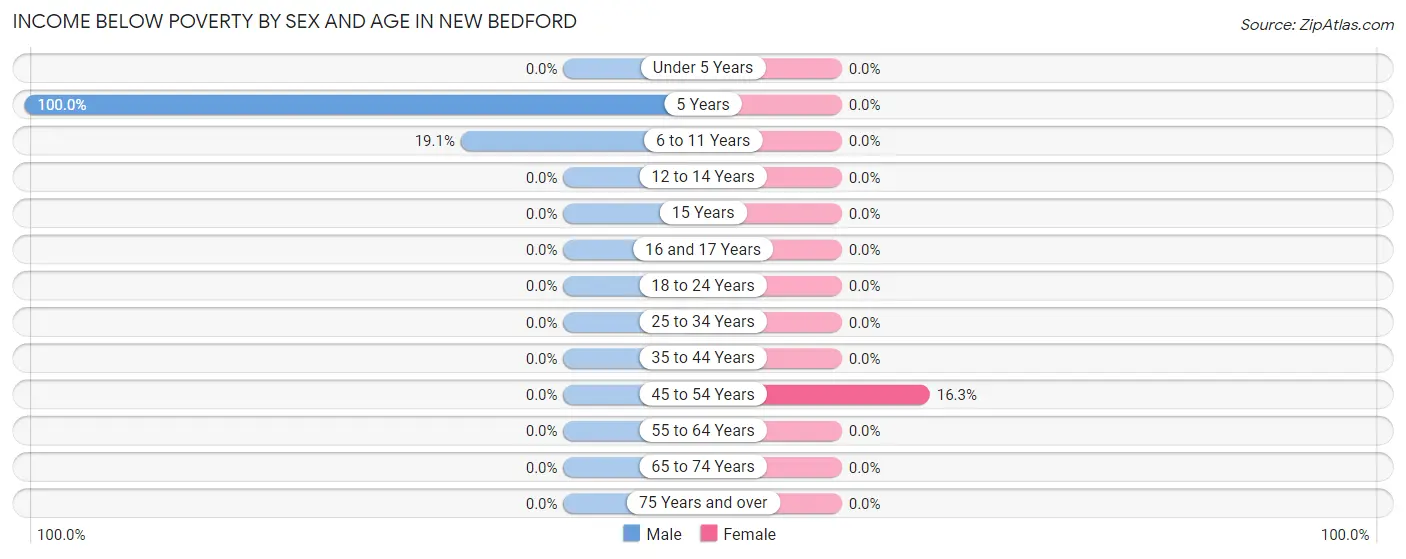
| Age Bracket | Male | Female |
| Under 5 Years | 0 (0.0%) | 0 (0.0%) |
| 5 Years | 8 (100.0%) | 0 (0.0%) |
| 6 to 11 Years | 8 (19.1%) | 0 (0.0%) |
| 12 to 14 Years | 0 (0.0%) | 0 (0.0%) |
| 15 Years | 0 (0.0%) | 0 (0.0%) |
| 16 and 17 Years | 0 (0.0%) | 0 (0.0%) |
| 18 to 24 Years | 0 (0.0%) | 0 (0.0%) |
| 25 to 34 Years | 0 (0.0%) | 0 (0.0%) |
| 35 to 44 Years | 0 (0.0%) | 0 (0.0%) |
| 45 to 54 Years | 0 (0.0%) | 8 (16.3%) |
| 55 to 64 Years | 0 (0.0%) | 0 (0.0%) |
| 65 to 74 Years | 0 (0.0%) | 0 (0.0%) |
| 75 Years and over | 0 (0.0%) | 0 (0.0%) |
| Total | 16 (3.5%) | 8 (1.9%) |
Income Above Poverty by Sex and Age in New Bedford
According to the poverty statistics in New Bedford, males aged under 5 years and females aged under 5 years are the age groups that are most secure financially, with 100.0% of males and 100.0% of females in these age groups living above the poverty line.
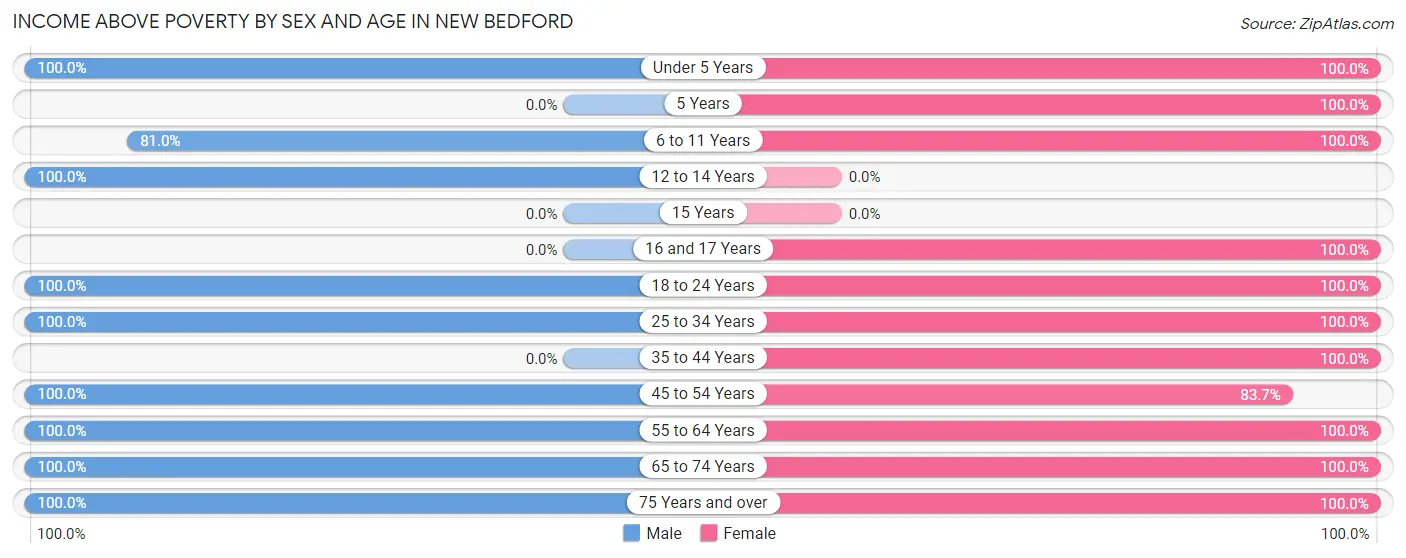
| Age Bracket | Male | Female |
| Under 5 Years | 58 (100.0%) | 25 (100.0%) |
| 5 Years | 0 (0.0%) | 20 (100.0%) |
| 6 to 11 Years | 34 (80.9%) | 43 (100.0%) |
| 12 to 14 Years | 23 (100.0%) | 0 (0.0%) |
| 15 Years | 0 (0.0%) | 0 (0.0%) |
| 16 and 17 Years | 0 (0.0%) | 7 (100.0%) |
| 18 to 24 Years | 25 (100.0%) | 43 (100.0%) |
| 25 to 34 Years | 67 (100.0%) | 34 (100.0%) |
| 35 to 44 Years | 0 (0.0%) | 59 (100.0%) |
| 45 to 54 Years | 77 (100.0%) | 41 (83.7%) |
| 55 to 64 Years | 48 (100.0%) | 37 (100.0%) |
| 65 to 74 Years | 37 (100.0%) | 39 (100.0%) |
| 75 Years and over | 79 (100.0%) | 55 (100.0%) |
| Total | 448 (96.6%) | 403 (98.1%) |
Income Below Poverty Among Married-Couple Families in New Bedford
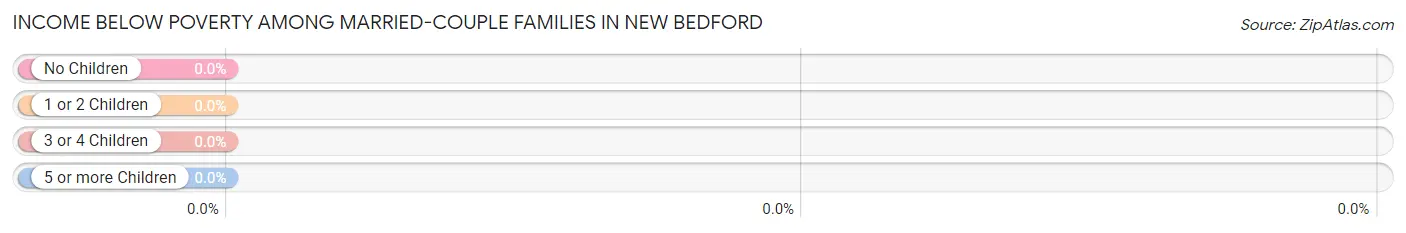
| Children | Above Poverty | Below Poverty |
| No Children | 127 (100.0%) | 0 (0.0%) |
| 1 or 2 Children | 29 (100.0%) | 0 (0.0%) |
| 3 or 4 Children | 33 (100.0%) | 0 (0.0%) |
| 5 or more Children | 0 (0.0%) | 0 (0.0%) |
| Total | 189 (100.0%) | 0 (0.0%) |
Income Below Poverty Among Single-Parent Households in New Bedford
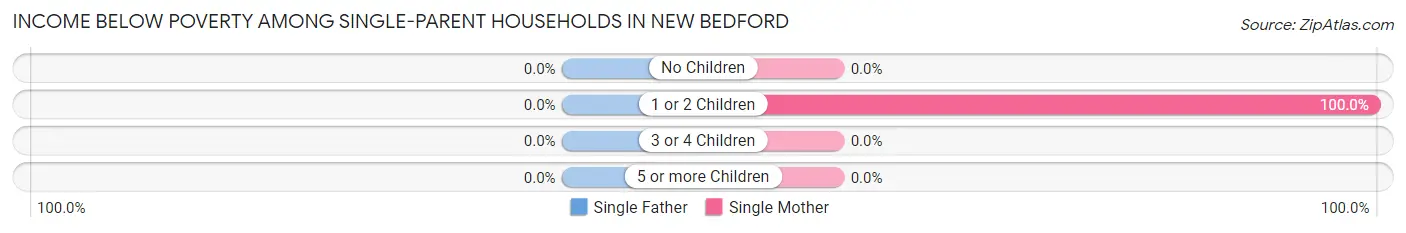
| Children | Single Father | Single Mother |
| No Children | 0 (0.0%) | 0 (0.0%) |
| 1 or 2 Children | 0 (0.0%) | 8 (100.0%) |
| 3 or 4 Children | 0 (0.0%) | 0 (0.0%) |
| 5 or more Children | 0 (0.0%) | 0 (0.0%) |
| Total | 0 (0.0%) | 8 (100.0%) |
Income Below Poverty Among Married-Couple vs Single-Parent Households in New Bedford
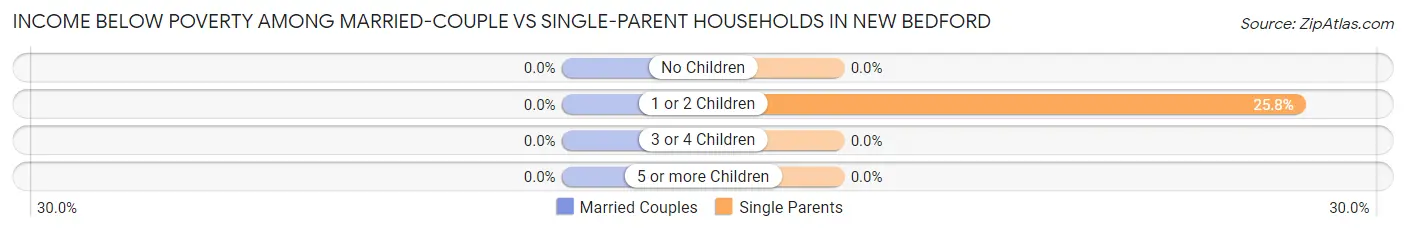
| Children | Married-Couple Families | Single-Parent Households |
| No Children | 0 (0.0%) | 0 (0.0%) |
| 1 or 2 Children | 0 (0.0%) | 8 (25.8%) |
| 3 or 4 Children | 0 (0.0%) | 0 (0.0%) |
| 5 or more Children | 0 (0.0%) | 0 (0.0%) |
| Total | 0 (0.0%) | 8 (25.8%) |
Race in New Bedford
The most populous races in New Bedford are White / Caucasian (873 | 99.8%), Hispanic or Latino (9 | 1.0%), and Two or more Races (2 | 0.2%).
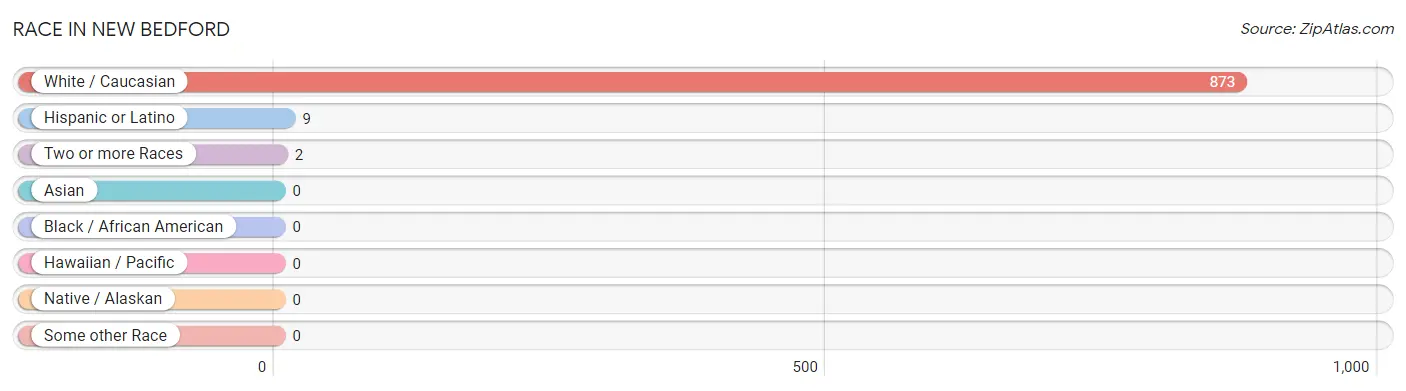
| Race | # Population | % Population |
| Asian | 0 | 0.0% |
| Black / African American | 0 | 0.0% |
| Hawaiian / Pacific | 0 | 0.0% |
| Hispanic or Latino | 9 | 1.0% |
| Native / Alaskan | 0 | 0.0% |
| White / Caucasian | 873 | 99.8% |
| Two or more Races | 2 | 0.2% |
| Some other Race | 0 | 0.0% |
| Total | 875 | 100.0% |
Ancestry in New Bedford
The most populous ancestries reported in New Bedford are German (327 | 37.4%), Irish (167 | 19.1%), Italian (134 | 15.3%), English (80 | 9.1%), and Polish (75 | 8.6%), together accounting for 89.5% of all New Bedford residents.
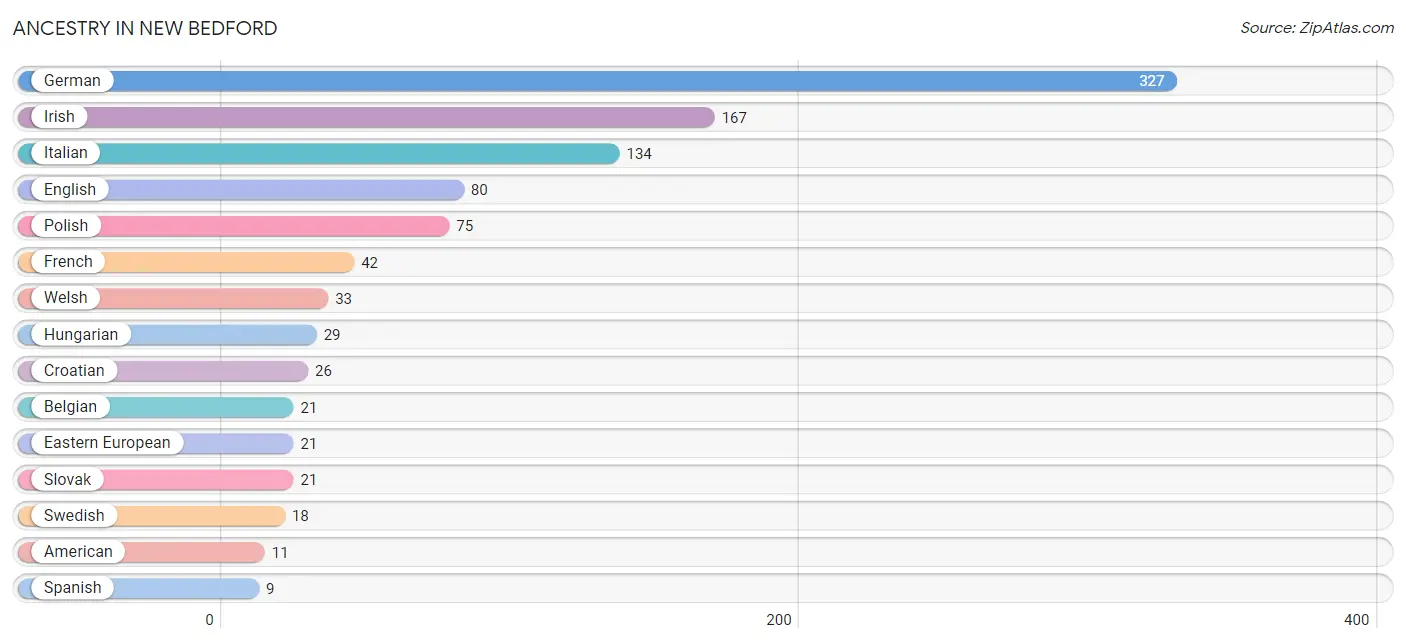
| Ancestry | # Population | % Population |
| American | 11 | 1.3% |
| Arab | 2 | 0.2% |
| Belgian | 21 | 2.4% |
| Croatian | 26 | 3.0% |
| Eastern European | 21 | 2.4% |
| English | 80 | 9.1% |
| French | 42 | 4.8% |
| German | 327 | 37.4% |
| Hungarian | 29 | 3.3% |
| Irish | 167 | 19.1% |
| Italian | 134 | 15.3% |
| Lebanese | 2 | 0.2% |
| Polish | 75 | 8.6% |
| Scotch-Irish | 3 | 0.3% |
| Serbian | 3 | 0.3% |
| Slovak | 21 | 2.4% |
| Spanish | 9 | 1.0% |
| Swedish | 18 | 2.1% |
| Welsh | 33 | 3.8% | View All 19 Rows |
Immigrants in New Bedford

| Immigration Origin | # Population | % Population | View All 0 Rows |
Sex and Age in New Bedford
Sex and Age in New Bedford
The most populous age groups in New Bedford are Under 5 Years (58 | 12.5%) for men and 50 to 54 Years (49 | 11.9%) for women.
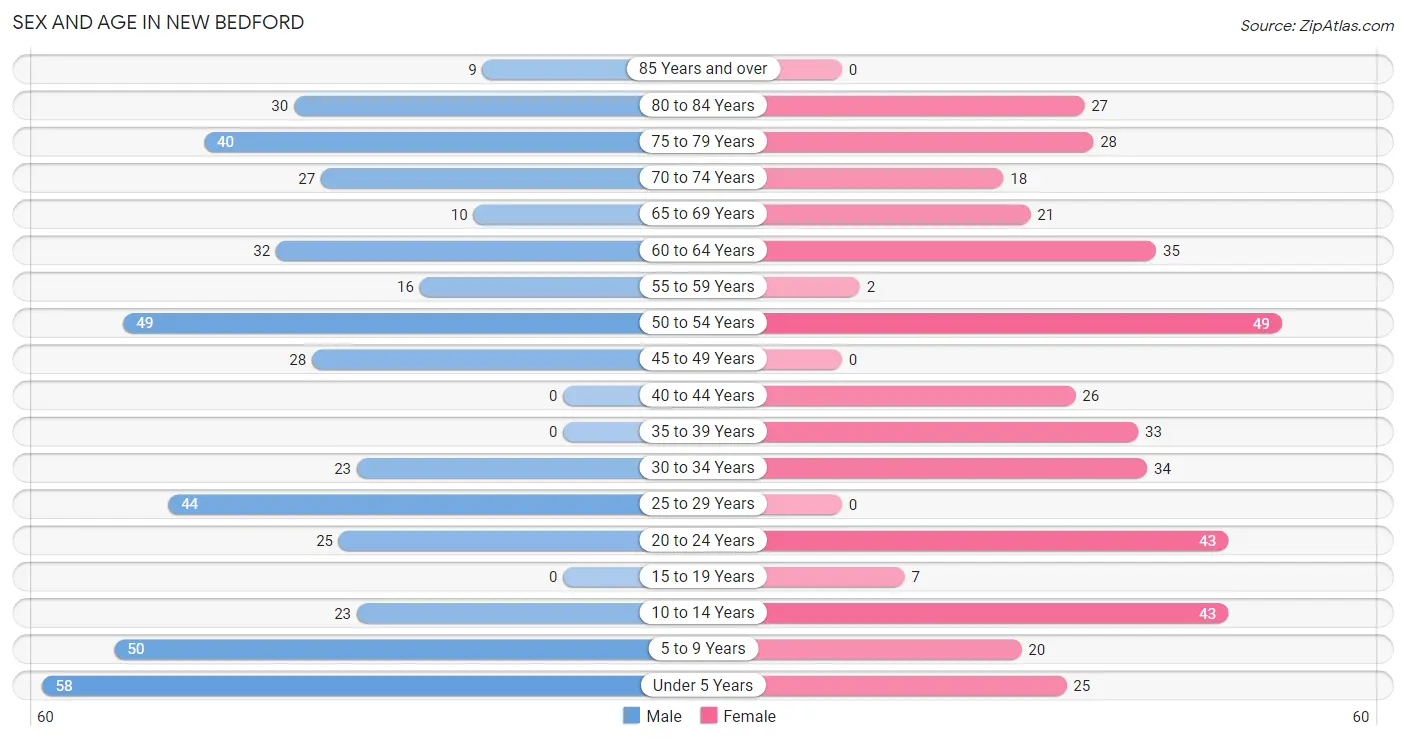
| Age Bracket | Male | Female |
| Under 5 Years | 58 (12.5%) | 25 (6.1%) |
| 5 to 9 Years | 50 (10.8%) | 20 (4.9%) |
| 10 to 14 Years | 23 (5.0%) | 43 (10.5%) |
| 15 to 19 Years | 0 (0.0%) | 7 (1.7%) |
| 20 to 24 Years | 25 (5.4%) | 43 (10.5%) |
| 25 to 29 Years | 44 (9.5%) | 0 (0.0%) |
| 30 to 34 Years | 23 (5.0%) | 34 (8.3%) |
| 35 to 39 Years | 0 (0.0%) | 33 (8.0%) |
| 40 to 44 Years | 0 (0.0%) | 26 (6.3%) |
| 45 to 49 Years | 28 (6.0%) | 0 (0.0%) |
| 50 to 54 Years | 49 (10.6%) | 49 (11.9%) |
| 55 to 59 Years | 16 (3.5%) | 2 (0.5%) |
| 60 to 64 Years | 32 (6.9%) | 35 (8.5%) |
| 65 to 69 Years | 10 (2.2%) | 21 (5.1%) |
| 70 to 74 Years | 27 (5.8%) | 18 (4.4%) |
| 75 to 79 Years | 40 (8.6%) | 28 (6.8%) |
| 80 to 84 Years | 30 (6.5%) | 27 (6.6%) |
| 85 Years and over | 9 (1.9%) | 0 (0.0%) |
| Total | 464 (100.0%) | 411 (100.0%) |
Families and Households in New Bedford
Median Family Size in New Bedford
The median family size in New Bedford is 3.20 persons per family, with married-couple families (189 | 85.9%) accounting for the largest median family size of 3.24 persons per family. On the other hand, single male/father families (23 | 10.4%) represent the smallest median family size with 2.96 persons per family.
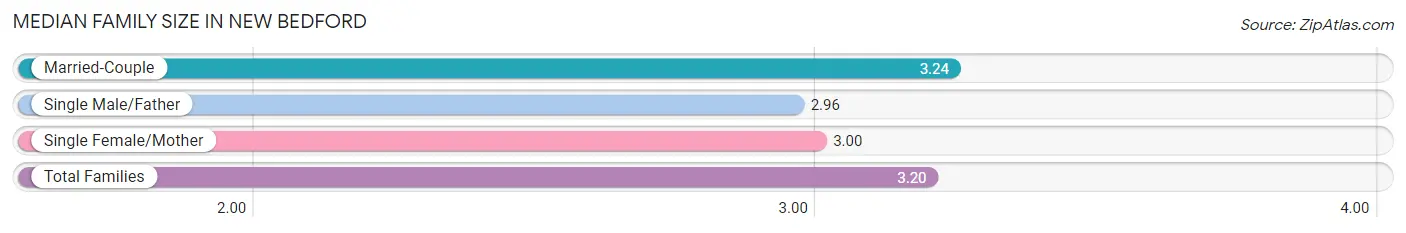
| Family Type | # Families | Family Size |
| Married-Couple | 189 (85.9%) | 3.24 |
| Single Male/Father | 23 (10.4%) | 2.96 |
| Single Female/Mother | 8 (3.6%) | 3.00 |
| Total Families | 220 (100.0%) | 3.20 |
Median Household Size in New Bedford
The median household size in New Bedford is 2.60 persons per household, with single male/father households (23 | 6.9%) accounting for the largest median household size of 3.96 persons per household. non-family households (116 | 34.5%) represent the smallest median household size with 1.28 persons per household.
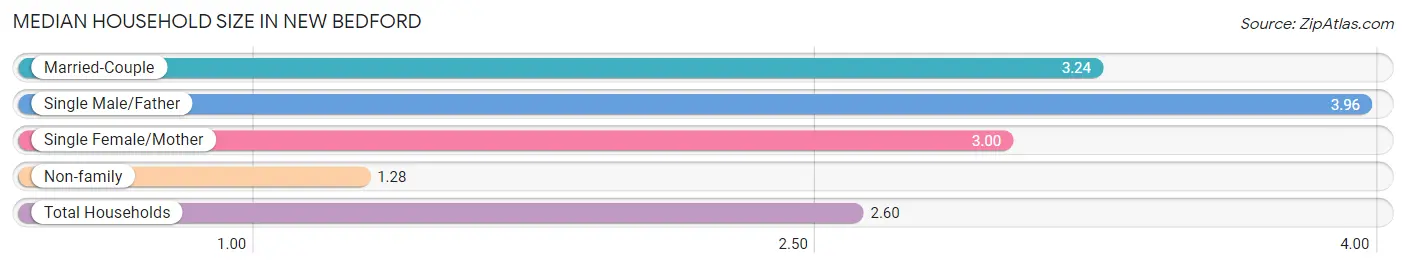
| Household Type | # Households | Household Size |
| Married-Couple | 189 (56.2%) | 3.24 |
| Single Male/Father | 23 (6.9%) | 3.96 |
| Single Female/Mother | 8 (2.4%) | 3.00 |
| Non-family | 116 (34.5%) | 1.28 |
| Total Households | 336 (100.0%) | 2.60 |
Household Size by Marriage Status in New Bedford
Out of a total of 336 households in New Bedford, 220 (65.5%) are family households, while 116 (34.5%) are nonfamily households. The most numerous type of family households are 2-person households, comprising 79, and the most common type of nonfamily households are 1-person households, comprising 90.
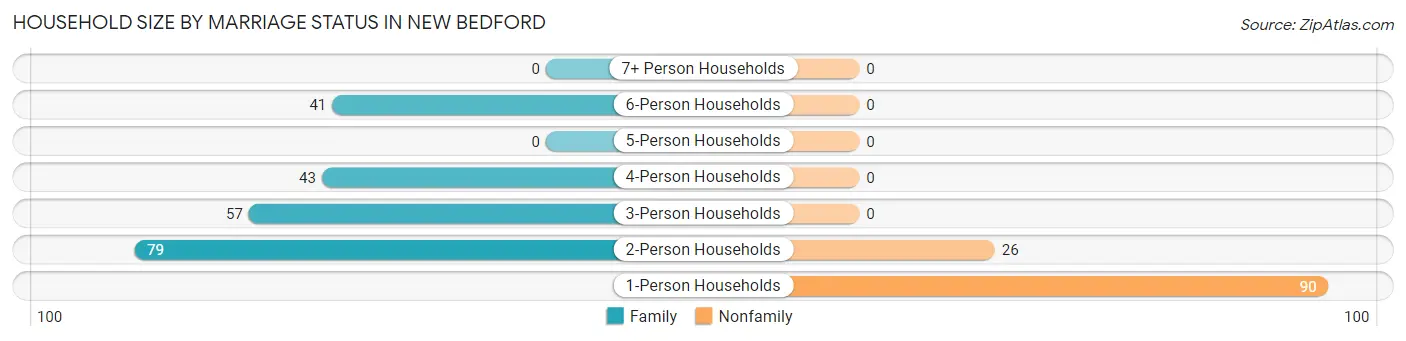
| Household Size | Family Households | Nonfamily Households |
| 1-Person Households | - | 90 (26.8%) |
| 2-Person Households | 79 (23.5%) | 26 (7.7%) |
| 3-Person Households | 57 (17.0%) | 0 (0.0%) |
| 4-Person Households | 43 (12.8%) | 0 (0.0%) |
| 5-Person Households | 0 (0.0%) | 0 (0.0%) |
| 6-Person Households | 41 (12.2%) | 0 (0.0%) |
| 7+ Person Households | 0 (0.0%) | 0 (0.0%) |
| Total | 220 (65.5%) | 116 (34.5%) |
Female Fertility in New Bedford
Fertility by Age in New Bedford
| Age Bracket | Women with Births | Births / 1,000 Women |
| 15 to 19 years | 0 (0.0%) | 0.0 |
| 20 to 34 years | 0 (0.0%) | 0.0 |
| 35 to 50 years | 0 (0.0%) | 0.0 |
| Total | 0 (0.0%) | 0.0 |
Fertility by Age by Marriage Status in New Bedford
| Age Bracket | Married | Unmarried |
| 15 to 19 years | 0 (0.0%) | 0 (0.0%) |
| 20 to 34 years | 0 (0.0%) | 0 (0.0%) |
| 35 to 50 years | 0 (0.0%) | 0 (0.0%) |
| Total | 0 (0.0%) | 0 (0.0%) |
Fertility by Education in New Bedford
| Educational Attainment | Women with Births | Births / 1,000 Women |
| Less than High School | 0 (0.0%) | 0.0 |
| High School Diploma | 0 (0.0%) | 0.0 |
| College or Associate's Degree | 0 (0.0%) | 0.0 |
| Bachelor's Degree | 0 (0.0%) | 0.0 |
| Graduate Degree | 0 (0.0%) | 0.0 |
| Total | 0 (0.0%) | 0.0 |
Fertility by Education by Marriage Status in New Bedford
| Educational Attainment | Married | Unmarried |
| Less than High School | 0 (0.0%) | 0 (0.0%) |
| High School Diploma | 0 (0.0%) | 0 (0.0%) |
| College or Associate's Degree | 0 (0.0%) | 0 (0.0%) |
| Bachelor's Degree | 0 (0.0%) | 0 (0.0%) |
| Graduate Degree | 0 (0.0%) | 0 (0.0%) |
| Total | 0 (0.0%) | 0 (0.0%) |
Employment Characteristics in New Bedford
Employment by Class of Employer in New Bedford
Among the 377 employed individuals in New Bedford, private company employees (207 | 54.9%), local government employees (73 | 19.4%), and state government employees (46 | 12.2%) make up the most common classes of employment.
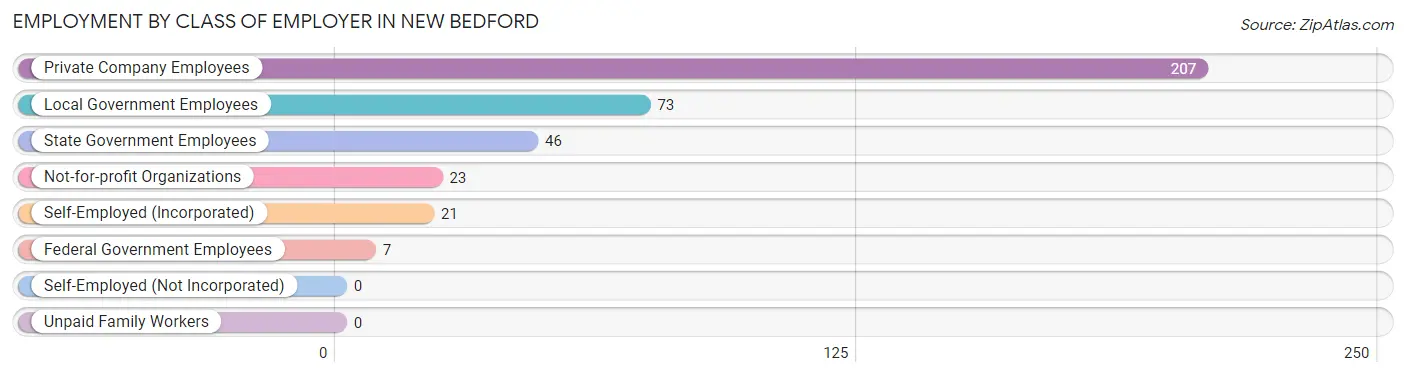
| Employer Class | # Employees | % Employees |
| Private Company Employees | 207 | 54.9% |
| Self-Employed (Incorporated) | 21 | 5.6% |
| Self-Employed (Not Incorporated) | 0 | 0.0% |
| Not-for-profit Organizations | 23 | 6.1% |
| Local Government Employees | 73 | 19.4% |
| State Government Employees | 46 | 12.2% |
| Federal Government Employees | 7 | 1.9% |
| Unpaid Family Workers | 0 | 0.0% |
| Total | 377 | 100.0% |
Employment Status by Age in New Bedford
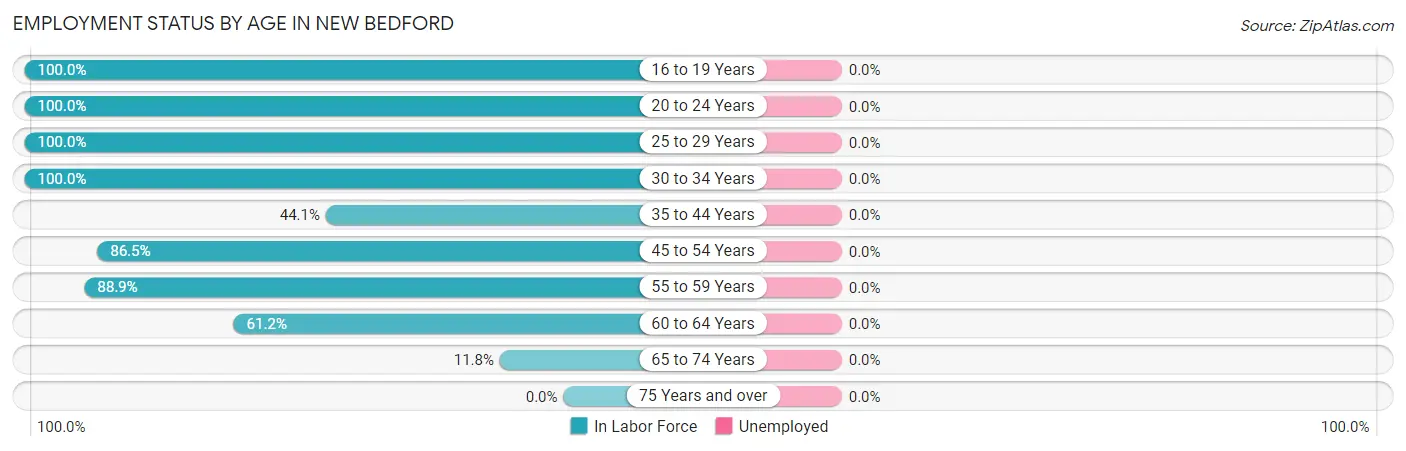
| Age Bracket | In Labor Force | Unemployed |
| 16 to 19 Years | 7 (100.0%) | 0 (0.0%) |
| 20 to 24 Years | 68 (100.0%) | 0 (0.0%) |
| 25 to 29 Years | 44 (100.0%) | 0 (0.0%) |
| 30 to 34 Years | 57 (100.0%) | 0 (0.0%) |
| 35 to 44 Years | 26 (44.1%) | 0 (0.0%) |
| 45 to 54 Years | 109 (86.5%) | 0 (0.0%) |
| 55 to 59 Years | 16 (88.9%) | 0 (0.0%) |
| 60 to 64 Years | 41 (61.2%) | 0 (0.0%) |
| 65 to 74 Years | 9 (11.8%) | 0 (0.0%) |
| 75 Years and over | 0 (0.0%) | 0 (0.0%) |
| Total | 377 (57.5%) | 0 (0.0%) |
Employment Status by Educational Attainment in New Bedford
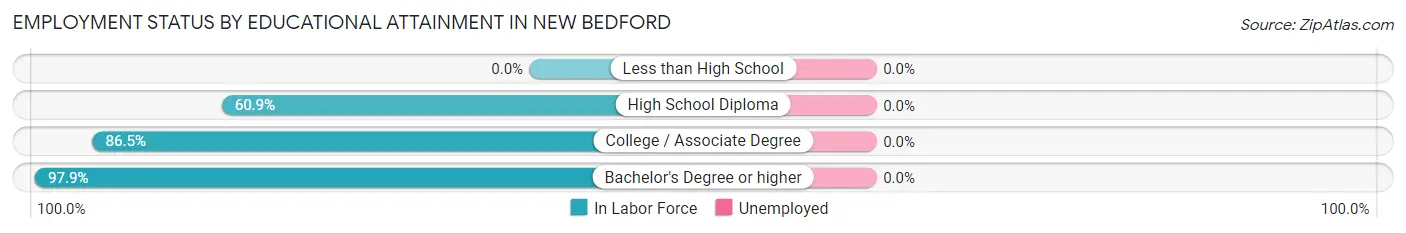
| Educational Attainment | In Labor Force | Unemployed |
| Less than High School | 0 (0.0%) | 0 (0.0%) |
| High School Diploma | 92 (60.9%) | 0 (0.0%) |
| College / Associate Degree | 109 (86.5%) | 0 (0.0%) |
| Bachelor's Degree or higher | 92 (97.9%) | 0 (0.0%) |
| Total | 293 (79.0%) | 0 (0.0%) |
Employment Occupations by Sex in New Bedford
Management, Business, Science and Arts Occupations
The most common Management, Business, Science and Arts occupations in New Bedford are Community & Social Service (48 | 12.7%), Health Diagnosing & Treating (32 | 8.5%), Business & Financial (22 | 5.8%), Arts, Media & Entertainment (22 | 5.8%), and Education Instruction & Library (18 | 4.8%).
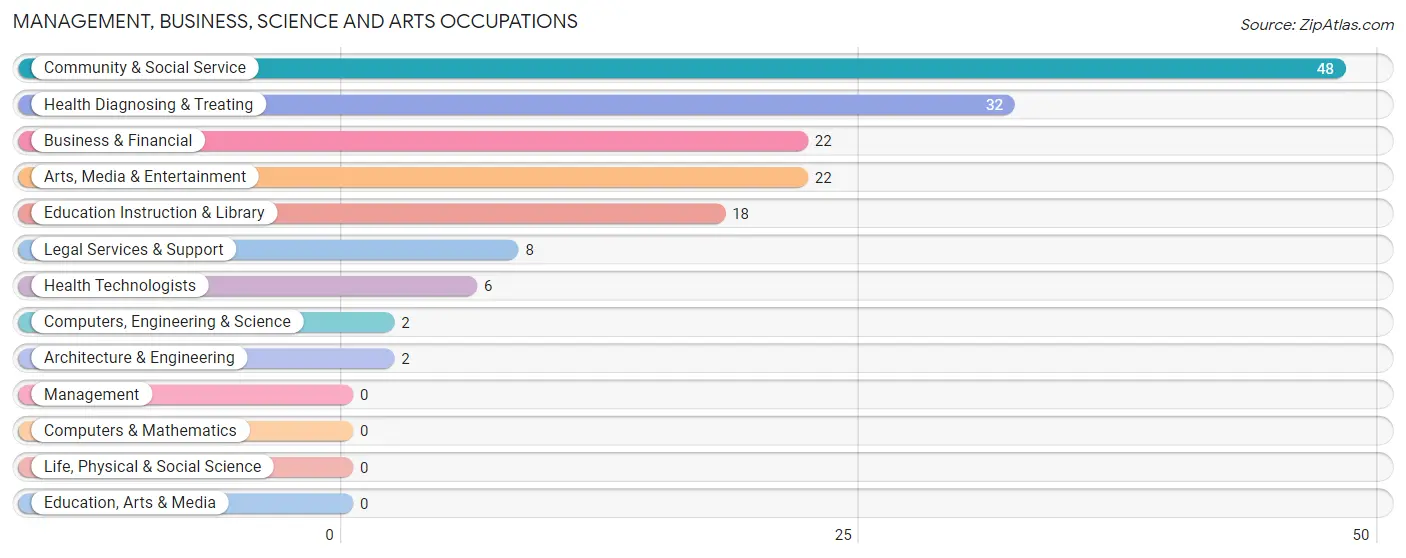
Management, Business, Science and Arts Occupations by Sex
Within the Management, Business, Science and Arts occupations in New Bedford, the most male-oriented occupations are Business & Financial (100.0%), Computers, Engineering & Science (100.0%), and Architecture & Engineering (100.0%), while the most female-oriented occupations are Legal Services & Support (100.0%), Education Instruction & Library (100.0%), and Health Diagnosing & Treating (100.0%).
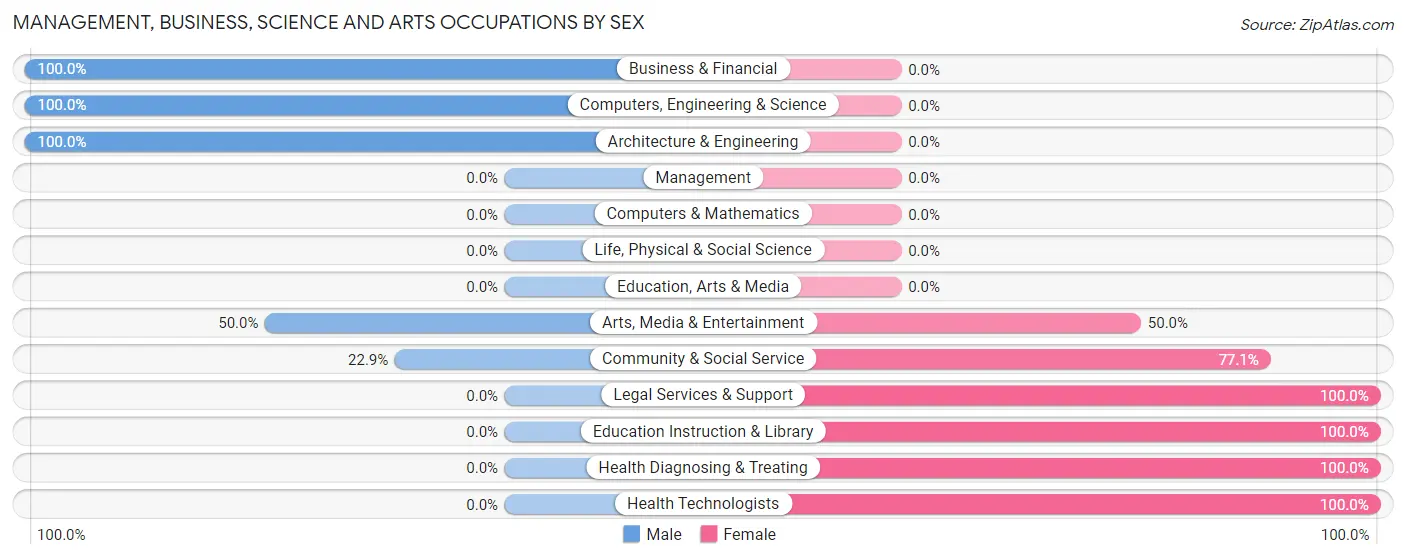
| Occupation | Male | Female |
| Management | 0 (0.0%) | 0 (0.0%) |
| Business & Financial | 22 (100.0%) | 0 (0.0%) |
| Computers, Engineering & Science | 2 (100.0%) | 0 (0.0%) |
| Computers & Mathematics | 0 (0.0%) | 0 (0.0%) |
| Architecture & Engineering | 2 (100.0%) | 0 (0.0%) |
| Life, Physical & Social Science | 0 (0.0%) | 0 (0.0%) |
| Community & Social Service | 11 (22.9%) | 37 (77.1%) |
| Education, Arts & Media | 0 (0.0%) | 0 (0.0%) |
| Legal Services & Support | 0 (0.0%) | 8 (100.0%) |
| Education Instruction & Library | 0 (0.0%) | 18 (100.0%) |
| Arts, Media & Entertainment | 11 (50.0%) | 11 (50.0%) |
| Health Diagnosing & Treating | 0 (0.0%) | 32 (100.0%) |
| Health Technologists | 0 (0.0%) | 6 (100.0%) |
| Total (Category) | 35 (33.7%) | 69 (66.3%) |
| Total (Overall) | 211 (56.0%) | 166 (44.0%) |
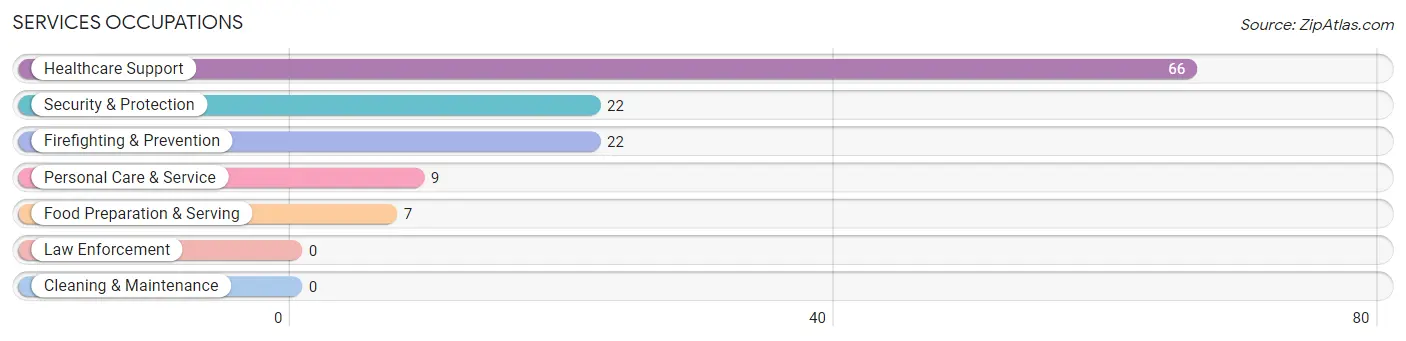
Services Occupations
The most common Services occupations in New Bedford are Healthcare Support (66 | 17.5%), Security & Protection (22 | 5.8%), Firefighting & Prevention (22 | 5.8%), Personal Care & Service (9 | 2.4%), and Food Preparation & Serving (7 | 1.9%).
Services Occupations by Sex
Within the Services occupations in New Bedford, the most male-oriented occupations are Security & Protection (100.0%), Firefighting & Prevention (100.0%), and Healthcare Support (43.9%), while the most female-oriented occupations are Food Preparation & Serving (100.0%), Personal Care & Service (100.0%), and Healthcare Support (56.1%).
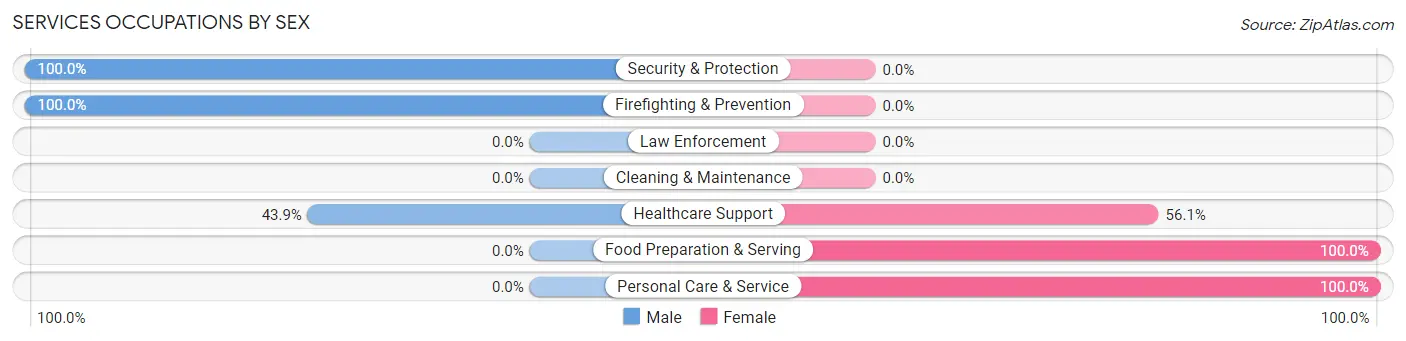
| Occupation | Male | Female |
| Healthcare Support | 29 (43.9%) | 37 (56.1%) |
| Security & Protection | 22 (100.0%) | 0 (0.0%) |
| Firefighting & Prevention | 22 (100.0%) | 0 (0.0%) |
| Law Enforcement | 0 (0.0%) | 0 (0.0%) |
| Food Preparation & Serving | 0 (0.0%) | 7 (100.0%) |
| Cleaning & Maintenance | 0 (0.0%) | 0 (0.0%) |
| Personal Care & Service | 0 (0.0%) | 9 (100.0%) |
| Total (Category) | 51 (49.0%) | 53 (51.0%) |
| Total (Overall) | 211 (56.0%) | 166 (44.0%) |
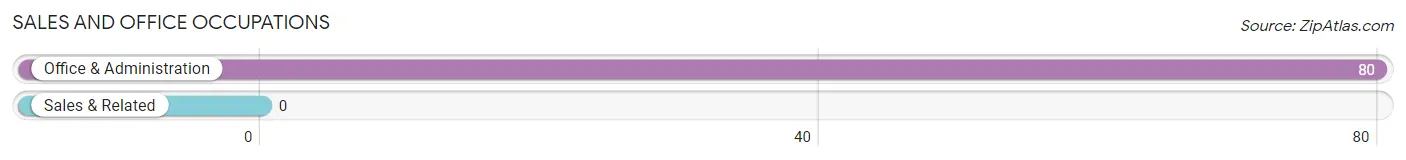
Sales and Office Occupations
The most common Sales and Office occupations in New Bedford are , and Office & Administration (80 | 21.2%).
Sales and Office Occupations by Sex

| Occupation | Male | Female |
| Sales & Related | 0 (0.0%) | 0 (0.0%) |
| Office & Administration | 36 (45.0%) | 44 (55.0%) |
| Total (Category) | 36 (45.0%) | 44 (55.0%) |
| Total (Overall) | 211 (56.0%) | 166 (44.0%) |
Natural Resources, Construction and Maintenance Occupations
The most common Natural Resources, Construction and Maintenance occupations in New Bedford are , and Construction & Extraction (35 | 9.3%).
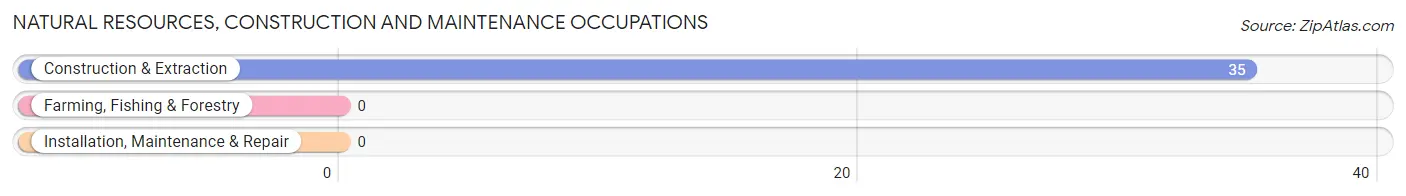
Natural Resources, Construction and Maintenance Occupations by Sex
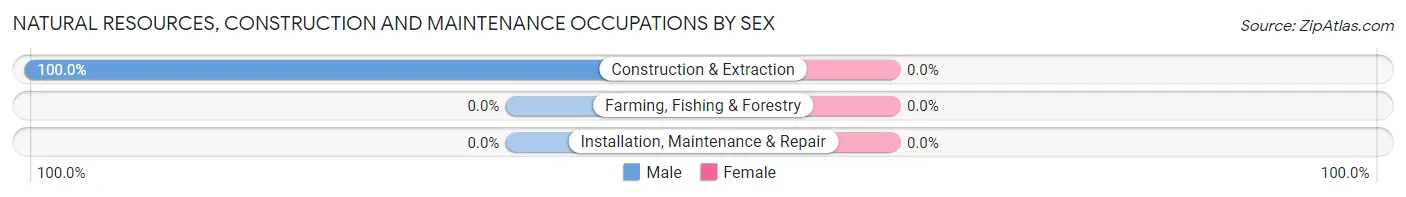
| Occupation | Male | Female |
| Farming, Fishing & Forestry | 0 (0.0%) | 0 (0.0%) |
| Construction & Extraction | 35 (100.0%) | 0 (0.0%) |
| Installation, Maintenance & Repair | 0 (0.0%) | 0 (0.0%) |
| Total (Category) | 35 (100.0%) | 0 (0.0%) |
| Total (Overall) | 211 (56.0%) | 166 (44.0%) |
Production, Transportation and Moving Occupations
The most common Production, Transportation and Moving occupations in New Bedford are Transportation (47 | 12.5%), and Material Moving (7 | 1.9%).
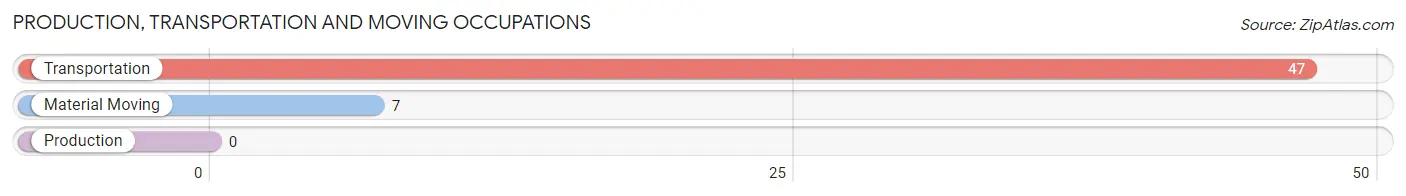
Production, Transportation and Moving Occupations by Sex
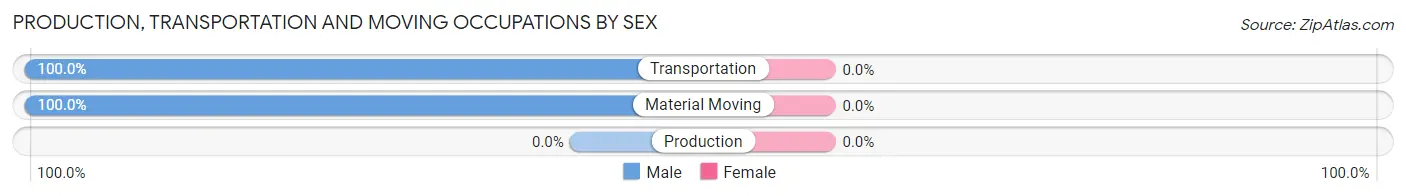
| Occupation | Male | Female |
| Production | 0 (0.0%) | 0 (0.0%) |
| Transportation | 47 (100.0%) | 0 (0.0%) |
| Material Moving | 7 (100.0%) | 0 (0.0%) |
| Total (Category) | 54 (100.0%) | 0 (0.0%) |
| Total (Overall) | 211 (56.0%) | 166 (44.0%) |
Employment Industries by Sex in New Bedford
Employment Industries in New Bedford
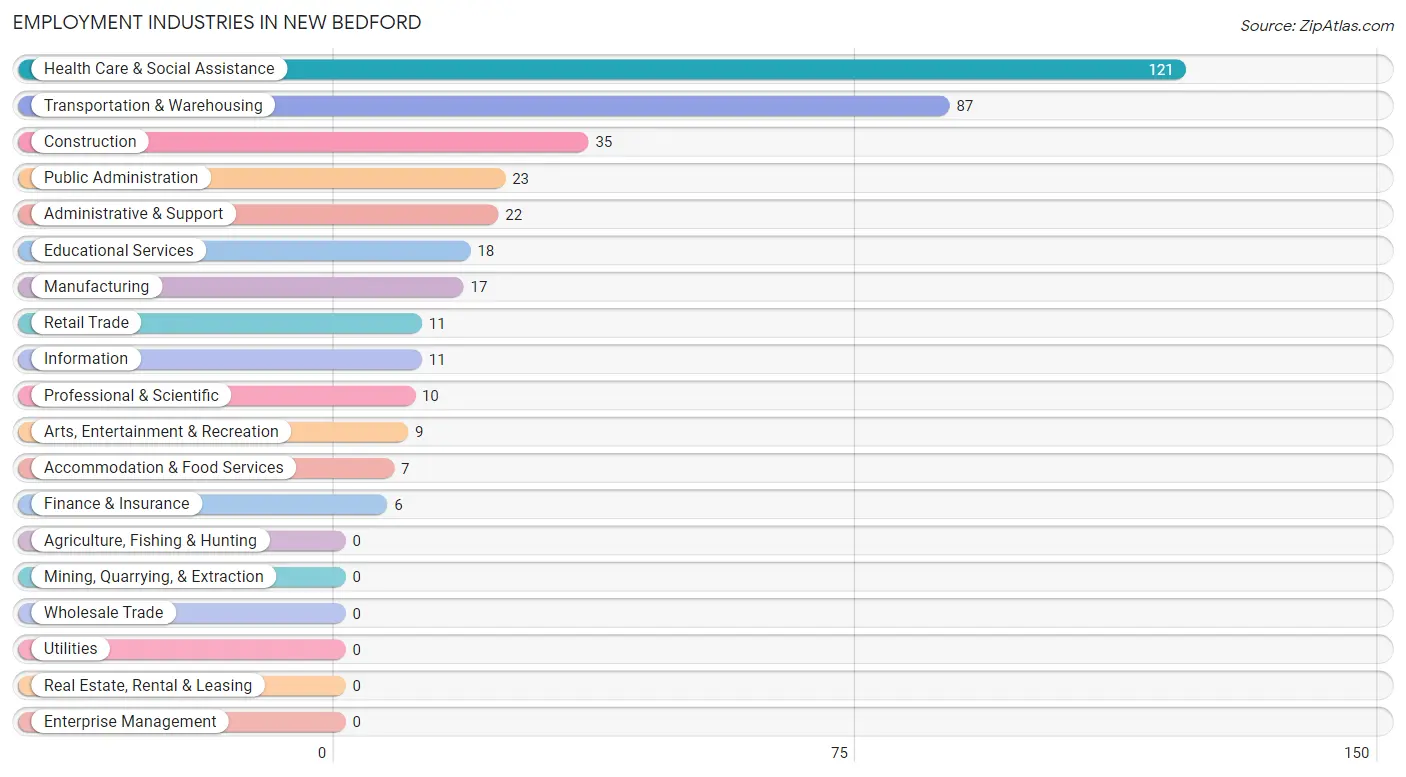
The major employment industries in New Bedford include Health Care & Social Assistance (121 | 32.1%), Transportation & Warehousing (87 | 23.1%), Construction (35 | 9.3%), Public Administration (23 | 6.1%), and Administrative & Support (22 | 5.8%).
Employment Industries by Sex in New Bedford
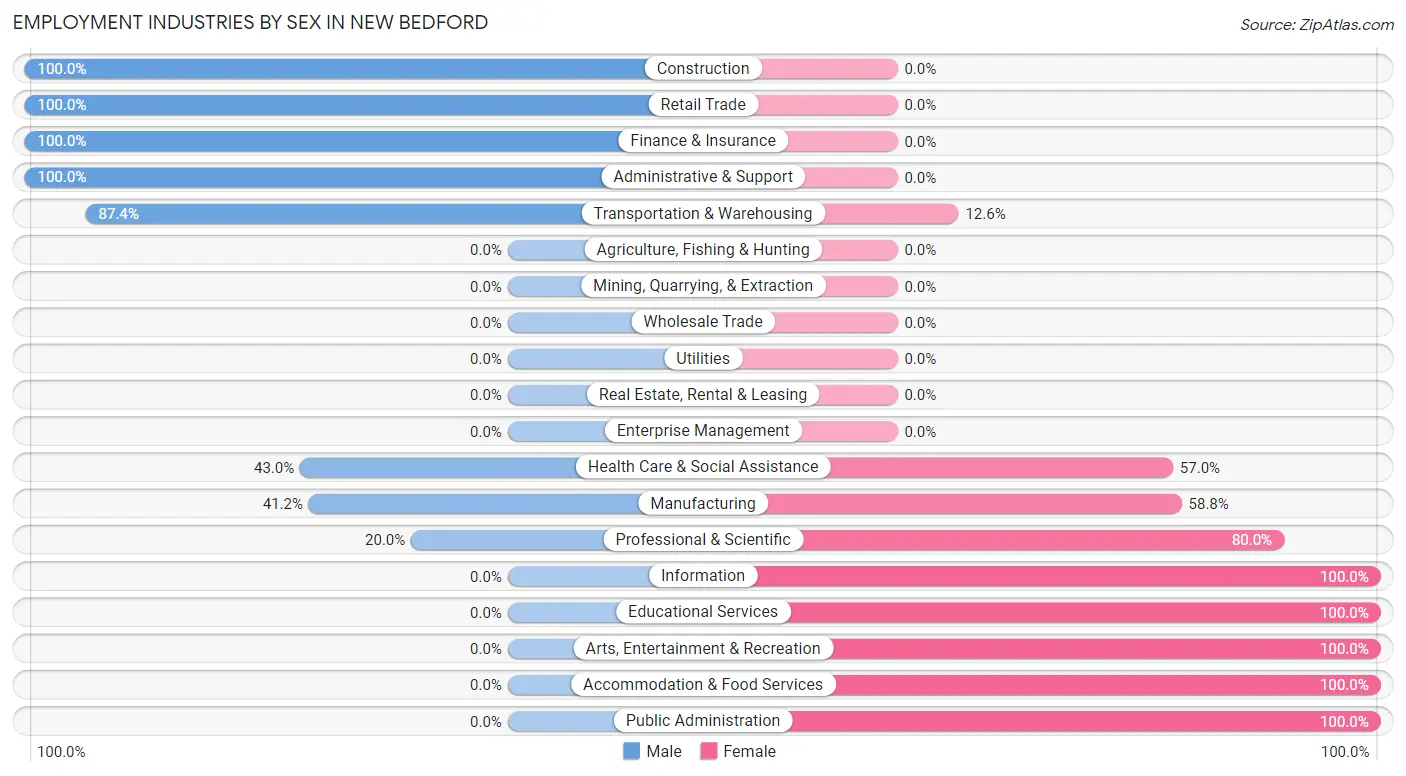
The New Bedford industries that see more men than women are Construction (100.0%), Retail Trade (100.0%), and Finance & Insurance (100.0%), whereas the industries that tend to have a higher number of women are Information (100.0%), Educational Services (100.0%), and Arts, Entertainment & Recreation (100.0%).
| Industry | Male | Female |
| Agriculture, Fishing & Hunting | 0 (0.0%) | 0 (0.0%) |
| Mining, Quarrying, & Extraction | 0 (0.0%) | 0 (0.0%) |
| Construction | 35 (100.0%) | 0 (0.0%) |
| Manufacturing | 7 (41.2%) | 10 (58.8%) |
| Wholesale Trade | 0 (0.0%) | 0 (0.0%) |
| Retail Trade | 11 (100.0%) | 0 (0.0%) |
| Transportation & Warehousing | 76 (87.4%) | 11 (12.6%) |
| Utilities | 0 (0.0%) | 0 (0.0%) |
| Information | 0 (0.0%) | 11 (100.0%) |
| Finance & Insurance | 6 (100.0%) | 0 (0.0%) |
| Real Estate, Rental & Leasing | 0 (0.0%) | 0 (0.0%) |
| Professional & Scientific | 2 (20.0%) | 8 (80.0%) |
| Enterprise Management | 0 (0.0%) | 0 (0.0%) |
| Administrative & Support | 22 (100.0%) | 0 (0.0%) |
| Educational Services | 0 (0.0%) | 18 (100.0%) |
| Health Care & Social Assistance | 52 (43.0%) | 69 (57.0%) |
| Arts, Entertainment & Recreation | 0 (0.0%) | 9 (100.0%) |
| Accommodation & Food Services | 0 (0.0%) | 7 (100.0%) |
| Public Administration | 0 (0.0%) | 23 (100.0%) |
| Total | 211 (56.0%) | 166 (44.0%) |
Education in New Bedford
School Enrollment in New Bedford
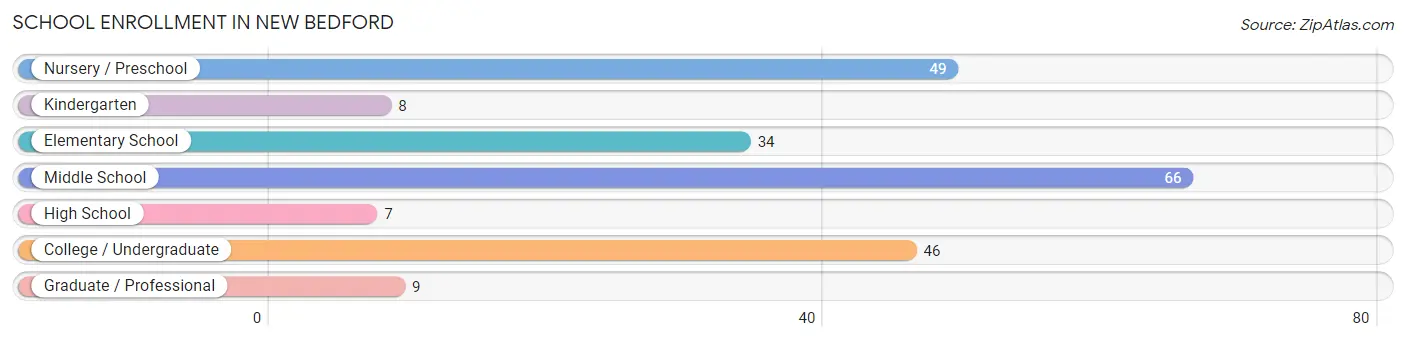
The most common levels of schooling among the 219 students in New Bedford are middle school (66 | 30.1%), nursery / preschool (49 | 22.4%), and college / undergraduate (46 | 21.0%).
| School Level | # Students | % Students |
| Nursery / Preschool | 49 | 22.4% |
| Kindergarten | 8 | 3.6% |
| Elementary School | 34 | 15.5% |
| Middle School | 66 | 30.1% |
| High School | 7 | 3.2% |
| College / Undergraduate | 46 | 21.0% |
| Graduate / Professional | 9 | 4.1% |
| Total | 219 | 100.0% |
School Enrollment by Age by Funding Source in New Bedford
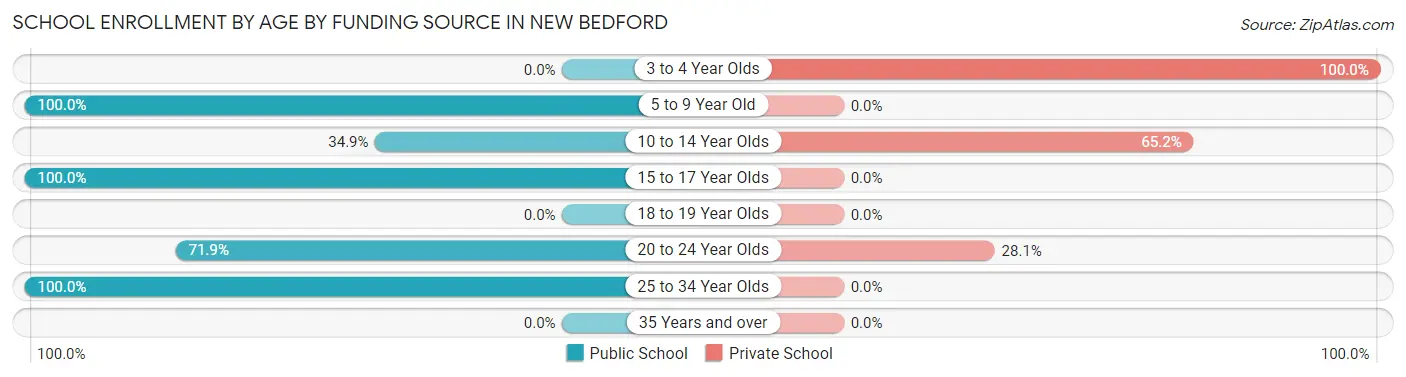
Out of a total of 219 students who are enrolled in schools in New Bedford, 81 (37.0%) attend a private institution, while the remaining 138 (63.0%) are enrolled in public schools. The age group of 3 to 4 year olds has the highest likelihood of being enrolled in private schools, with 29 (100.0% in the age bracket) enrolled. Conversely, the age group of 5 to 9 year old has the lowest likelihood of being enrolled in a private school, with 62 (100.0% in the age bracket) attending a public institution.
| Age Bracket | Public School | Private School |
| 3 to 4 Year Olds | 0 (0.0%) | 29 (100.0%) |
| 5 to 9 Year Old | 62 (100.0%) | 0 (0.0%) |
| 10 to 14 Year Olds | 23 (34.8%) | 43 (65.1%) |
| 15 to 17 Year Olds | 7 (100.0%) | 0 (0.0%) |
| 18 to 19 Year Olds | 0 (0.0%) | 0 (0.0%) |
| 20 to 24 Year Olds | 23 (71.9%) | 9 (28.1%) |
| 25 to 34 Year Olds | 23 (100.0%) | 0 (0.0%) |
| 35 Years and over | 0 (0.0%) | 0 (0.0%) |
| Total | 138 (63.0%) | 81 (37.0%) |
Educational Attainment by Field of Study in New Bedford
Literature & languages (29 | 15.9%), social sciences (27 | 14.8%), education (27 | 14.8%), computers & mathematics (24 | 13.2%), and arts & humanities (22 | 12.1%) are the most common fields of study among 182 individuals in New Bedford who have obtained a bachelor's degree or higher.
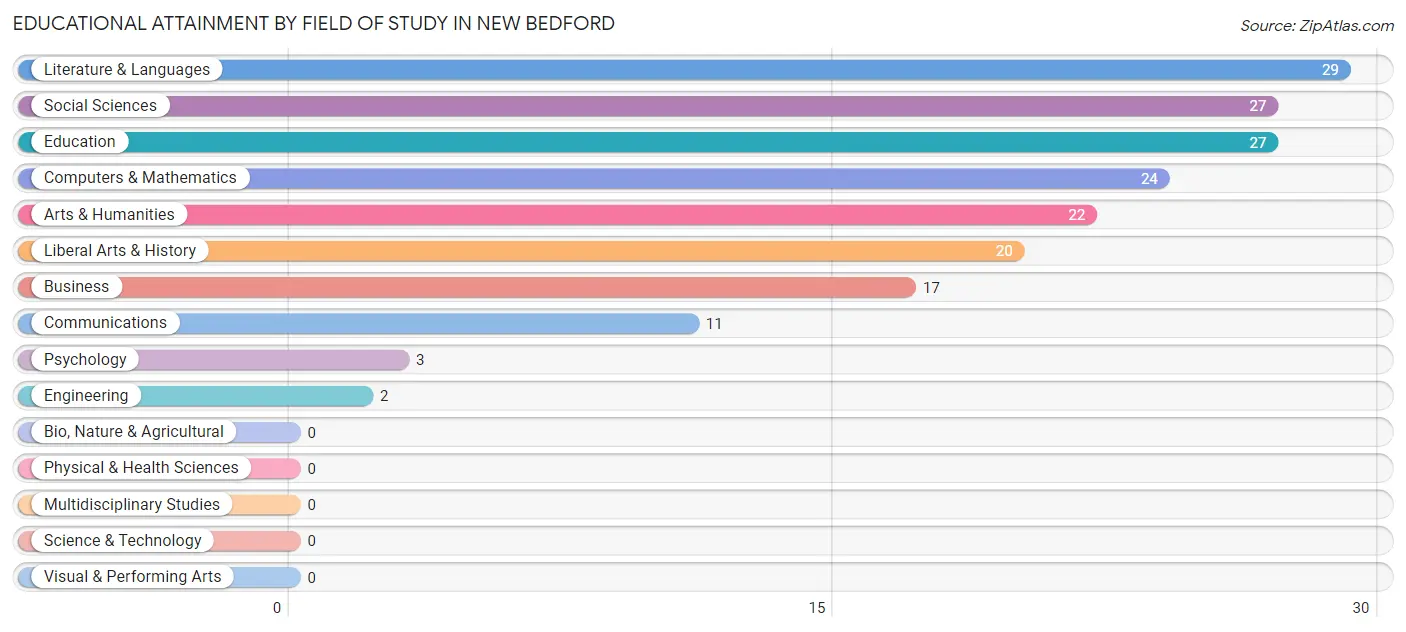
| Field of Study | # Graduates | % Graduates |
| Computers & Mathematics | 24 | 13.2% |
| Bio, Nature & Agricultural | 0 | 0.0% |
| Physical & Health Sciences | 0 | 0.0% |
| Psychology | 3 | 1.7% |
| Social Sciences | 27 | 14.8% |
| Engineering | 2 | 1.1% |
| Multidisciplinary Studies | 0 | 0.0% |
| Science & Technology | 0 | 0.0% |
| Business | 17 | 9.3% |
| Education | 27 | 14.8% |
| Literature & Languages | 29 | 15.9% |
| Liberal Arts & History | 20 | 11.0% |
| Visual & Performing Arts | 0 | 0.0% |
| Communications | 11 | 6.0% |
| Arts & Humanities | 22 | 12.1% |
| Total | 182 | 100.0% |
Transportation & Commute in New Bedford
Vehicle Availability by Sex in New Bedford
The most prevalent vehicle ownership categories in New Bedford are males with 2 vehicles (86, accounting for 40.8%) and females with 2 vehicles (77, making up 51.8%).
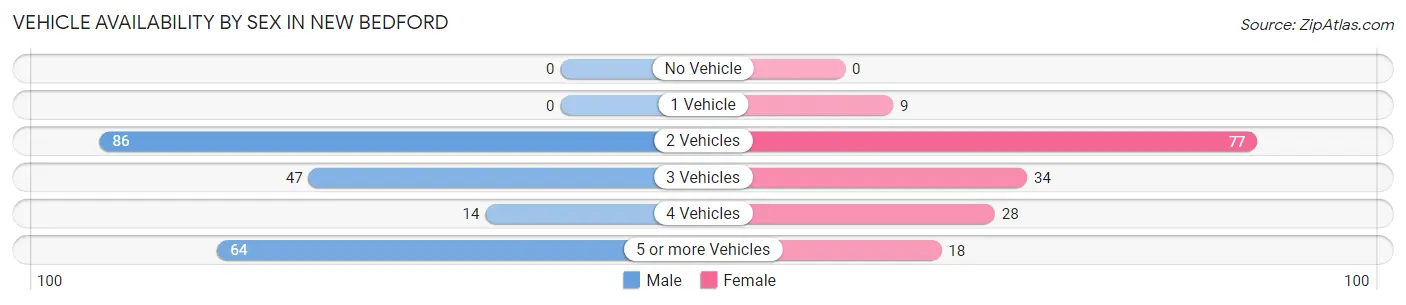
| Vehicles Available | Male | Female |
| No Vehicle | 0 (0.0%) | 0 (0.0%) |
| 1 Vehicle | 0 (0.0%) | 9 (5.4%) |
| 2 Vehicles | 86 (40.8%) | 77 (46.4%) |
| 3 Vehicles | 47 (22.3%) | 34 (20.5%) |
| 4 Vehicles | 14 (6.6%) | 28 (16.9%) |
| 5 or more Vehicles | 64 (30.3%) | 18 (10.8%) |
| Total | 211 (100.0%) | 166 (100.0%) |
Commute Time in New Bedford
The most frequently occuring commute durations in New Bedford are 15 to 19 minutes (116 commuters, 37.4%), 10 to 14 minutes (47 commuters, 15.2%), and 20 to 24 minutes (35 commuters, 11.3%).
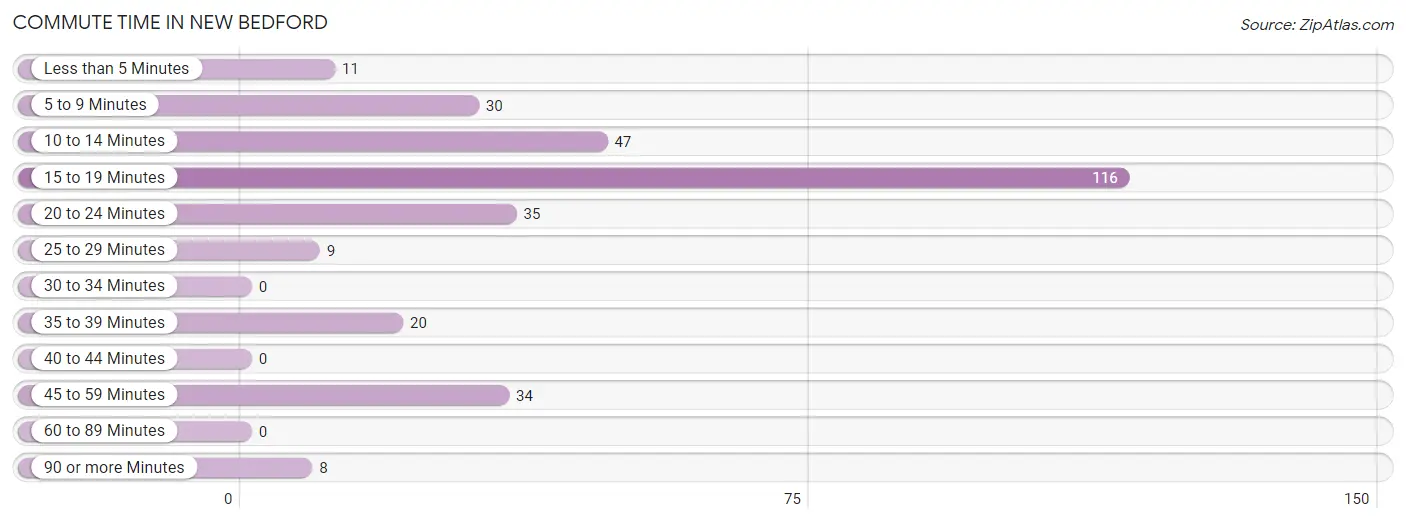
| Commute Time | # Commuters | % Commuters |
| Less than 5 Minutes | 11 | 3.5% |
| 5 to 9 Minutes | 30 | 9.7% |
| 10 to 14 Minutes | 47 | 15.2% |
| 15 to 19 Minutes | 116 | 37.4% |
| 20 to 24 Minutes | 35 | 11.3% |
| 25 to 29 Minutes | 9 | 2.9% |
| 30 to 34 Minutes | 0 | 0.0% |
| 35 to 39 Minutes | 20 | 6.5% |
| 40 to 44 Minutes | 0 | 0.0% |
| 45 to 59 Minutes | 34 | 11.0% |
| 60 to 89 Minutes | 0 | 0.0% |
| 90 or more Minutes | 8 | 2.6% |
Commute Time by Sex in New Bedford
The most common commute times in New Bedford are 15 to 19 minutes (70 commuters, 44.0%) for males and 15 to 19 minutes (46 commuters, 30.5%) for females.
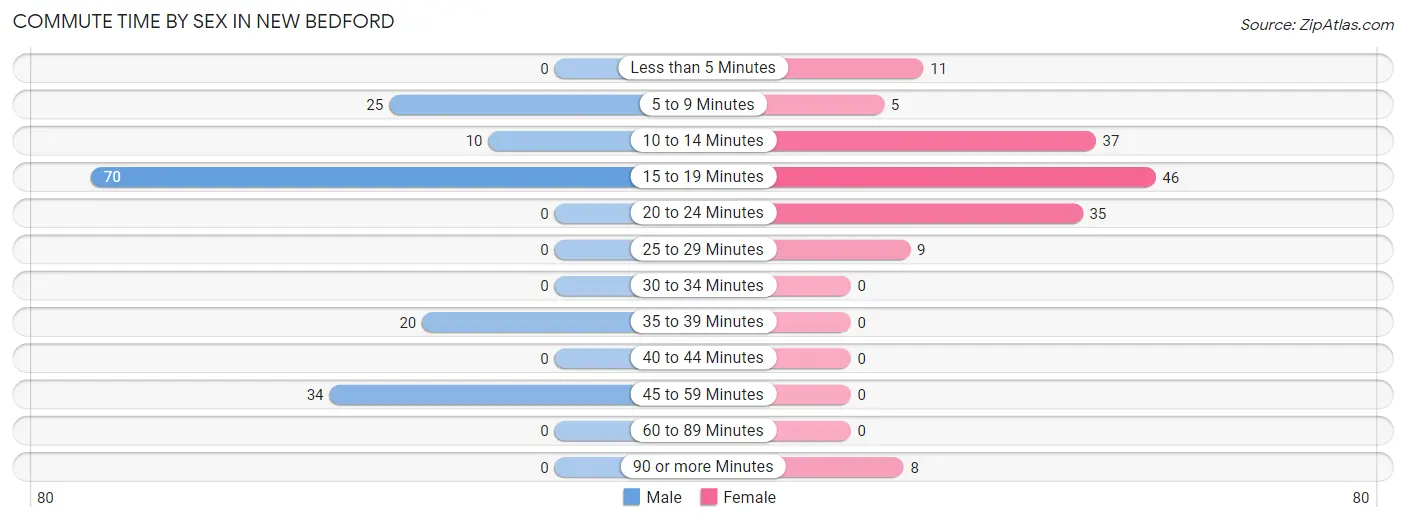
| Commute Time | Male | Female |
| Less than 5 Minutes | 0 (0.0%) | 11 (7.3%) |
| 5 to 9 Minutes | 25 (15.7%) | 5 (3.3%) |
| 10 to 14 Minutes | 10 (6.3%) | 37 (24.5%) |
| 15 to 19 Minutes | 70 (44.0%) | 46 (30.5%) |
| 20 to 24 Minutes | 0 (0.0%) | 35 (23.2%) |
| 25 to 29 Minutes | 0 (0.0%) | 9 (6.0%) |
| 30 to 34 Minutes | 0 (0.0%) | 0 (0.0%) |
| 35 to 39 Minutes | 20 (12.6%) | 0 (0.0%) |
| 40 to 44 Minutes | 0 (0.0%) | 0 (0.0%) |
| 45 to 59 Minutes | 34 (21.4%) | 0 (0.0%) |
| 60 to 89 Minutes | 0 (0.0%) | 0 (0.0%) |
| 90 or more Minutes | 0 (0.0%) | 8 (5.3%) |
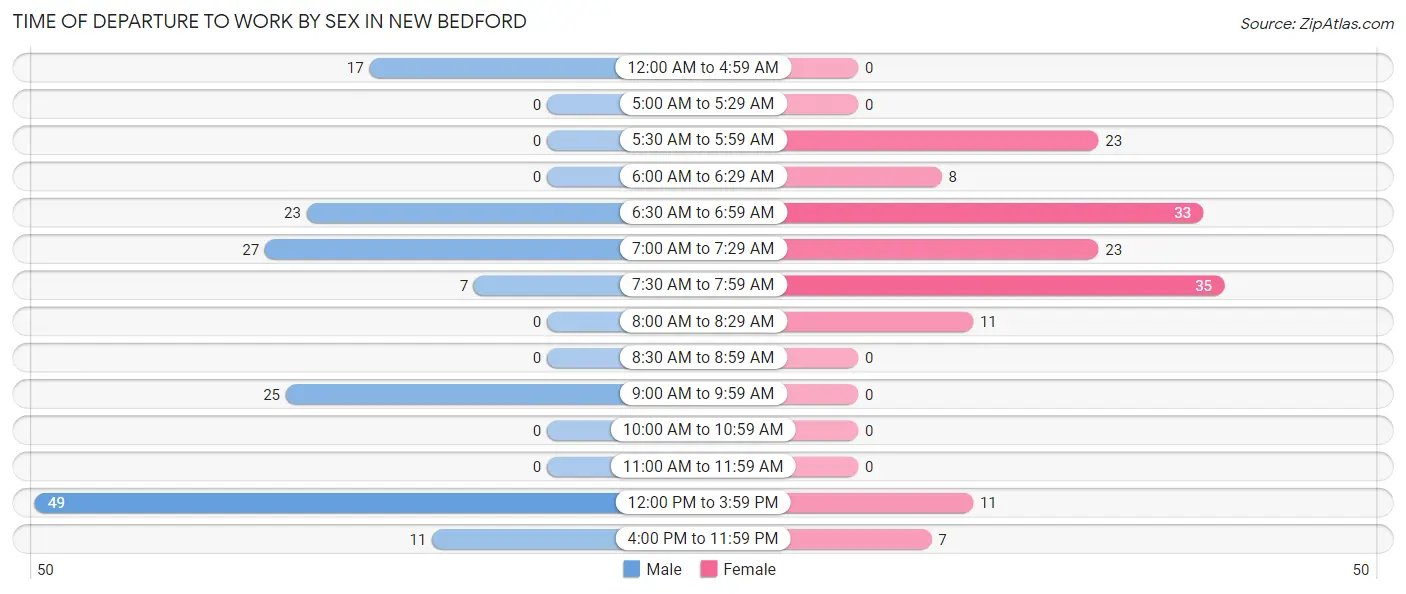
Time of Departure to Work by Sex in New Bedford
The most frequent times of departure to work in New Bedford are 12:00 PM to 3:59 PM (49, 30.8%) for males and 7:30 AM to 7:59 AM (35, 23.2%) for females.
| Time of Departure | Male | Female |
| 12:00 AM to 4:59 AM | 17 (10.7%) | 0 (0.0%) |
| 5:00 AM to 5:29 AM | 0 (0.0%) | 0 (0.0%) |
| 5:30 AM to 5:59 AM | 0 (0.0%) | 23 (15.2%) |
| 6:00 AM to 6:29 AM | 0 (0.0%) | 8 (5.3%) |
| 6:30 AM to 6:59 AM | 23 (14.5%) | 33 (21.8%) |
| 7:00 AM to 7:29 AM | 27 (17.0%) | 23 (15.2%) |
| 7:30 AM to 7:59 AM | 7 (4.4%) | 35 (23.2%) |
| 8:00 AM to 8:29 AM | 0 (0.0%) | 11 (7.3%) |
| 8:30 AM to 8:59 AM | 0 (0.0%) | 0 (0.0%) |
| 9:00 AM to 9:59 AM | 25 (15.7%) | 0 (0.0%) |
| 10:00 AM to 10:59 AM | 0 (0.0%) | 0 (0.0%) |
| 11:00 AM to 11:59 AM | 0 (0.0%) | 0 (0.0%) |
| 12:00 PM to 3:59 PM | 49 (30.8%) | 11 (7.3%) |
| 4:00 PM to 11:59 PM | 11 (6.9%) | 7 (4.6%) |
| Total | 159 (100.0%) | 151 (100.0%) |
Housing Occupancy in New Bedford
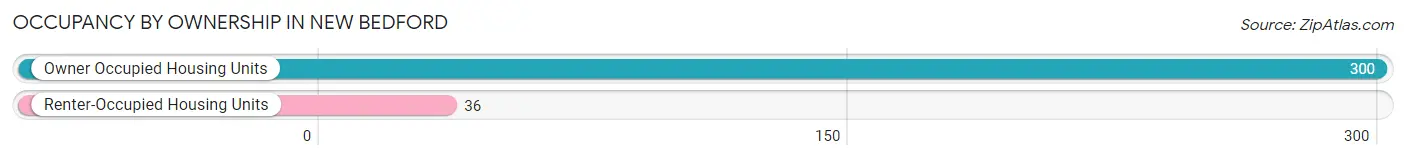
Occupancy by Ownership in New Bedford
Of the total 336 dwellings in New Bedford, owner-occupied units account for 300 (89.3%), while renter-occupied units make up 36 (10.7%).
| Occupancy | # Housing Units | % Housing Units |
| Owner Occupied Housing Units | 300 | 89.3% |
| Renter-Occupied Housing Units | 36 | 10.7% |
| Total Occupied Housing Units | 336 | 100.0% |
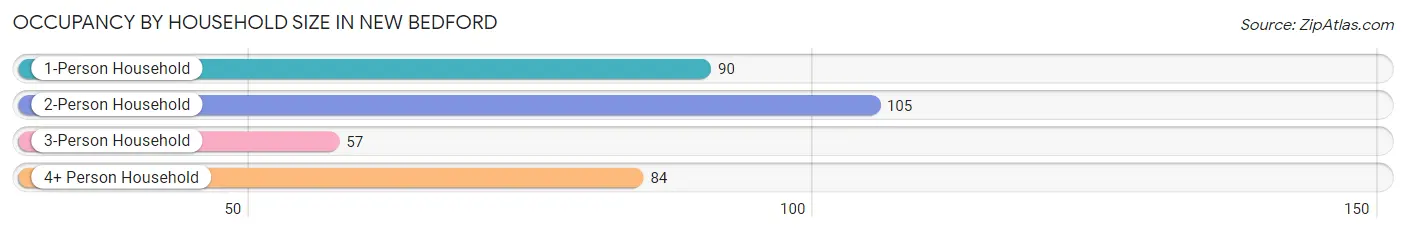
Occupancy by Household Size in New Bedford
| Household Size | # Housing Units | % Housing Units |
| 1-Person Household | 90 | 26.8% |
| 2-Person Household | 105 | 31.2% |
| 3-Person Household | 57 | 17.0% |
| 4+ Person Household | 84 | 25.0% |
| Total Housing Units | 336 | 100.0% |
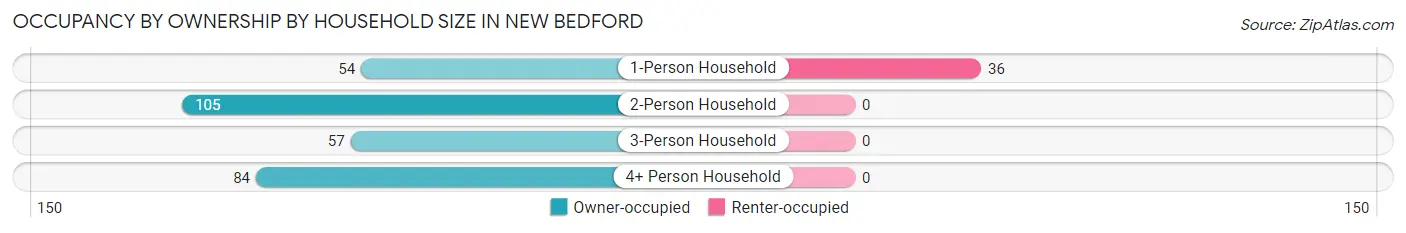
Occupancy by Ownership by Household Size in New Bedford
| Household Size | Owner-occupied | Renter-occupied |
| 1-Person Household | 54 (60.0%) | 36 (40.0%) |
| 2-Person Household | 105 (100.0%) | 0 (0.0%) |
| 3-Person Household | 57 (100.0%) | 0 (0.0%) |
| 4+ Person Household | 84 (100.0%) | 0 (0.0%) |
| Total Housing Units | 300 (89.3%) | 36 (10.7%) |
Occupancy by Educational Attainment in New Bedford
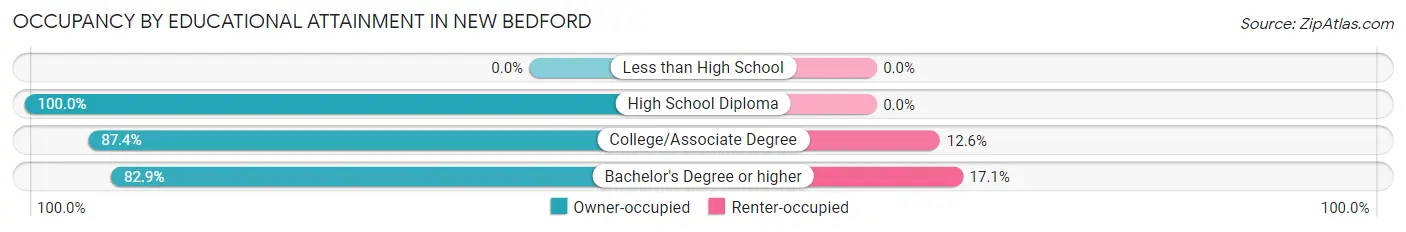
| Household Size | Owner-occupied | Renter-occupied |
| Less than High School | 0 (0.0%) | 0 (0.0%) |
| High School Diploma | 76 (100.0%) | 0 (0.0%) |
| College/Associate Degree | 166 (87.4%) | 24 (12.6%) |
| Bachelor's Degree or higher | 58 (82.9%) | 12 (17.1%) |
Occupancy by Age of Householder in New Bedford
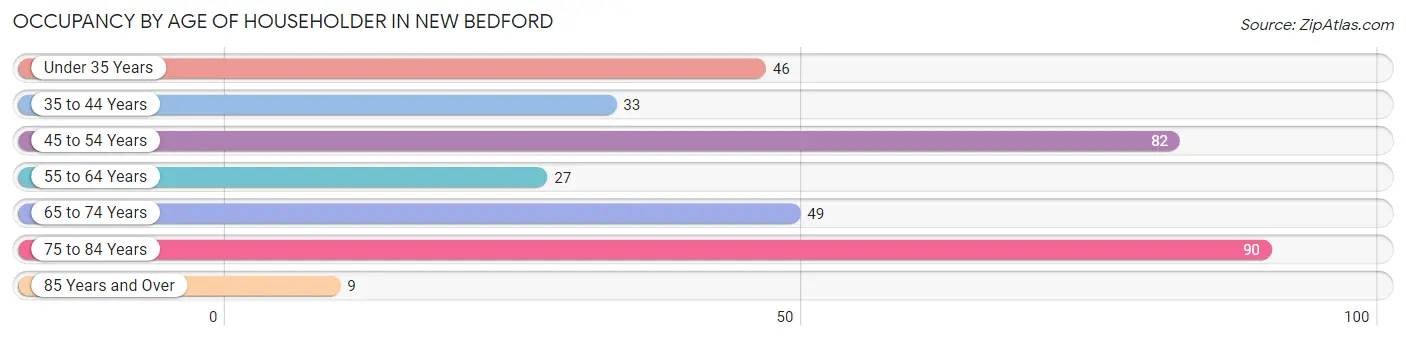
| Age Bracket | # Households | % Households |
| Under 35 Years | 46 | 13.7% |
| 35 to 44 Years | 33 | 9.8% |
| 45 to 54 Years | 82 | 24.4% |
| 55 to 64 Years | 27 | 8.0% |
| 65 to 74 Years | 49 | 14.6% |
| 75 to 84 Years | 90 | 26.8% |
| 85 Years and Over | 9 | 2.7% |
| Total | 336 | 100.0% |
Housing Finances in New Bedford
Median Income by Occupancy in New Bedford
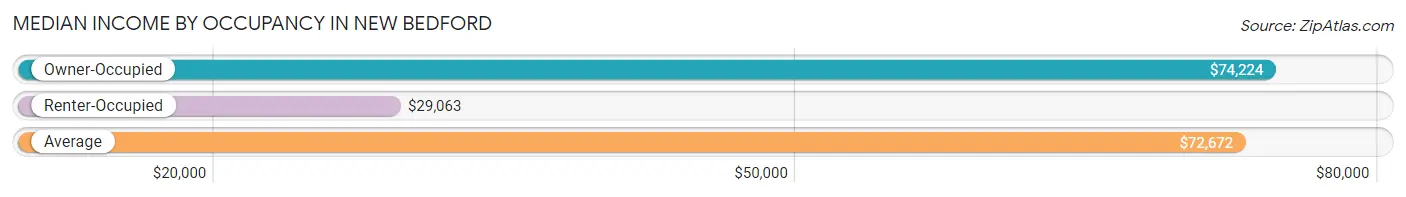
| Occupancy Type | # Households | Median Income |
| Owner-Occupied | 300 (89.3%) | $74,224 |
| Renter-Occupied | 36 (10.7%) | $29,063 |
| Average | 336 (100.0%) | $72,672 |
Occupancy by Householder Income Bracket in New Bedford
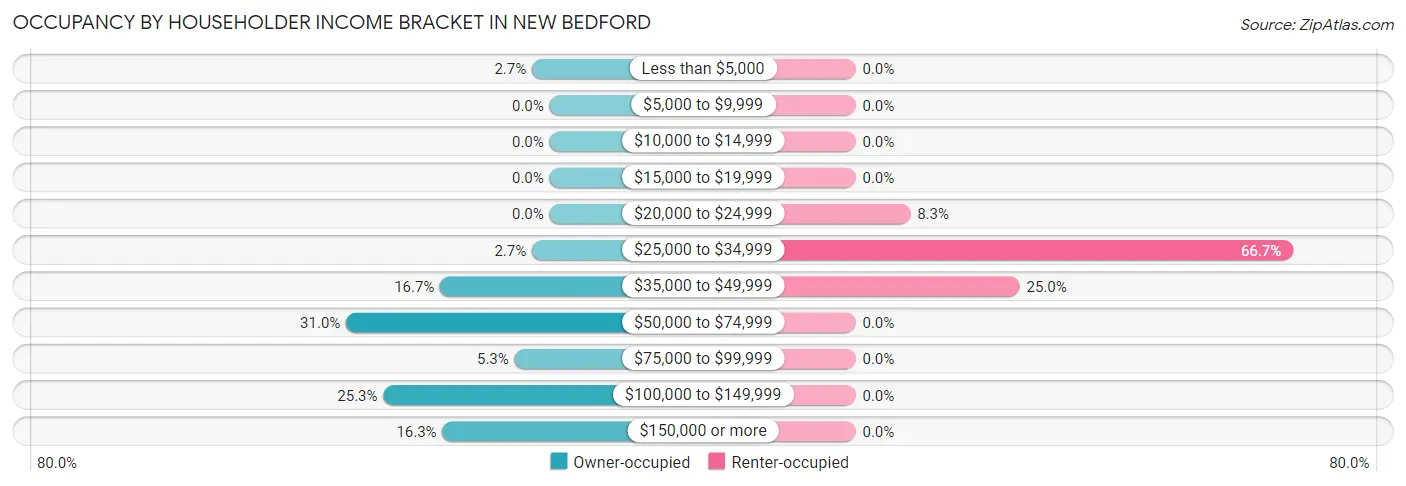
| Income Bracket | Owner-occupied | Renter-occupied |
| Less than $5,000 | 8 (2.7%) | 0 (0.0%) |
| $5,000 to $9,999 | 0 (0.0%) | 0 (0.0%) |
| $10,000 to $14,999 | 0 (0.0%) | 0 (0.0%) |
| $15,000 to $19,999 | 0 (0.0%) | 0 (0.0%) |
| $20,000 to $24,999 | 0 (0.0%) | 3 (8.3%) |
| $25,000 to $34,999 | 8 (2.7%) | 24 (66.7%) |
| $35,000 to $49,999 | 50 (16.7%) | 9 (25.0%) |
| $50,000 to $74,999 | 93 (31.0%) | 0 (0.0%) |
| $75,000 to $99,999 | 16 (5.3%) | 0 (0.0%) |
| $100,000 to $149,999 | 76 (25.3%) | 0 (0.0%) |
| $150,000 or more | 49 (16.3%) | 0 (0.0%) |
| Total | 300 (100.0%) | 36 (100.0%) |
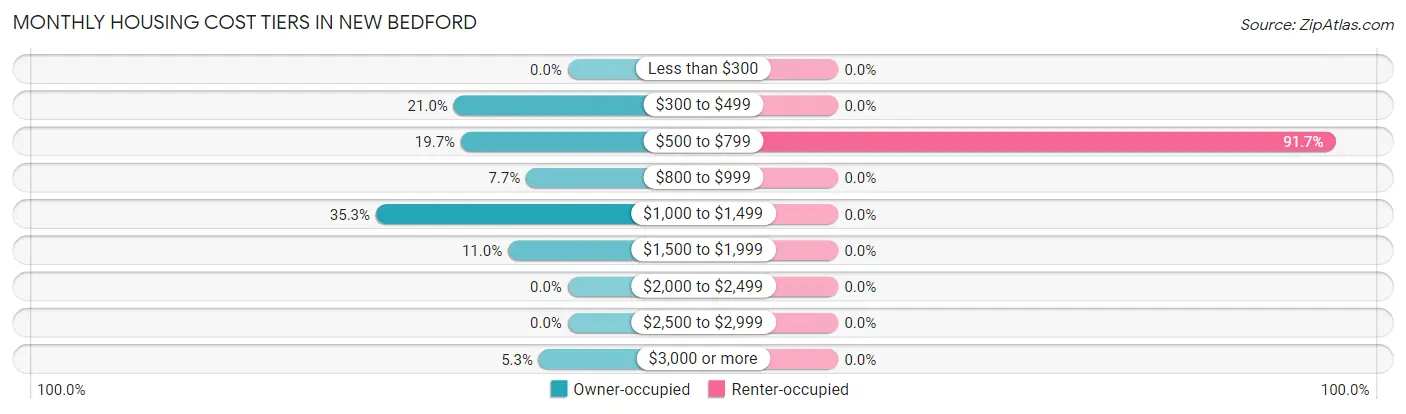
Monthly Housing Cost Tiers in New Bedford
| Monthly Cost | Owner-occupied | Renter-occupied |
| Less than $300 | 0 (0.0%) | 0 (0.0%) |
| $300 to $499 | 63 (21.0%) | 0 (0.0%) |
| $500 to $799 | 59 (19.7%) | 33 (91.7%) |
| $800 to $999 | 23 (7.7%) | 0 (0.0%) |
| $1,000 to $1,499 | 106 (35.3%) | 0 (0.0%) |
| $1,500 to $1,999 | 33 (11.0%) | 0 (0.0%) |
| $2,000 to $2,499 | 0 (0.0%) | 0 (0.0%) |
| $2,500 to $2,999 | 0 (0.0%) | 0 (0.0%) |
| $3,000 or more | 16 (5.3%) | 0 (0.0%) |
| Total | 300 (100.0%) | 36 (100.0%) |
Physical Housing Characteristics in New Bedford
Housing Structures in New Bedford
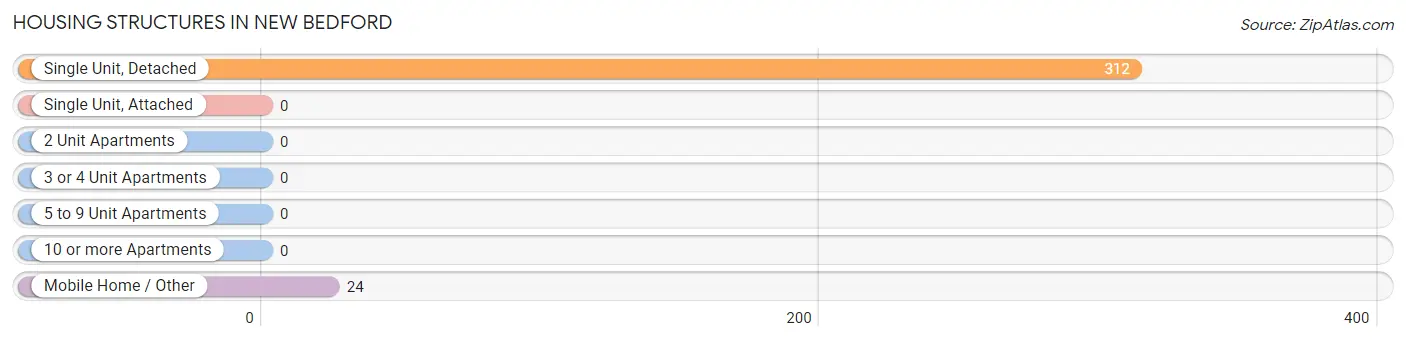
| Structure Type | # Housing Units | % Housing Units |
| Single Unit, Detached | 312 | 92.9% |
| Single Unit, Attached | 0 | 0.0% |
| 2 Unit Apartments | 0 | 0.0% |
| 3 or 4 Unit Apartments | 0 | 0.0% |
| 5 to 9 Unit Apartments | 0 | 0.0% |
| 10 or more Apartments | 0 | 0.0% |
| Mobile Home / Other | 24 | 7.1% |
| Total | 336 | 100.0% |
Housing Structures by Occupancy in New Bedford
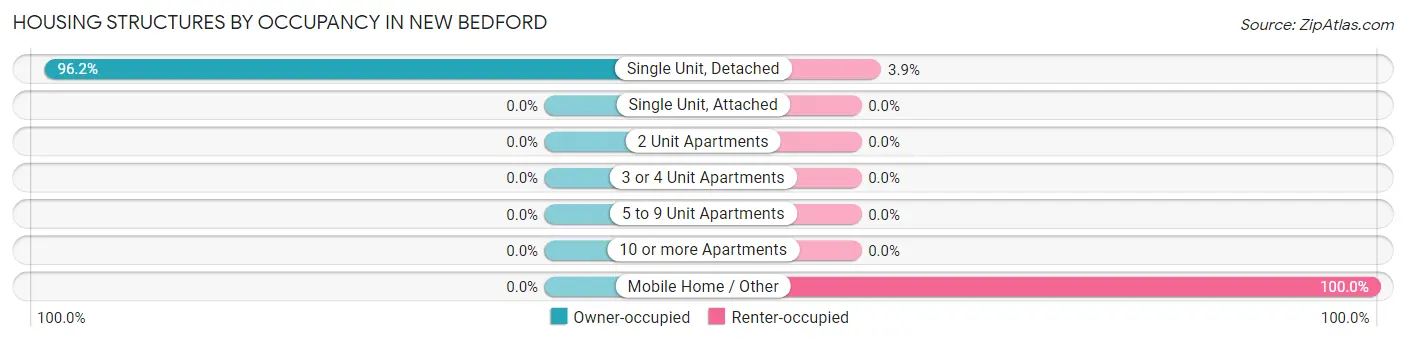
| Structure Type | Owner-occupied | Renter-occupied |
| Single Unit, Detached | 300 (96.2%) | 12 (3.8%) |
| Single Unit, Attached | 0 (0.0%) | 0 (0.0%) |
| 2 Unit Apartments | 0 (0.0%) | 0 (0.0%) |
| 3 or 4 Unit Apartments | 0 (0.0%) | 0 (0.0%) |
| 5 to 9 Unit Apartments | 0 (0.0%) | 0 (0.0%) |
| 10 or more Apartments | 0 (0.0%) | 0 (0.0%) |
| Mobile Home / Other | 0 (0.0%) | 24 (100.0%) |
| Total | 300 (89.3%) | 36 (10.7%) |
Housing Structures by Number of Rooms in New Bedford
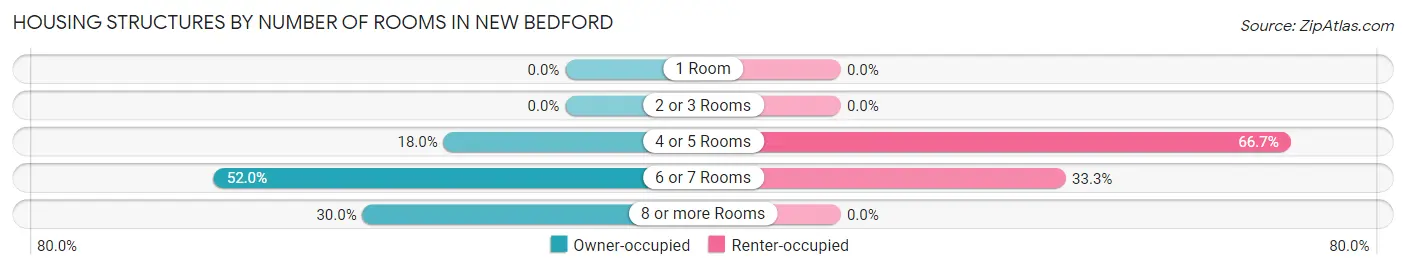
| Number of Rooms | Owner-occupied | Renter-occupied |
| 1 Room | 0 (0.0%) | 0 (0.0%) |
| 2 or 3 Rooms | 0 (0.0%) | 0 (0.0%) |
| 4 or 5 Rooms | 54 (18.0%) | 24 (66.7%) |
| 6 or 7 Rooms | 156 (52.0%) | 12 (33.3%) |
| 8 or more Rooms | 90 (30.0%) | 0 (0.0%) |
| Total | 300 (100.0%) | 36 (100.0%) |
Housing Structure by Heating Type in New Bedford
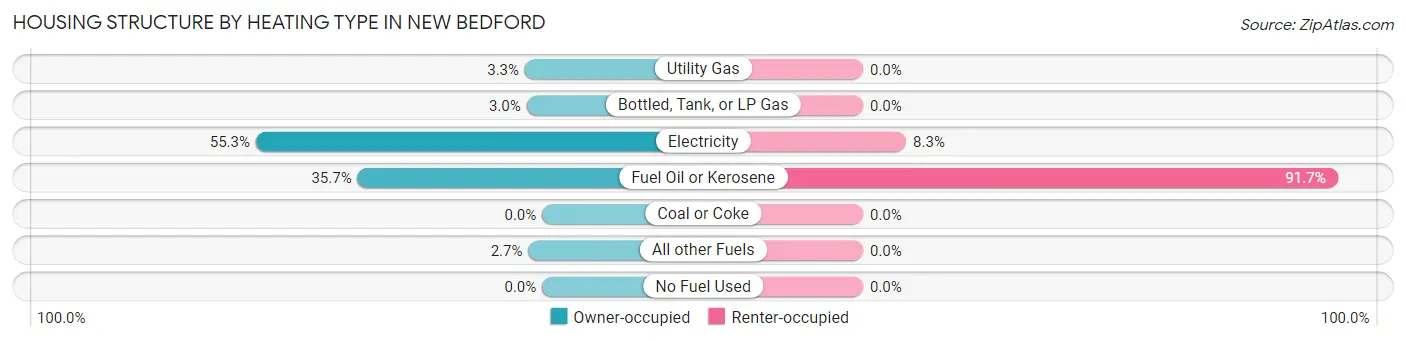
| Heating Type | Owner-occupied | Renter-occupied |
| Utility Gas | 10 (3.3%) | 0 (0.0%) |
| Bottled, Tank, or LP Gas | 9 (3.0%) | 0 (0.0%) |
| Electricity | 166 (55.3%) | 3 (8.3%) |
| Fuel Oil or Kerosene | 107 (35.7%) | 33 (91.7%) |
| Coal or Coke | 0 (0.0%) | 0 (0.0%) |
| All other Fuels | 8 (2.7%) | 0 (0.0%) |
| No Fuel Used | 0 (0.0%) | 0 (0.0%) |
| Total | 300 (100.0%) | 36 (100.0%) |
Household Vehicle Usage in New Bedford
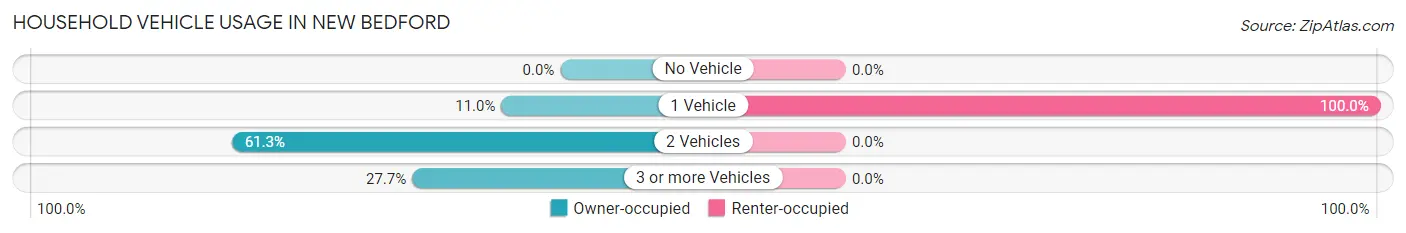
| Vehicles per Household | Owner-occupied | Renter-occupied |
| No Vehicle | 0 (0.0%) | 0 (0.0%) |
| 1 Vehicle | 33 (11.0%) | 36 (100.0%) |
| 2 Vehicles | 184 (61.3%) | 0 (0.0%) |
| 3 or more Vehicles | 83 (27.7%) | 0 (0.0%) |
| Total | 300 (100.0%) | 36 (100.0%) |
Real Estate & Mortgages in New Bedford
Real Estate and Mortgage Overview in New Bedford
| Characteristic | Without Mortgage | With Mortgage |
| Housing Units | 117 | 183 |
| Median Property Value | $228,300 | $151,300 |
| Median Household Income | $88,375 | $30 |
| Monthly Housing Costs | $486 | $16 |
| Real Estate Taxes | $2,011 | $9 |
Property Value by Mortgage Status in New Bedford
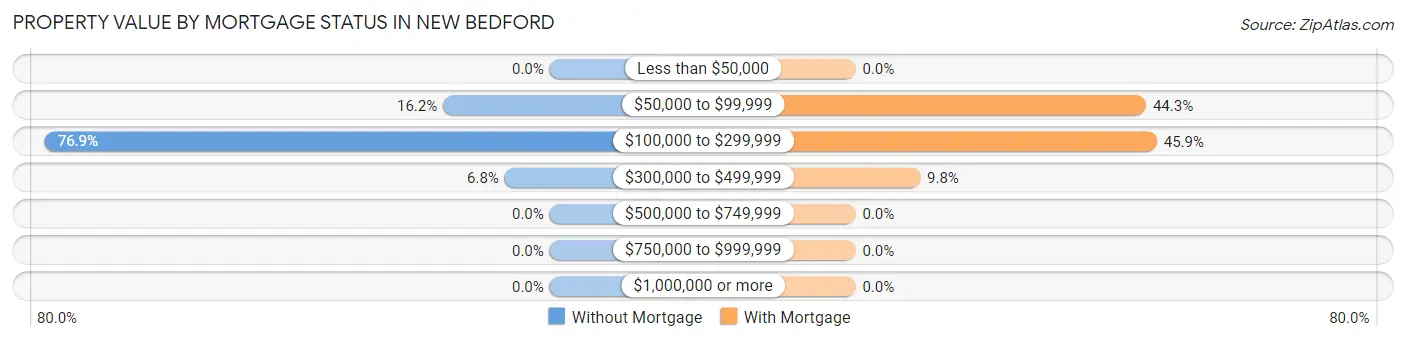
| Property Value | Without Mortgage | With Mortgage |
| Less than $50,000 | 0 (0.0%) | 0 (0.0%) |
| $50,000 to $99,999 | 19 (16.2%) | 81 (44.3%) |
| $100,000 to $299,999 | 90 (76.9%) | 84 (45.9%) |
| $300,000 to $499,999 | 8 (6.8%) | 18 (9.8%) |
| $500,000 to $749,999 | 0 (0.0%) | 0 (0.0%) |
| $750,000 to $999,999 | 0 (0.0%) | 0 (0.0%) |
| $1,000,000 or more | 0 (0.0%) | 0 (0.0%) |
| Total | 117 (100.0%) | 183 (100.0%) |
Household Income by Mortgage Status in New Bedford
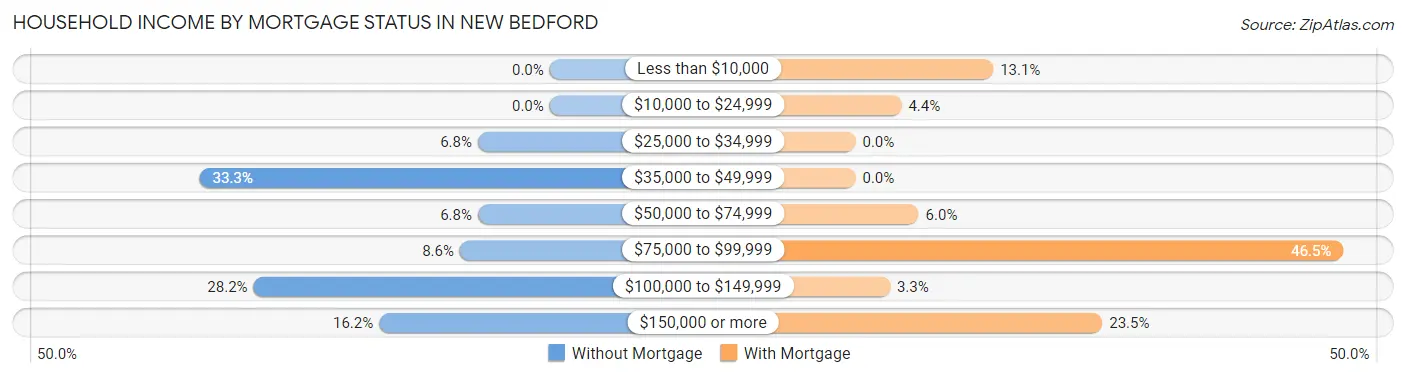
| Household Income | Without Mortgage | With Mortgage |
| Less than $10,000 | 0 (0.0%) | 24 (13.1%) |
| $10,000 to $24,999 | 0 (0.0%) | 8 (4.4%) |
| $25,000 to $34,999 | 8 (6.8%) | 0 (0.0%) |
| $35,000 to $49,999 | 39 (33.3%) | 0 (0.0%) |
| $50,000 to $74,999 | 8 (6.8%) | 11 (6.0%) |
| $75,000 to $99,999 | 10 (8.6%) | 85 (46.5%) |
| $100,000 to $149,999 | 33 (28.2%) | 6 (3.3%) |
| $150,000 or more | 19 (16.2%) | 43 (23.5%) |
| Total | 117 (100.0%) | 183 (100.0%) |
Property Value to Household Income Ratio in New Bedford
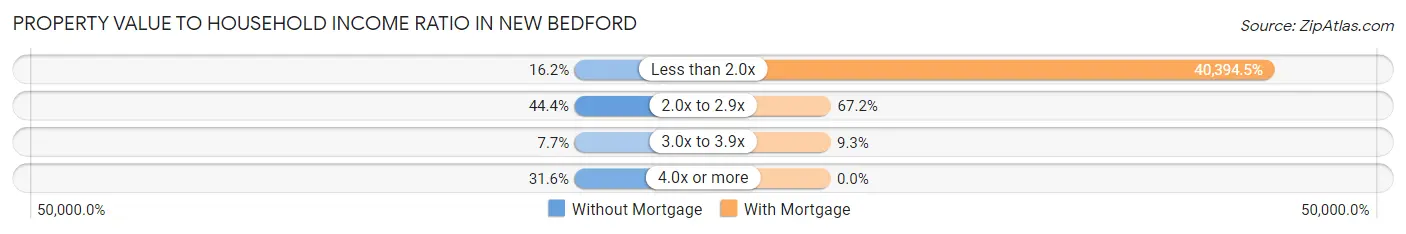
| Value-to-Income Ratio | Without Mortgage | With Mortgage |
| Less than 2.0x | 19 (16.2%) | 73,922 (40,394.5%) |
| 2.0x to 2.9x | 52 (44.4%) | 123 (67.2%) |
| 3.0x to 3.9x | 9 (7.7%) | 17 (9.3%) |
| 4.0x or more | 37 (31.6%) | 0 (0.0%) |
| Total | 117 (100.0%) | 183 (100.0%) |
Real Estate Taxes by Mortgage Status in New Bedford
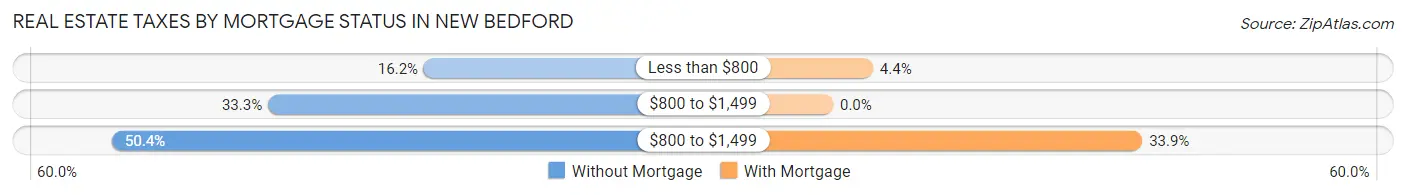
| Property Taxes | Without Mortgage | With Mortgage |
| Less than $800 | 19 (16.2%) | 8 (4.4%) |
| $800 to $1,499 | 39 (33.3%) | 0 (0.0%) |
| $800 to $1,499 | 59 (50.4%) | 62 (33.9%) |
| Total | 117 (100.0%) | 183 (100.0%) |
Health & Disability in New Bedford
Health Insurance Coverage by Age in New Bedford
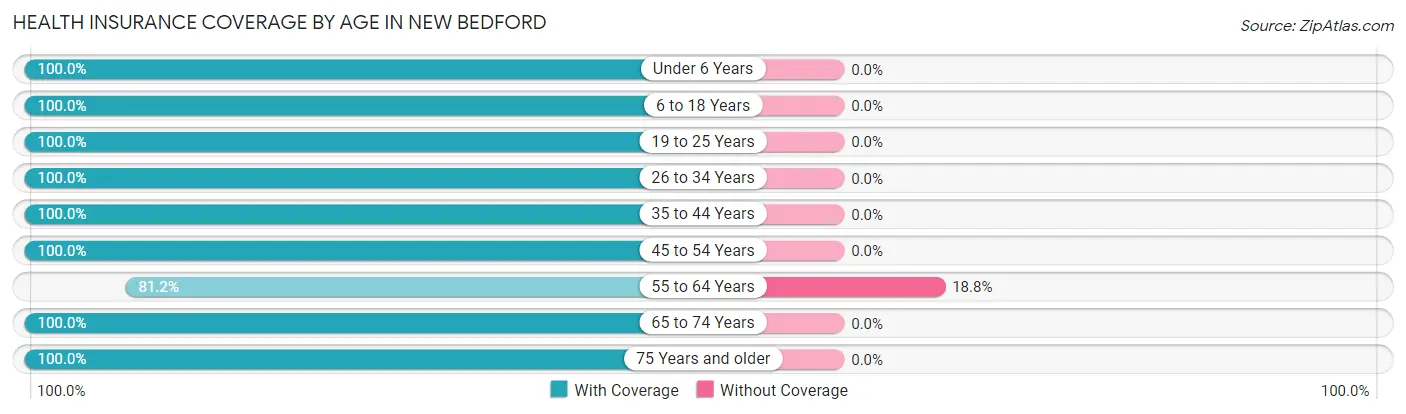
| Age Bracket | With Coverage | Without Coverage |
| Under 6 Years | 111 (100.0%) | 0 (0.0%) |
| 6 to 18 Years | 115 (100.0%) | 0 (0.0%) |
| 19 to 25 Years | 90 (100.0%) | 0 (0.0%) |
| 26 to 34 Years | 79 (100.0%) | 0 (0.0%) |
| 35 to 44 Years | 59 (100.0%) | 0 (0.0%) |
| 45 to 54 Years | 126 (100.0%) | 0 (0.0%) |
| 55 to 64 Years | 69 (81.2%) | 16 (18.8%) |
| 65 to 74 Years | 76 (100.0%) | 0 (0.0%) |
| 75 Years and older | 134 (100.0%) | 0 (0.0%) |
| Total | 859 (98.2%) | 16 (1.8%) |
Health Insurance Coverage by Citizenship Status in New Bedford
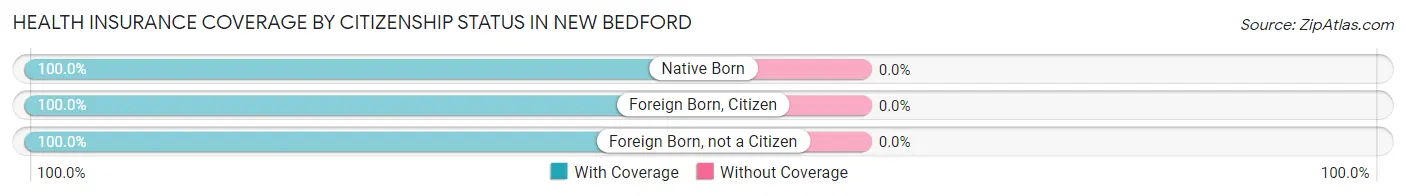
| Citizenship Status | With Coverage | Without Coverage |
| Native Born | 111 (100.0%) | 0 (0.0%) |
| Foreign Born, Citizen | 115 (100.0%) | 0 (0.0%) |
| Foreign Born, not a Citizen | 90 (100.0%) | 0 (0.0%) |
Health Insurance Coverage by Household Income in New Bedford
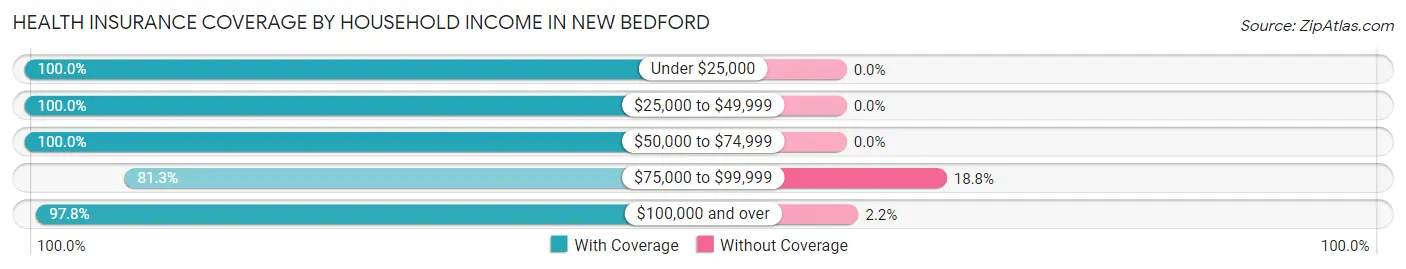
| Household Income | With Coverage | Without Coverage |
| Under $25,000 | 27 (100.0%) | 0 (0.0%) |
| $25,000 to $49,999 | 129 (100.0%) | 0 (0.0%) |
| $50,000 to $74,999 | 232 (100.0%) | 0 (0.0%) |
| $75,000 to $99,999 | 26 (81.2%) | 6 (18.8%) |
| $100,000 and over | 445 (97.8%) | 10 (2.2%) |
Public vs Private Health Insurance Coverage by Age in New Bedford
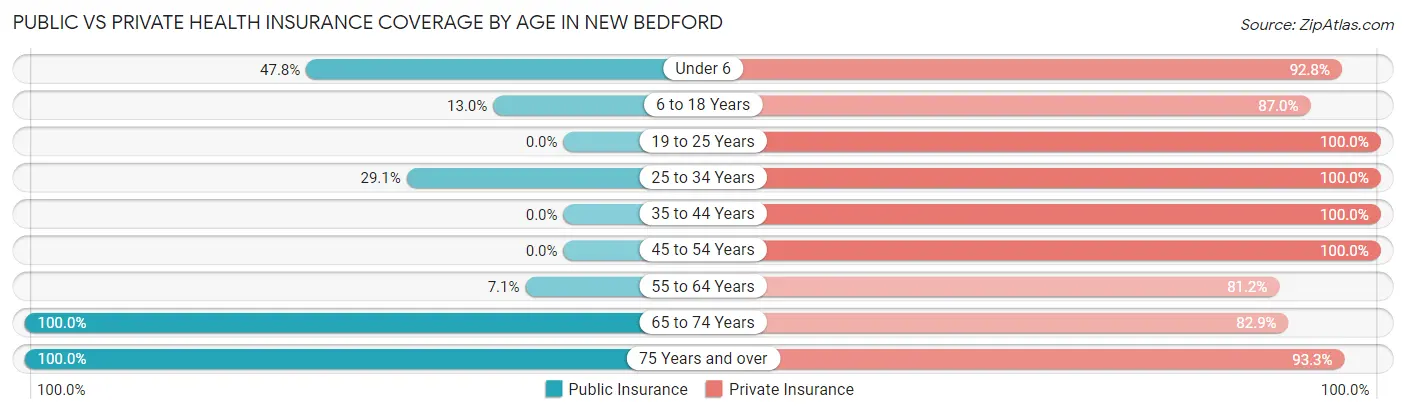
| Age Bracket | Public Insurance | Private Insurance |
| Under 6 | 53 (47.7%) | 103 (92.8%) |
| 6 to 18 Years | 15 (13.0%) | 100 (87.0%) |
| 19 to 25 Years | 0 (0.0%) | 90 (100.0%) |
| 25 to 34 Years | 23 (29.1%) | 79 (100.0%) |
| 35 to 44 Years | 0 (0.0%) | 59 (100.0%) |
| 45 to 54 Years | 0 (0.0%) | 126 (100.0%) |
| 55 to 64 Years | 6 (7.1%) | 69 (81.2%) |
| 65 to 74 Years | 76 (100.0%) | 63 (82.9%) |
| 75 Years and over | 134 (100.0%) | 125 (93.3%) |
| Total | 307 (35.1%) | 814 (93.0%) |
Disability Status by Sex by Age in New Bedford
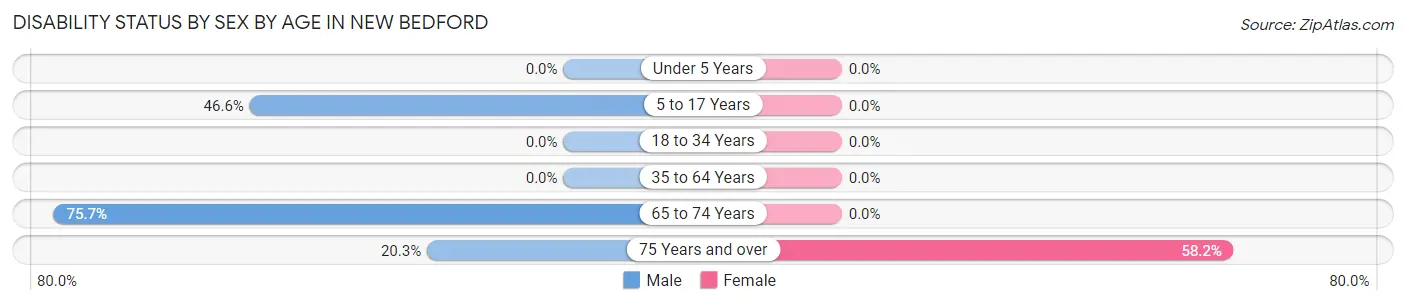
| Age Bracket | Male | Female |
| Under 5 Years | 0 (0.0%) | 0 (0.0%) |
| 5 to 17 Years | 34 (46.6%) | 0 (0.0%) |
| 18 to 34 Years | 0 (0.0%) | 0 (0.0%) |
| 35 to 64 Years | 0 (0.0%) | 0 (0.0%) |
| 65 to 74 Years | 28 (75.7%) | 0 (0.0%) |
| 75 Years and over | 16 (20.3%) | 32 (58.2%) |
Disability Class by Sex by Age in New Bedford
Disability Class: Hearing Difficulty
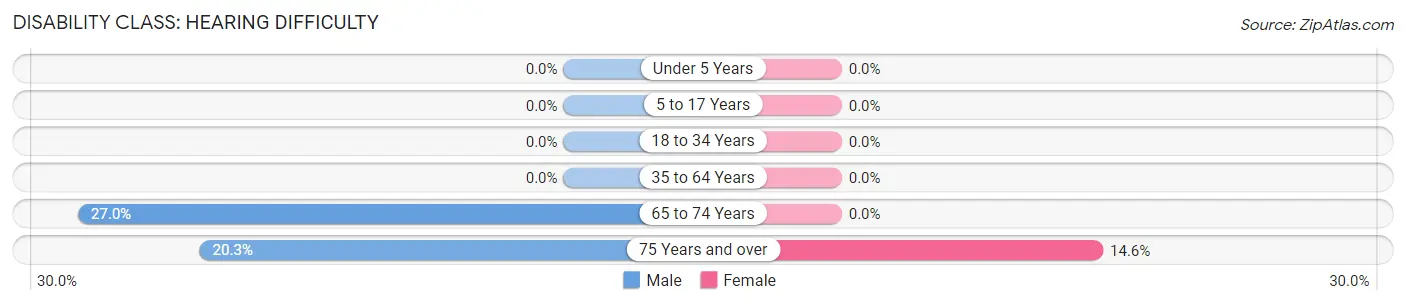
| Age Bracket | Male | Female |
| Under 5 Years | 0 (0.0%) | 0 (0.0%) |
| 5 to 17 Years | 0 (0.0%) | 0 (0.0%) |
| 18 to 34 Years | 0 (0.0%) | 0 (0.0%) |
| 35 to 64 Years | 0 (0.0%) | 0 (0.0%) |
| 65 to 74 Years | 10 (27.0%) | 0 (0.0%) |
| 75 Years and over | 16 (20.3%) | 8 (14.5%) |
Disability Class: Vision Difficulty
| Age Bracket | Male | Female |
| Under 5 Years | 0 (0.0%) | 0 (0.0%) |
| 5 to 17 Years | 0 (0.0%) | 0 (0.0%) |
| 18 to 34 Years | 0 (0.0%) | 0 (0.0%) |
| 35 to 64 Years | 0 (0.0%) | 0 (0.0%) |
| 65 to 74 Years | 0 (0.0%) | 0 (0.0%) |
| 75 Years and over | 0 (0.0%) | 0 (0.0%) |
Disability Class: Cognitive Difficulty
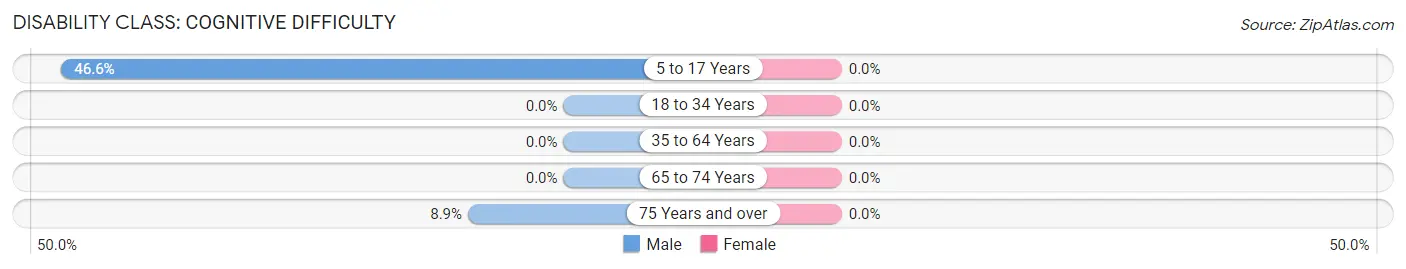
| Age Bracket | Male | Female |
| 5 to 17 Years | 34 (46.6%) | 0 (0.0%) |
| 18 to 34 Years | 0 (0.0%) | 0 (0.0%) |
| 35 to 64 Years | 0 (0.0%) | 0 (0.0%) |
| 65 to 74 Years | 0 (0.0%) | 0 (0.0%) |
| 75 Years and over | 7 (8.9%) | 0 (0.0%) |
Disability Class: Ambulatory Difficulty
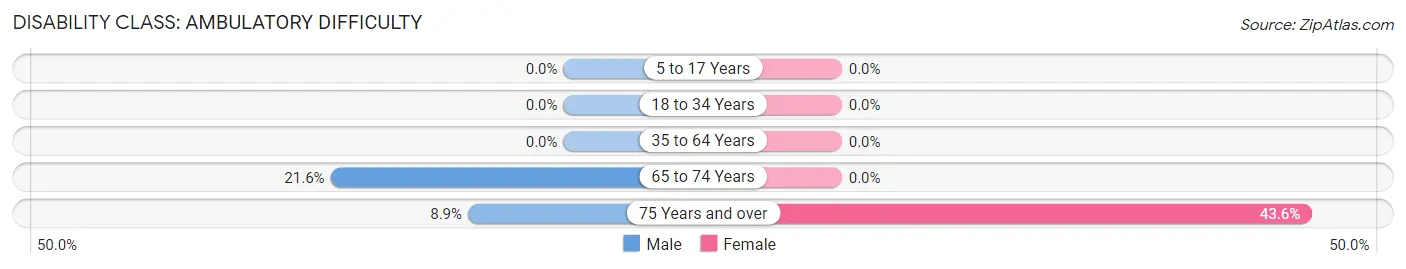
| Age Bracket | Male | Female |
| 5 to 17 Years | 0 (0.0%) | 0 (0.0%) |
| 18 to 34 Years | 0 (0.0%) | 0 (0.0%) |
| 35 to 64 Years | 0 (0.0%) | 0 (0.0%) |
| 65 to 74 Years | 8 (21.6%) | 0 (0.0%) |
| 75 Years and over | 7 (8.9%) | 24 (43.6%) |
Disability Class: Self-Care Difficulty
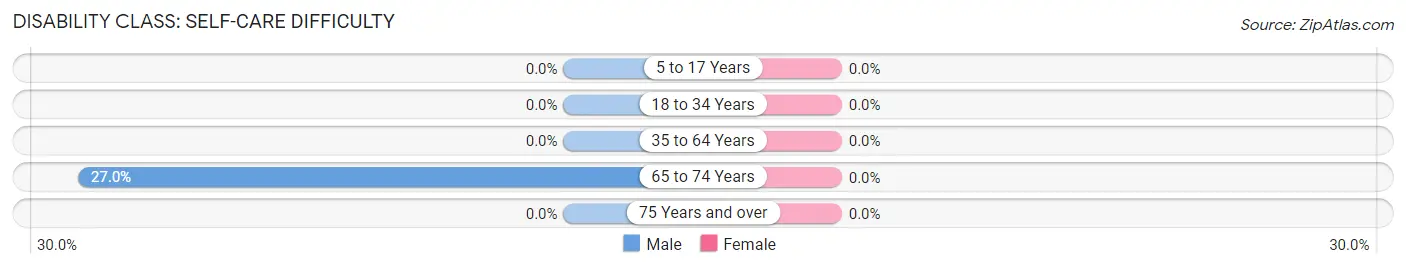
| Age Bracket | Male | Female |
| 5 to 17 Years | 0 (0.0%) | 0 (0.0%) |
| 18 to 34 Years | 0 (0.0%) | 0 (0.0%) |
| 35 to 64 Years | 0 (0.0%) | 0 (0.0%) |
| 65 to 74 Years | 10 (27.0%) | 0 (0.0%) |
| 75 Years and over | 0 (0.0%) | 0 (0.0%) |
Technology Access in New Bedford
Computing Device Access in New Bedford
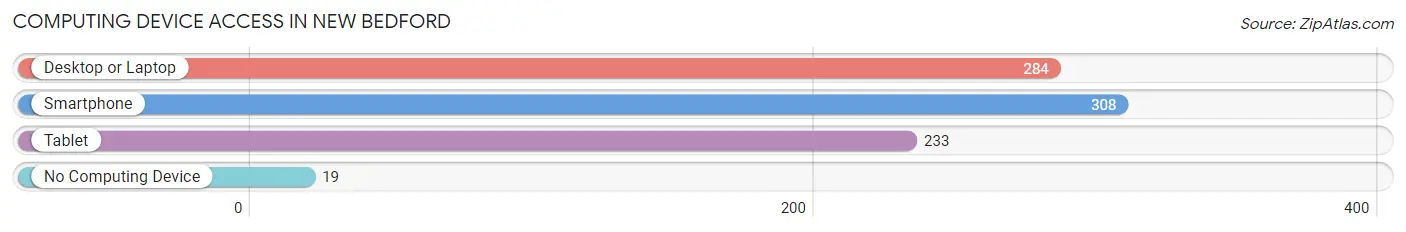
| Device Type | # Households | % Households |
| Desktop or Laptop | 284 | 84.5% |
| Smartphone | 308 | 91.7% |
| Tablet | 233 | 69.4% |
| No Computing Device | 19 | 5.7% |
| Total | 336 | 100.0% |
Internet Access in New Bedford
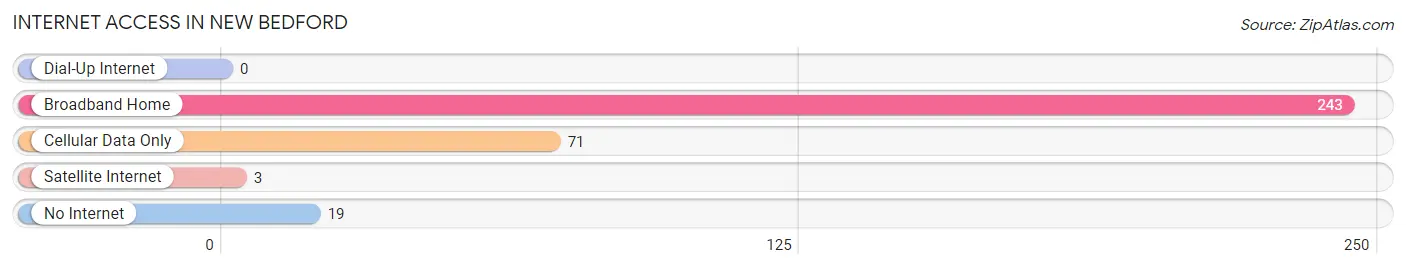
| Internet Type | # Households | % Households |
| Dial-Up Internet | 0 | 0.0% |
| Broadband Home | 243 | 72.3% |
| Cellular Data Only | 71 | 21.1% |
| Satellite Internet | 3 | 0.9% |
| No Internet | 19 | 5.7% |
| Total | 336 | 100.0% |
New Bedford Summary
New Bedford, Pennsylvania is a small borough located in Bedford County, Pennsylvania. It is situated in the foothills of the Allegheny Mountains, approximately 50 miles east of Pittsburgh. The borough is home to a population of approximately 1,000 people, and is known for its rural charm and small-town atmosphere.
History
New Bedford was founded in 1795 by a group of settlers from Bedford County, Pennsylvania. The town was named after the city of New Bedford, Massachusetts, which was the birthplace of many of the settlers. The town was originally a farming community, and the settlers built a grist mill and a sawmill to help support the local economy.
In 1820, the town was incorporated as a borough. The town continued to grow and prosper, and by the late 19th century, it had become a popular tourist destination. The town was known for its scenic beauty, and many visitors came to enjoy the natural beauty of the area.
In the early 20th century, the town began to decline in population as many of the residents moved away to larger cities. However, the town has seen a resurgence in recent years, and is now home to a vibrant community of artists, entrepreneurs, and small business owners.
Geography
New Bedford is located in the foothills of the Allegheny Mountains in Bedford County, Pennsylvania. The borough is situated on the banks of the Raystown Branch of the Juniata River. The town is surrounded by rolling hills and lush forests, and is home to a variety of wildlife.
The borough is located approximately 50 miles east of Pittsburgh, and is accessible by car via the Pennsylvania Turnpike and US Route 30. The nearest major airport is the Pittsburgh International Airport, which is located approximately 70 miles away.
Economy
The economy of New Bedford is largely based on tourism and small businesses. The town is home to a variety of small businesses, including restaurants, shops, and galleries. The town is also home to a number of bed and breakfasts, which attract visitors from all over the country.
The town is also home to a number of manufacturing companies, including a furniture factory and a metal fabrication plant. The town is also home to a number of farms, which produce a variety of crops, including corn, soybeans, and hay.
Demographics
As of the 2010 census, the population of New Bedford was 1,000 people. The racial makeup of the town was 97.2% White, 0.7% African American, 0.2% Native American, 0.2% Asian, 0.2% from other races, and 1.7% from two or more races. Hispanic or Latino of any race were 0.7% of the population.
The median household income in New Bedford was $37,500, and the median family income was $45,000. The per capita income for the town was $19,000. About 11.2% of families and 14.2% of the population were below the poverty line, including 18.2% of those under age 18 and 8.3% of those age 65 or over.
New Bedford is a small, rural borough with a rich history and a vibrant community. The town is home to a variety of businesses, and is a popular tourist destination. The town is also home to a diverse population, and is a great place to live and work.
Common Questions
What is Per Capita Income in New Bedford?
Per Capita income in New Bedford is $30,788.
What is the Median Family Income in New Bedford?
Median Family Income in New Bedford is $74,914.
What is the Median Household income in New Bedford?
Median Household Income in New Bedford is $72,672.
What is Income or Wage Gap in New Bedford?
Income or Wage Gap in New Bedford is 47.9%.
Women in New Bedford earn 52.1 cents for every dollar earned by a man.
What is Inequality or Gini Index in New Bedford?
Inequality or Gini Index in New Bedford is 0.34.
What is the Total Population of New Bedford?
Total Population of New Bedford is 875.
What is the Total Male Population of New Bedford?
Total Male Population of New Bedford is 464.
What is the Total Female Population of New Bedford?
Total Female Population of New Bedford is 411.
What is the Ratio of Males per 100 Females in New Bedford?
There are 112.90 Males per 100 Females in New Bedford.
What is the Ratio of Females per 100 Males in New Bedford?
There are 88.58 Females per 100 Males in New Bedford.
What is the Median Population Age in New Bedford?
Median Population Age in New Bedford is 40.4 Years.
What is the Average Family Size in New Bedford
Average Family Size in New Bedford is 3.2 People.
What is the Average Household Size in New Bedford
Average Household Size in New Bedford is 2.6 People.
How Large is the Labor Force in New Bedford?
There are 377 People in the Labor Forcein in New Bedford.
What is the Percentage of People in the Labor Force in New Bedford?
57.5% of People are in the Labor Force in New Bedford.