Atlasburg, PA Map & Demographics
Atlasburg Map
Atlasburg Overview
$34,034
PER CAPITA INCOME
$148,750
AVG FAMILY INCOME
$65,625
AVG HOUSEHOLD INCOME
40.0%
WAGE / INCOME GAP [ % ]
60.0¢/ $1
WAGE / INCOME GAP [ $ ]
0.36
INEQUALITY / GINI INDEX
556
TOTAL POPULATION
283
MALE POPULATION
273
FEMALE POPULATION
103.66
MALES / 100 FEMALES
96.47
FEMALES / 100 MALES
37.7
MEDIAN AGE
3.9
AVG FAMILY SIZE
2.9
AVG HOUSEHOLD SIZE
314
LABOR FORCE [ PEOPLE ]
72.5%
PERCENT IN LABOR FORCE
Atlasburg Zip Codes
Atlasburg Area Codes
Income in Atlasburg
Income Overview in Atlasburg
Per Capita Income in Atlasburg is $34,034, while median incomes of families and households are $148,750 and $65,625 respectively.
| Characteristic | Number | Measure |
| Per Capita Income | 556 | $34,034 |
| Median Family Income | 107 | $148,750 |
| Mean Family Income | 107 | $114,129 |
| Median Household Income | 193 | $65,625 |
| Mean Household Income | 193 | $87,880 |
| Income Deficit | 107 | $0 |
| Wage / Income Gap (%) | 556 | 40.01% |
| Wage / Income Gap ($) | 556 | 59.99¢ per $1 |
| Gini / Inequality Index | 556 | 0.36 |
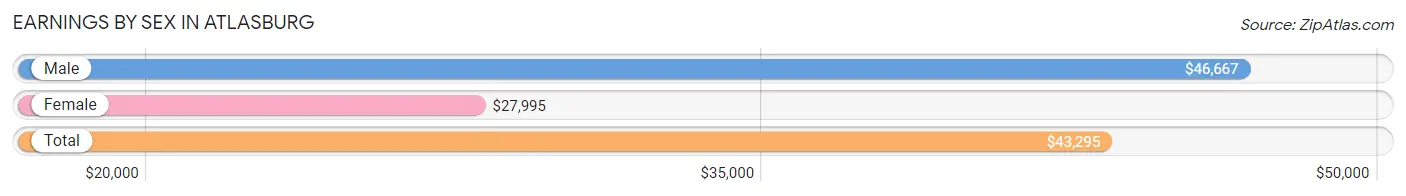
Earnings by Sex in Atlasburg
Average Earnings in Atlasburg are $43,295, $46,667 for men and $27,995 for women, a difference of 40.0%.
| Sex | Number | Average Earnings |
| Male | 188 (52.4%) | $46,667 |
| Female | 171 (47.6%) | $27,995 |
| Total | 359 (100.0%) | $43,295 |
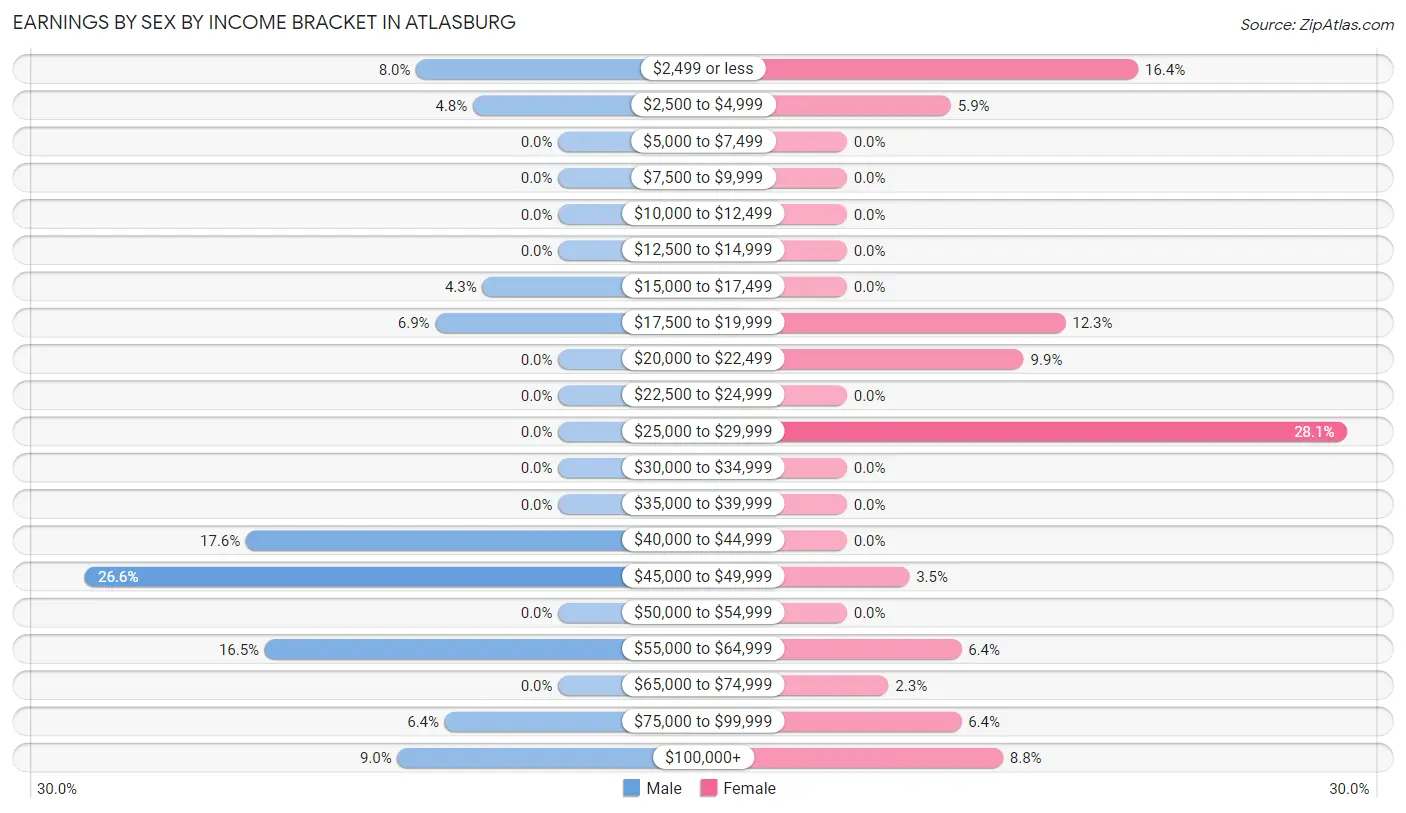
Earnings by Sex by Income Bracket in Atlasburg
The most common earnings brackets in Atlasburg are $45,000 to $49,999 for men (50 | 26.6%) and $25,000 to $29,999 for women (48 | 28.1%).
| Income | Male | Female |
| $2,499 or less | 15 (8.0%) | 28 (16.4%) |
| $2,500 to $4,999 | 9 (4.8%) | 10 (5.9%) |
| $5,000 to $7,499 | 0 (0.0%) | 0 (0.0%) |
| $7,500 to $9,999 | 0 (0.0%) | 0 (0.0%) |
| $10,000 to $12,499 | 0 (0.0%) | 0 (0.0%) |
| $12,500 to $14,999 | 0 (0.0%) | 0 (0.0%) |
| $15,000 to $17,499 | 8 (4.3%) | 0 (0.0%) |
| $17,500 to $19,999 | 13 (6.9%) | 21 (12.3%) |
| $20,000 to $22,499 | 0 (0.0%) | 17 (9.9%) |
| $22,500 to $24,999 | 0 (0.0%) | 0 (0.0%) |
| $25,000 to $29,999 | 0 (0.0%) | 48 (28.1%) |
| $30,000 to $34,999 | 0 (0.0%) | 0 (0.0%) |
| $35,000 to $39,999 | 0 (0.0%) | 0 (0.0%) |
| $40,000 to $44,999 | 33 (17.5%) | 0 (0.0%) |
| $45,000 to $49,999 | 50 (26.6%) | 6 (3.5%) |
| $50,000 to $54,999 | 0 (0.0%) | 0 (0.0%) |
| $55,000 to $64,999 | 31 (16.5%) | 11 (6.4%) |
| $65,000 to $74,999 | 0 (0.0%) | 4 (2.3%) |
| $75,000 to $99,999 | 12 (6.4%) | 11 (6.4%) |
| $100,000+ | 17 (9.0%) | 15 (8.8%) |
| Total | 188 (100.0%) | 171 (100.0%) |
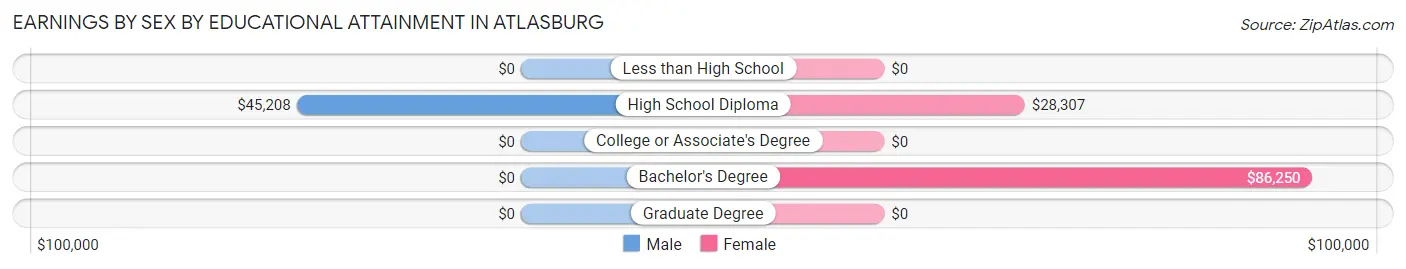
Earnings by Sex by Educational Attainment in Atlasburg
Average earnings in Atlasburg are $48,077 for men and $28,542 for women, a difference of 40.6%. Men with an educational attainment of high school diploma enjoy the highest average annual earnings of $45,208, while those with high school diploma education earn the least with $45,208. Women with an educational attainment of bachelor's degree earn the most with the average annual earnings of $86,250, while those with high school diploma education have the smallest earnings of $28,307.
| Educational Attainment | Male Income | Female Income |
| Less than High School | - | - |
| High School Diploma | $45,208 | $28,307 |
| College or Associate's Degree | - | - |
| Bachelor's Degree | - | - |
| Graduate Degree | - | - |
| Total | $48,077 | $28,542 |
Family Income in Atlasburg
Family Income Brackets in Atlasburg
According to the Atlasburg family income data, there are 52 families falling into the $150,000 to $199,999 income range, which is the most common income bracket and makes up 48.6% of all families.
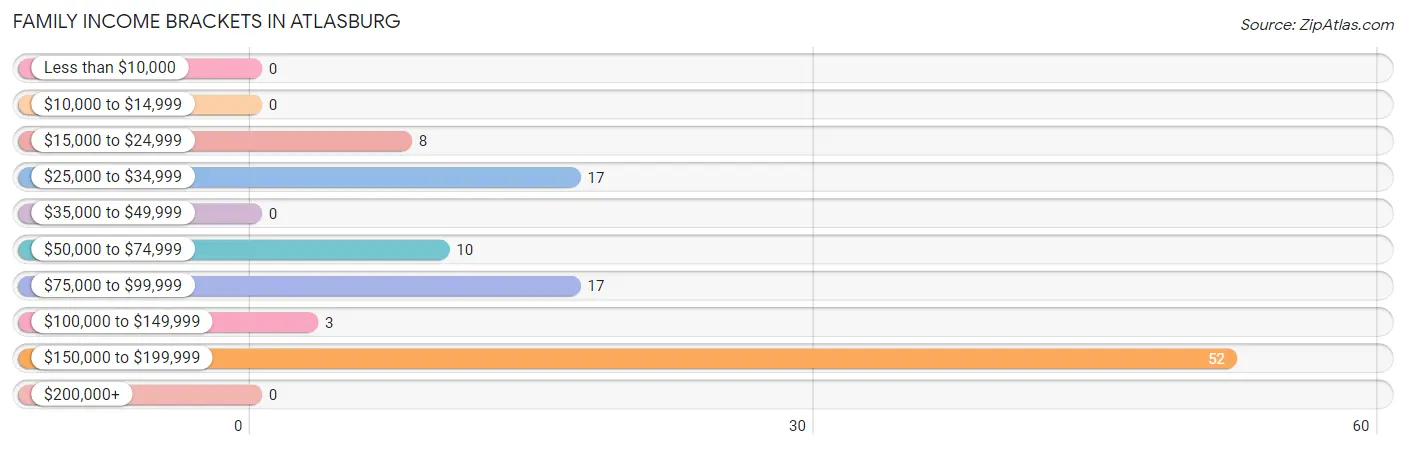
| Income Bracket | # Families | % Families |
| Less than $10,000 | 0 | 0.0% |
| $10,000 to $14,999 | 0 | 0.0% |
| $15,000 to $24,999 | 8 | 7.5% |
| $25,000 to $34,999 | 17 | 15.9% |
| $35,000 to $49,999 | 0 | 0.0% |
| $50,000 to $74,999 | 10 | 9.3% |
| $75,000 to $99,999 | 17 | 15.9% |
| $100,000 to $149,999 | 3 | 2.8% |
| $150,000 to $199,999 | 52 | 48.6% |
| $200,000+ | 0 | 0.0% |
Family Income by Famaliy Size in Atlasburg
4-person families (33 | 30.8%) account for the highest median family income in Atlasburg with $166,354 per family, while 4-person families (33 | 30.8%) have the highest median income of $41,588 per family member.
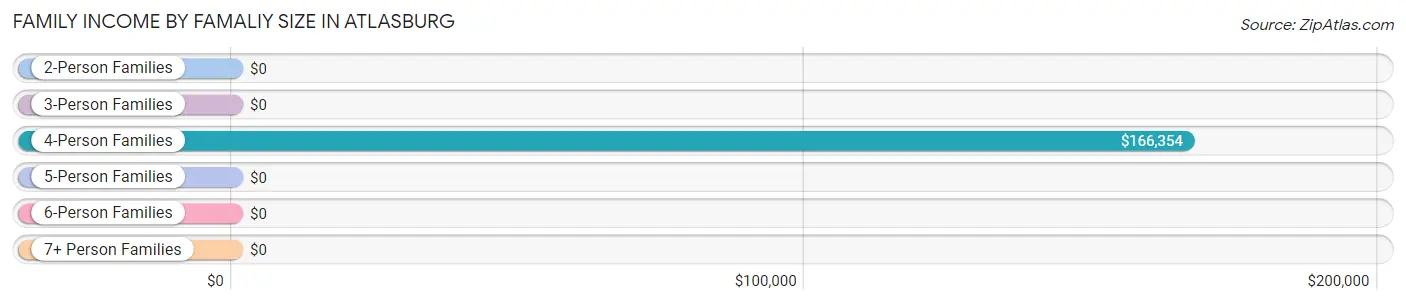
| Income Bracket | # Families | Median Income |
| 2-Person Families | 31 (29.0%) | $0 |
| 3-Person Families | 11 (10.3%) | $0 |
| 4-Person Families | 33 (30.8%) | $166,354 |
| 5-Person Families | 32 (29.9%) | $0 |
| 6-Person Families | 0 (0.0%) | $0 |
| 7+ Person Families | 0 (0.0%) | $0 |
| Total | 107 (100.0%) | $148,750 |
Family Income by Number of Earners in Atlasburg
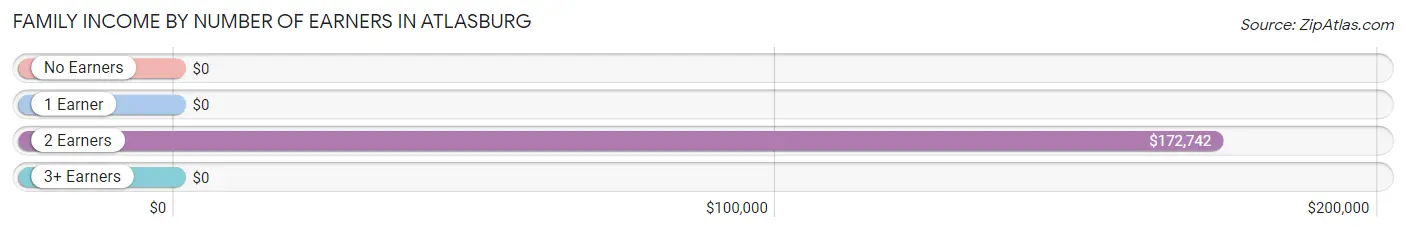
| Number of Earners | # Families | Median Income |
| No Earners | 9 (8.4%) | $0 |
| 1 Earner | 25 (23.4%) | $0 |
| 2 Earners | 56 (52.3%) | $172,742 |
| 3+ Earners | 17 (15.9%) | $0 |
| Total | 107 (100.0%) | $148,750 |
Household Income in Atlasburg
Household Income Brackets in Atlasburg
With 52 households falling in the category, the $150,000 to $199,999 income range is the most frequent in Atlasburg, accounting for 26.9% of all households.
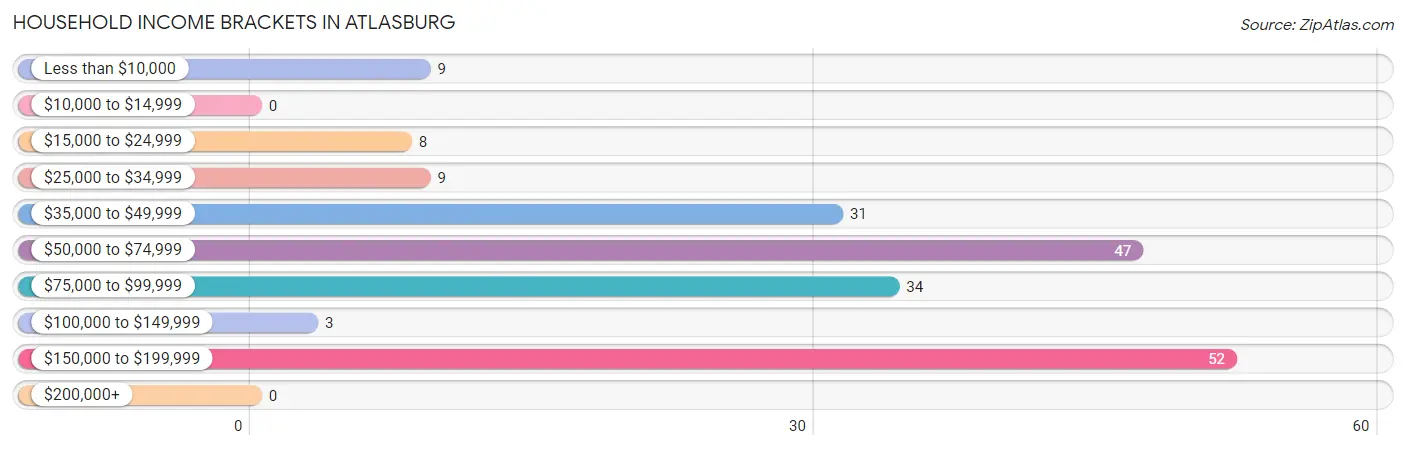
| Income Bracket | # Households | % Households |
| Less than $10,000 | 9 | 4.7% |
| $10,000 to $14,999 | 0 | 0.0% |
| $15,000 to $24,999 | 8 | 4.1% |
| $25,000 to $34,999 | 9 | 4.7% |
| $35,000 to $49,999 | 31 | 16.1% |
| $50,000 to $74,999 | 47 | 24.4% |
| $75,000 to $99,999 | 34 | 17.6% |
| $100,000 to $149,999 | 3 | 1.6% |
| $150,000 to $199,999 | 52 | 26.9% |
| $200,000+ | 0 | 0.0% |
Household Income by Householder Age in Atlasburg
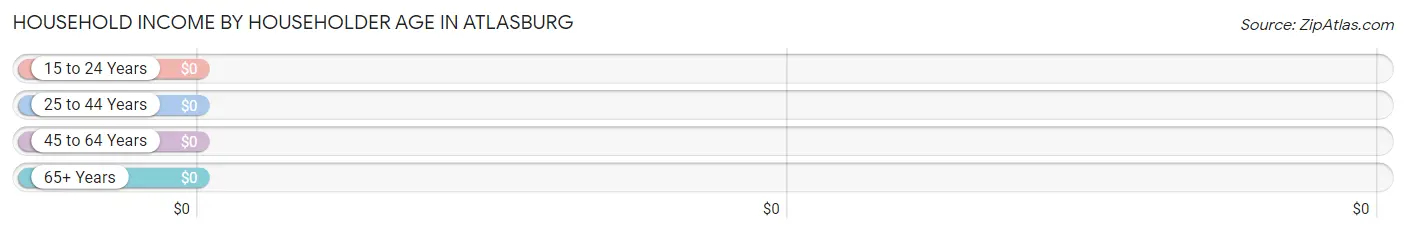
| Income Bracket | # Households | Median Income |
| 15 to 24 Years | 0 (0.0%) | $0 |
| 25 to 44 Years | 77 (39.9%) | $0 |
| 45 to 64 Years | 97 (50.3%) | $0 |
| 65+ Years | 19 (9.8%) | $0 |
| Total | 193 (100.0%) | $65,625 |
Poverty in Atlasburg
Income Below Poverty by Sex and Age in Atlasburg
With 8.5% poverty level for males and 12.4% for females among the residents of Atlasburg, 55 to 64 year old males and 5 year old females are the most vulnerable to poverty, with 9 males (31.0%) and 6 females (100.0%) in their respective age groups living below the poverty level.
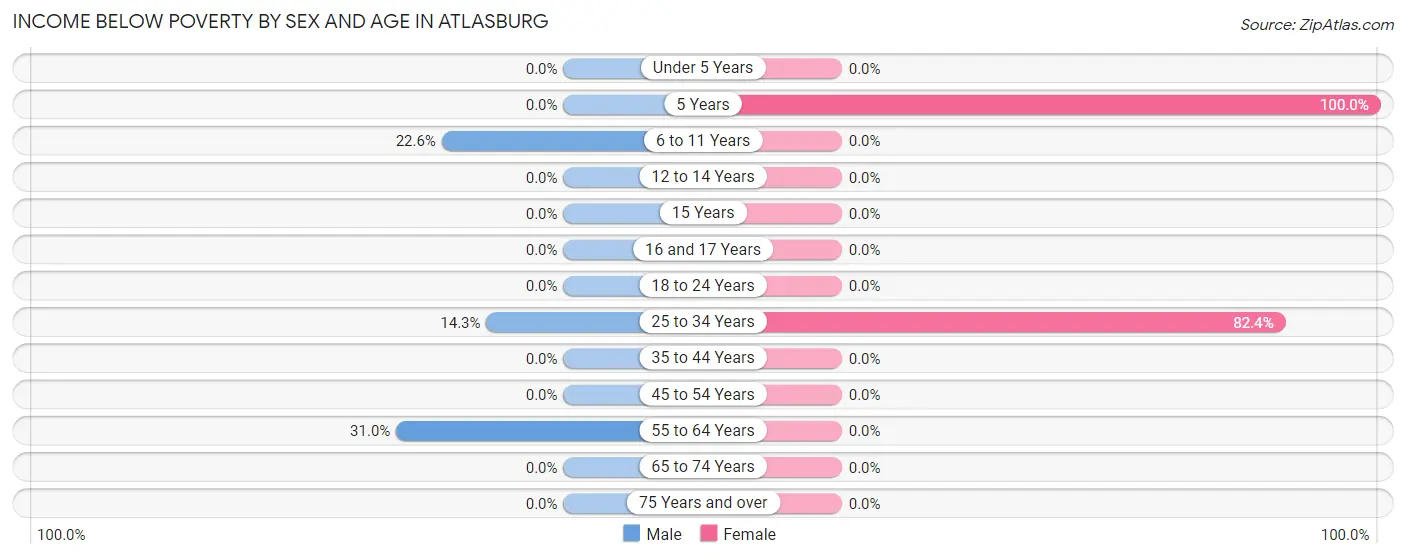
| Age Bracket | Male | Female |
| Under 5 Years | 0 (0.0%) | 0 (0.0%) |
| 5 Years | 0 (0.0%) | 6 (100.0%) |
| 6 to 11 Years | 7 (22.6%) | 0 (0.0%) |
| 12 to 14 Years | 0 (0.0%) | 0 (0.0%) |
| 15 Years | 0 (0.0%) | 0 (0.0%) |
| 16 and 17 Years | 0 (0.0%) | 0 (0.0%) |
| 18 to 24 Years | 0 (0.0%) | 0 (0.0%) |
| 25 to 34 Years | 8 (14.3%) | 28 (82.4%) |
| 35 to 44 Years | 0 (0.0%) | 0 (0.0%) |
| 45 to 54 Years | 0 (0.0%) | 0 (0.0%) |
| 55 to 64 Years | 9 (31.0%) | 0 (0.0%) |
| 65 to 74 Years | 0 (0.0%) | 0 (0.0%) |
| 75 Years and over | 0 (0.0%) | 0 (0.0%) |
| Total | 24 (8.5%) | 34 (12.4%) |
Income Above Poverty by Sex and Age in Atlasburg
According to the poverty statistics in Atlasburg, males aged under 5 years and females aged 6 to 11 years are the age groups that are most secure financially, with 100.0% of males and 100.0% of females in these age groups living above the poverty line.
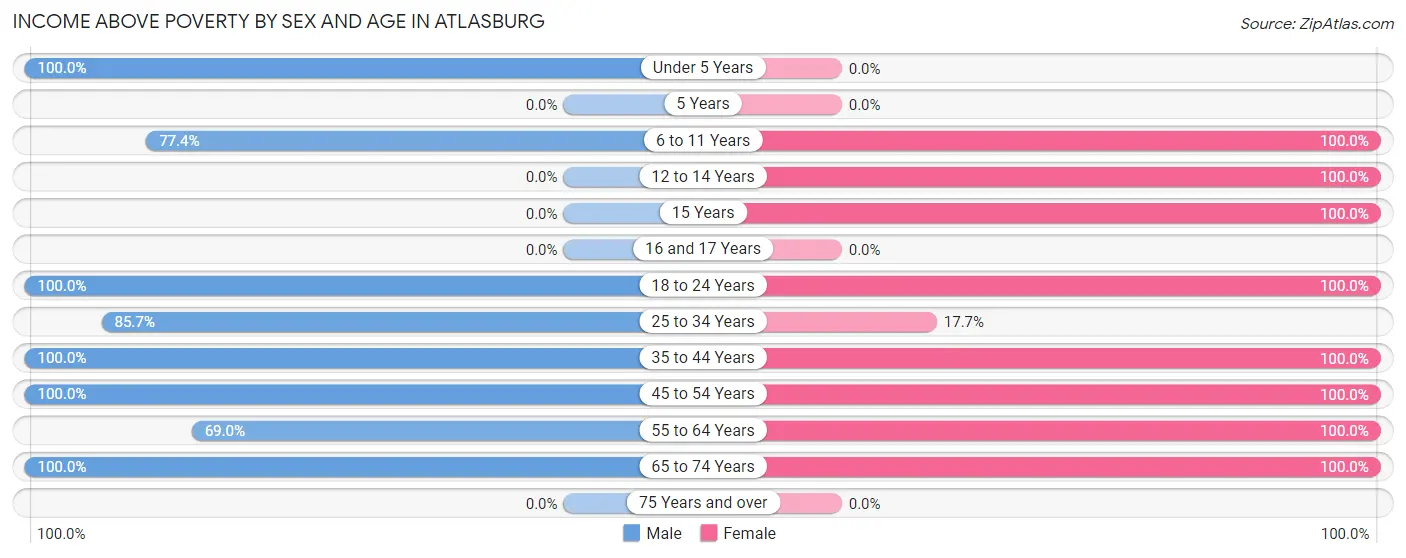
| Age Bracket | Male | Female |
| Under 5 Years | 24 (100.0%) | 0 (0.0%) |
| 5 Years | 0 (0.0%) | 0 (0.0%) |
| 6 to 11 Years | 24 (77.4%) | 30 (100.0%) |
| 12 to 14 Years | 0 (0.0%) | 10 (100.0%) |
| 15 Years | 0 (0.0%) | 22 (100.0%) |
| 16 and 17 Years | 0 (0.0%) | 0 (0.0%) |
| 18 to 24 Years | 28 (100.0%) | 29 (100.0%) |
| 25 to 34 Years | 48 (85.7%) | 6 (17.6%) |
| 35 to 44 Years | 64 (100.0%) | 41 (100.0%) |
| 45 to 54 Years | 18 (100.0%) | 65 (100.0%) |
| 55 to 64 Years | 20 (69.0%) | 11 (100.0%) |
| 65 to 74 Years | 33 (100.0%) | 25 (100.0%) |
| 75 Years and over | 0 (0.0%) | 0 (0.0%) |
| Total | 259 (91.5%) | 239 (87.5%) |
Income Below Poverty Among Married-Couple Families in Atlasburg
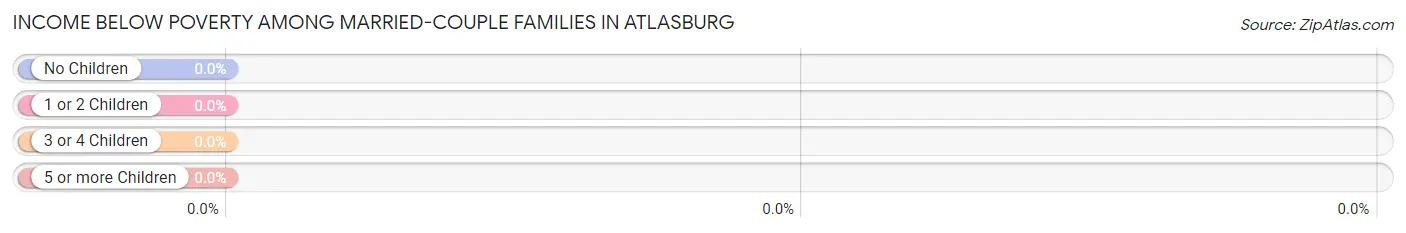
| Children | Above Poverty | Below Poverty |
| No Children | 17 (100.0%) | 0 (0.0%) |
| 1 or 2 Children | 55 (100.0%) | 0 (0.0%) |
| 3 or 4 Children | 0 (0.0%) | 0 (0.0%) |
| 5 or more Children | 0 (0.0%) | 0 (0.0%) |
| Total | 72 (100.0%) | 0 (0.0%) |
Income Below Poverty Among Single-Parent Households in Atlasburg
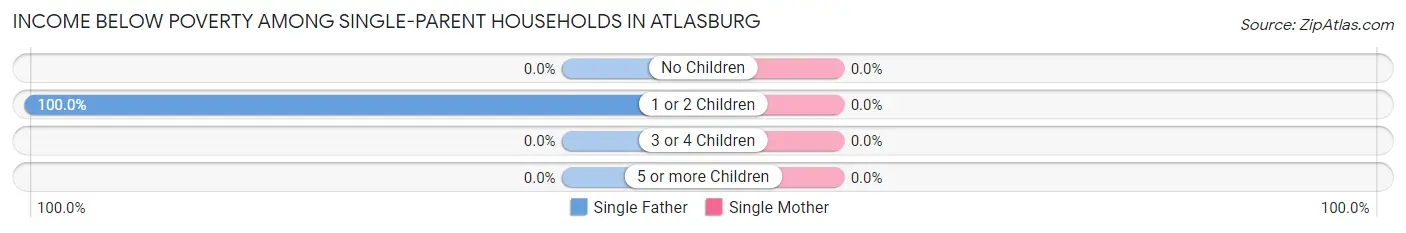
| Children | Single Father | Single Mother |
| No Children | 0 (0.0%) | 0 (0.0%) |
| 1 or 2 Children | 8 (100.0%) | 0 (0.0%) |
| 3 or 4 Children | 0 (0.0%) | 0 (0.0%) |
| 5 or more Children | 0 (0.0%) | 0 (0.0%) |
| Total | 8 (100.0%) | 0 (0.0%) |
Income Below Poverty Among Married-Couple vs Single-Parent Households in Atlasburg
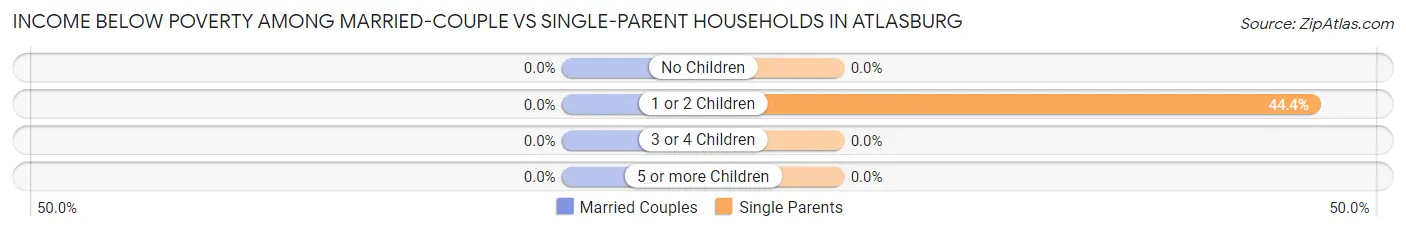
| Children | Married-Couple Families | Single-Parent Households |
| No Children | 0 (0.0%) | 0 (0.0%) |
| 1 or 2 Children | 0 (0.0%) | 8 (44.4%) |
| 3 or 4 Children | 0 (0.0%) | 0 (0.0%) |
| 5 or more Children | 0 (0.0%) | 0 (0.0%) |
| Total | 0 (0.0%) | 8 (22.9%) |
Race in Atlasburg
The most populous races in Atlasburg are White / Caucasian (441 | 79.3%), Some other Race (75 | 13.5%), and Black / African American (18 | 3.2%).
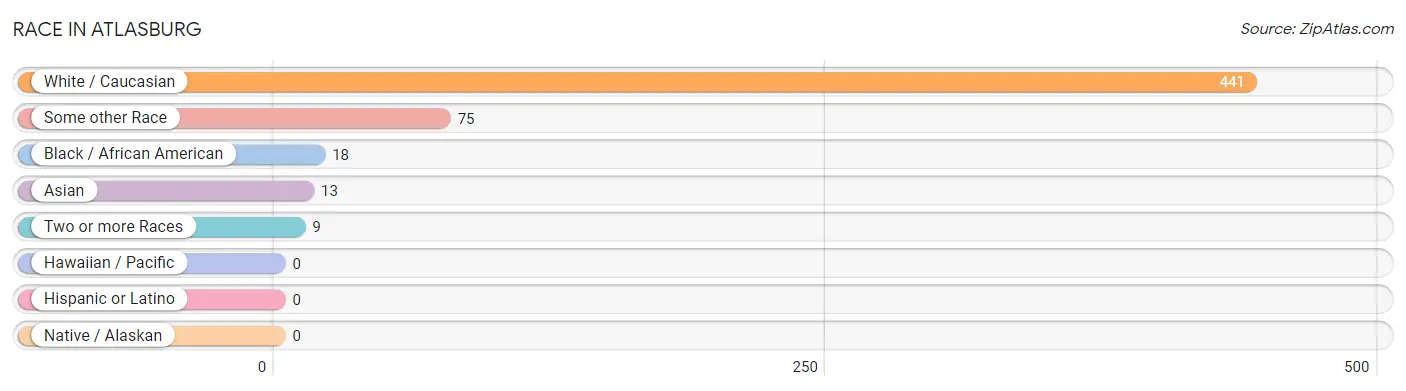
| Race | # Population | % Population |
| Asian | 13 | 2.3% |
| Black / African American | 18 | 3.2% |
| Hawaiian / Pacific | 0 | 0.0% |
| Hispanic or Latino | 0 | 0.0% |
| Native / Alaskan | 0 | 0.0% |
| White / Caucasian | 441 | 79.3% |
| Two or more Races | 9 | 1.6% |
| Some other Race | 75 | 13.5% |
| Total | 556 | 100.0% |
Ancestry in Atlasburg
The most populous ancestries reported in Atlasburg are German (158 | 28.4%), Irish (117 | 21.0%), Italian (84 | 15.1%), American (75 | 13.5%), and Czech (39 | 7.0%), together accounting for 85.1% of all Atlasburg residents.
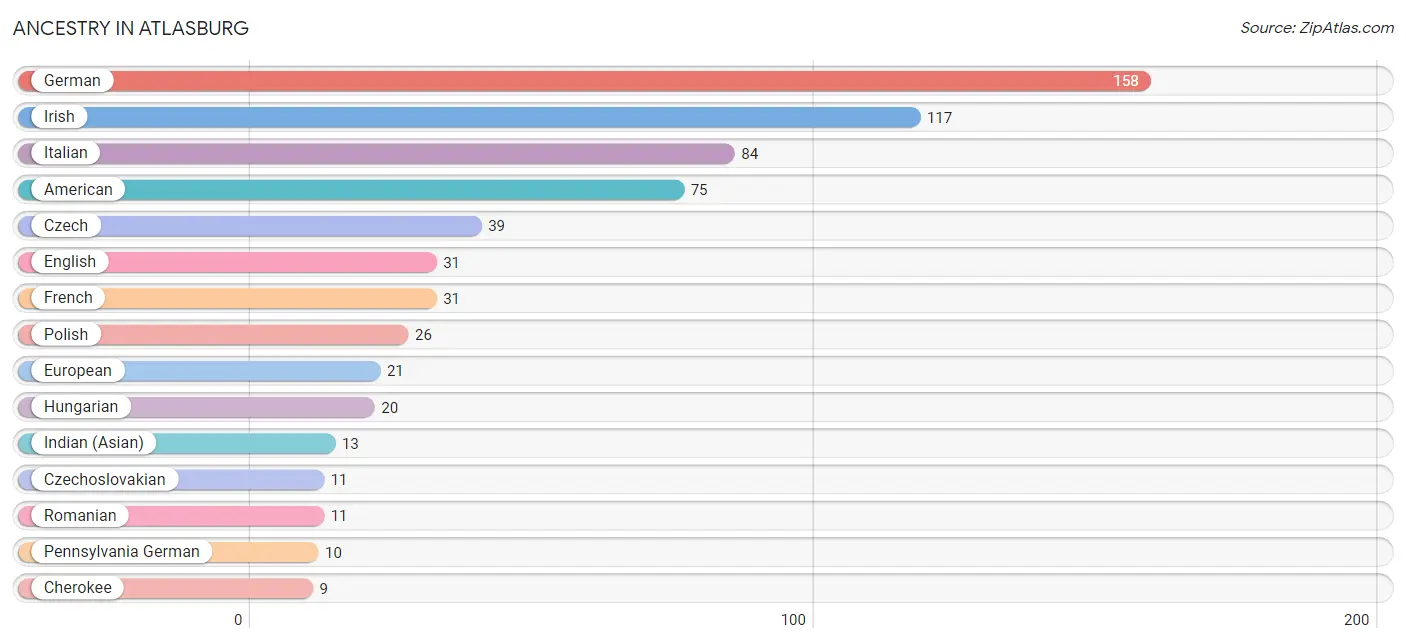
| Ancestry | # Population | % Population |
| American | 75 | 13.5% |
| Cherokee | 9 | 1.6% |
| Czech | 39 | 7.0% |
| Czechoslovakian | 11 | 2.0% |
| English | 31 | 5.6% |
| European | 21 | 3.8% |
| French | 31 | 5.6% |
| German | 158 | 28.4% |
| Hungarian | 20 | 3.6% |
| Indian (Asian) | 13 | 2.3% |
| Irish | 117 | 21.0% |
| Italian | 84 | 15.1% |
| Pennsylvania German | 10 | 1.8% |
| Polish | 26 | 4.7% |
| Romanian | 11 | 2.0% |
| Russian | 9 | 1.6% |
| Scotch-Irish | 8 | 1.4% | View All 17 Rows |
Immigrants in Atlasburg

| Immigration Origin | # Population | % Population | View All 0 Rows |
Sex and Age in Atlasburg
Sex and Age in Atlasburg
The most populous age groups in Atlasburg are 25 to 29 Years (48 | 17.0%) for men and 45 to 49 Years (34 | 12.4%) for women.
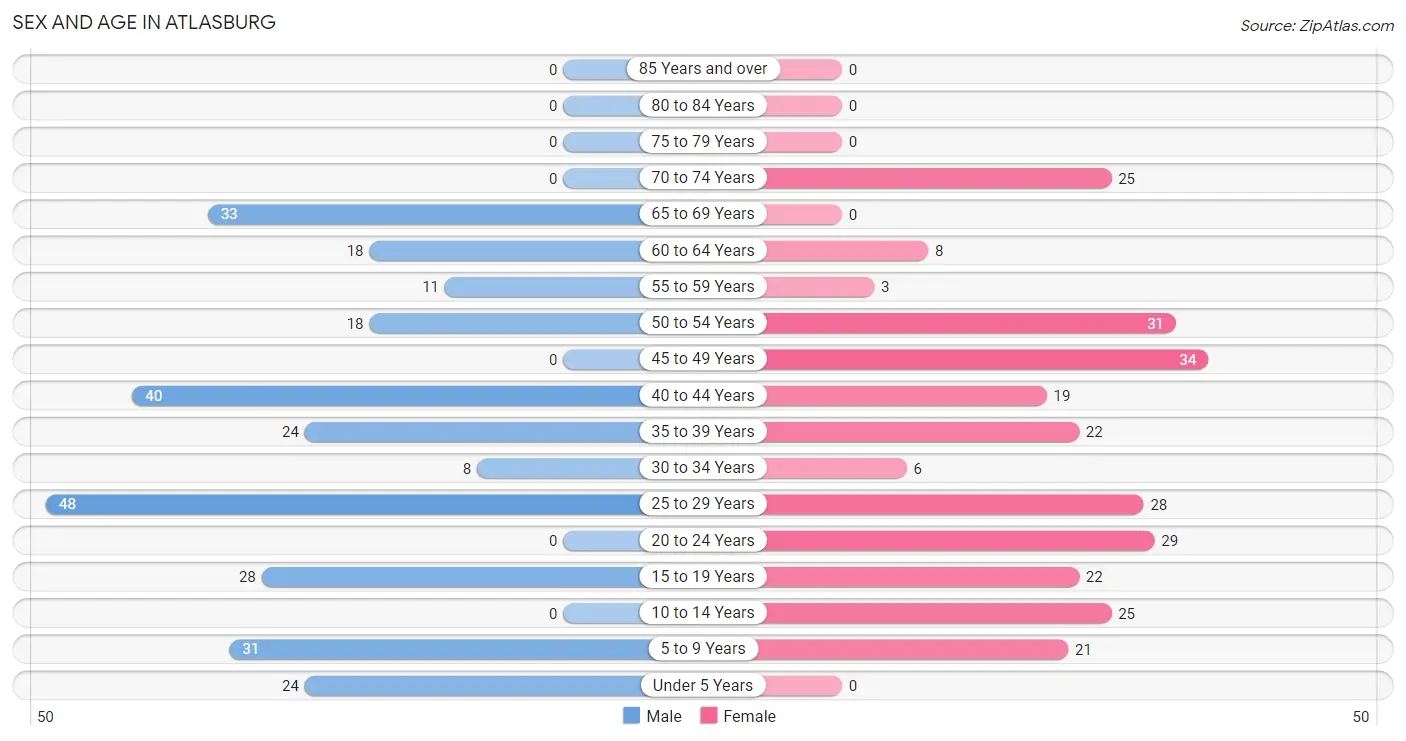
| Age Bracket | Male | Female |
| Under 5 Years | 24 (8.5%) | 0 (0.0%) |
| 5 to 9 Years | 31 (11.0%) | 21 (7.7%) |
| 10 to 14 Years | 0 (0.0%) | 25 (9.2%) |
| 15 to 19 Years | 28 (9.9%) | 22 (8.1%) |
| 20 to 24 Years | 0 (0.0%) | 29 (10.6%) |
| 25 to 29 Years | 48 (17.0%) | 28 (10.3%) |
| 30 to 34 Years | 8 (2.8%) | 6 (2.2%) |
| 35 to 39 Years | 24 (8.5%) | 22 (8.1%) |
| 40 to 44 Years | 40 (14.1%) | 19 (7.0%) |
| 45 to 49 Years | 0 (0.0%) | 34 (12.4%) |
| 50 to 54 Years | 18 (6.4%) | 31 (11.4%) |
| 55 to 59 Years | 11 (3.9%) | 3 (1.1%) |
| 60 to 64 Years | 18 (6.4%) | 8 (2.9%) |
| 65 to 69 Years | 33 (11.7%) | 0 (0.0%) |
| 70 to 74 Years | 0 (0.0%) | 25 (9.2%) |
| 75 to 79 Years | 0 (0.0%) | 0 (0.0%) |
| 80 to 84 Years | 0 (0.0%) | 0 (0.0%) |
| 85 Years and over | 0 (0.0%) | 0 (0.0%) |
| Total | 283 (100.0%) | 273 (100.0%) |
Families and Households in Atlasburg
Median Family Size in Atlasburg
The median family size in Atlasburg is 3.94 persons per family, with married-couple families (72 | 67.3%) accounting for the largest median family size of 4.46 persons per family. On the other hand, single male/father families (8 | 7.5%) represent the smallest median family size with 2.63 persons per family.
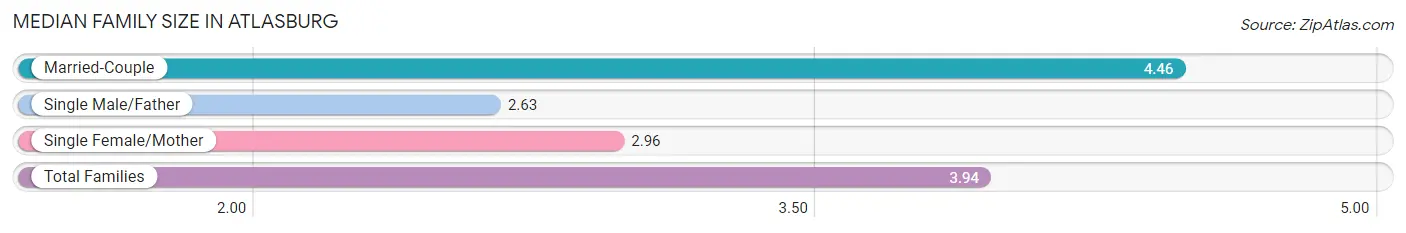
| Family Type | # Families | Family Size |
| Married-Couple | 72 (67.3%) | 4.46 |
| Single Male/Father | 8 (7.5%) | 2.63 |
| Single Female/Mother | 27 (25.2%) | 2.96 |
| Total Families | 107 (100.0%) | 3.94 |
Median Household Size in Atlasburg
The median household size in Atlasburg is 2.88 persons per household, with married-couple households (72 | 37.3%) accounting for the largest median household size of 4.46 persons per household. non-family households (86 | 44.6%) represent the smallest median household size with 1.33 persons per household.
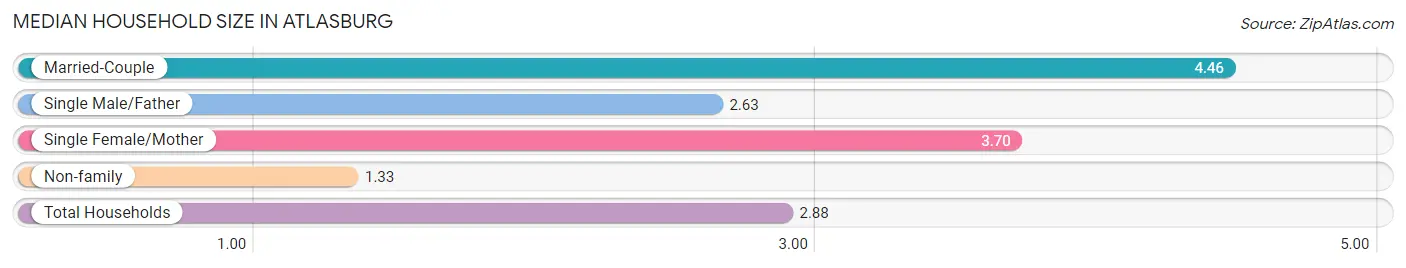
| Household Type | # Households | Household Size |
| Married-Couple | 72 (37.3%) | 4.46 |
| Single Male/Father | 8 (4.2%) | 2.63 |
| Single Female/Mother | 27 (14.0%) | 3.70 |
| Non-family | 86 (44.6%) | 1.33 |
| Total Households | 193 (100.0%) | 2.88 |
Household Size by Marriage Status in Atlasburg
Out of a total of 193 households in Atlasburg, 107 (55.4%) are family households, while 86 (44.6%) are nonfamily households. The most numerous type of family households are 4-person households, comprising 33, and the most common type of nonfamily households are 1-person households, comprising 60.
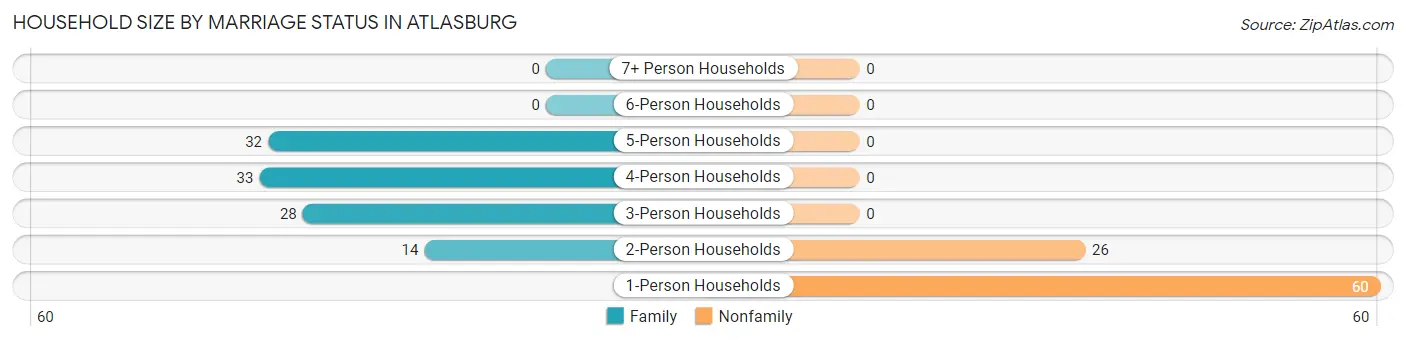
| Household Size | Family Households | Nonfamily Households |
| 1-Person Households | - | 60 (31.1%) |
| 2-Person Households | 14 (7.2%) | 26 (13.5%) |
| 3-Person Households | 28 (14.5%) | 0 (0.0%) |
| 4-Person Households | 33 (17.1%) | 0 (0.0%) |
| 5-Person Households | 32 (16.6%) | 0 (0.0%) |
| 6-Person Households | 0 (0.0%) | 0 (0.0%) |
| 7+ Person Households | 0 (0.0%) | 0 (0.0%) |
| Total | 107 (55.4%) | 86 (44.6%) |
Female Fertility in Atlasburg
Fertility by Age in Atlasburg
| Age Bracket | Women with Births | Births / 1,000 Women |
| 15 to 19 years | 0 (0.0%) | 0.0 |
| 20 to 34 years | 0 (0.0%) | 0.0 |
| 35 to 50 years | 0 (0.0%) | 0.0 |
| Total | 0 (0.0%) | 0.0 |
Fertility by Age by Marriage Status in Atlasburg
| Age Bracket | Married | Unmarried |
| 15 to 19 years | 0 (0.0%) | 0 (0.0%) |
| 20 to 34 years | 0 (0.0%) | 0 (0.0%) |
| 35 to 50 years | 0 (0.0%) | 0 (0.0%) |
| Total | 0 (0.0%) | 0 (0.0%) |
Fertility by Education in Atlasburg
| Educational Attainment | Women with Births | Births / 1,000 Women |
| Less than High School | 0 (0.0%) | 0.0 |
| High School Diploma | 0 (0.0%) | 0.0 |
| College or Associate's Degree | 0 (0.0%) | 0.0 |
| Bachelor's Degree | 0 (0.0%) | 0.0 |
| Graduate Degree | 0 (0.0%) | 0.0 |
| Total | 0 (0.0%) | 0.0 |
Fertility by Education by Marriage Status in Atlasburg
| Educational Attainment | Married | Unmarried |
| Less than High School | 0 (0.0%) | 0 (0.0%) |
| High School Diploma | 0 (0.0%) | 0 (0.0%) |
| College or Associate's Degree | 0 (0.0%) | 0 (0.0%) |
| Bachelor's Degree | 0 (0.0%) | 0 (0.0%) |
| Graduate Degree | 0 (0.0%) | 0 (0.0%) |
| Total | 0 (0.0%) | 0 (0.0%) |
Employment Characteristics in Atlasburg
Employment by Class of Employer in Atlasburg
Among the 314 employed individuals in Atlasburg, private company employees (214 | 68.1%), local government employees (58 | 18.5%), and not-for-profit organizations (31 | 9.9%) make up the most common classes of employment.
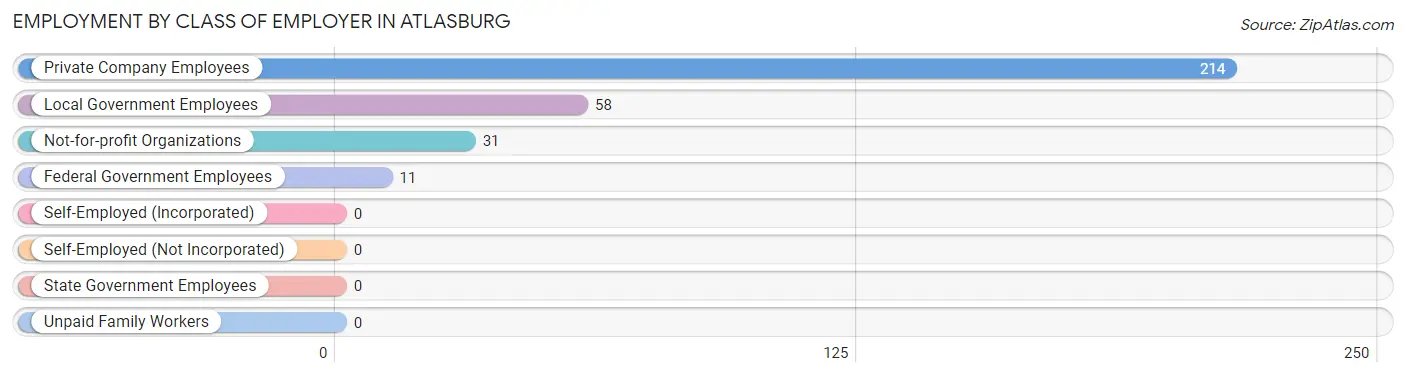
| Employer Class | # Employees | % Employees |
| Private Company Employees | 214 | 68.1% |
| Self-Employed (Incorporated) | 0 | 0.0% |
| Self-Employed (Not Incorporated) | 0 | 0.0% |
| Not-for-profit Organizations | 31 | 9.9% |
| Local Government Employees | 58 | 18.5% |
| State Government Employees | 0 | 0.0% |
| Federal Government Employees | 11 | 3.5% |
| Unpaid Family Workers | 0 | 0.0% |
| Total | 314 | 100.0% |
Employment Status by Age in Atlasburg
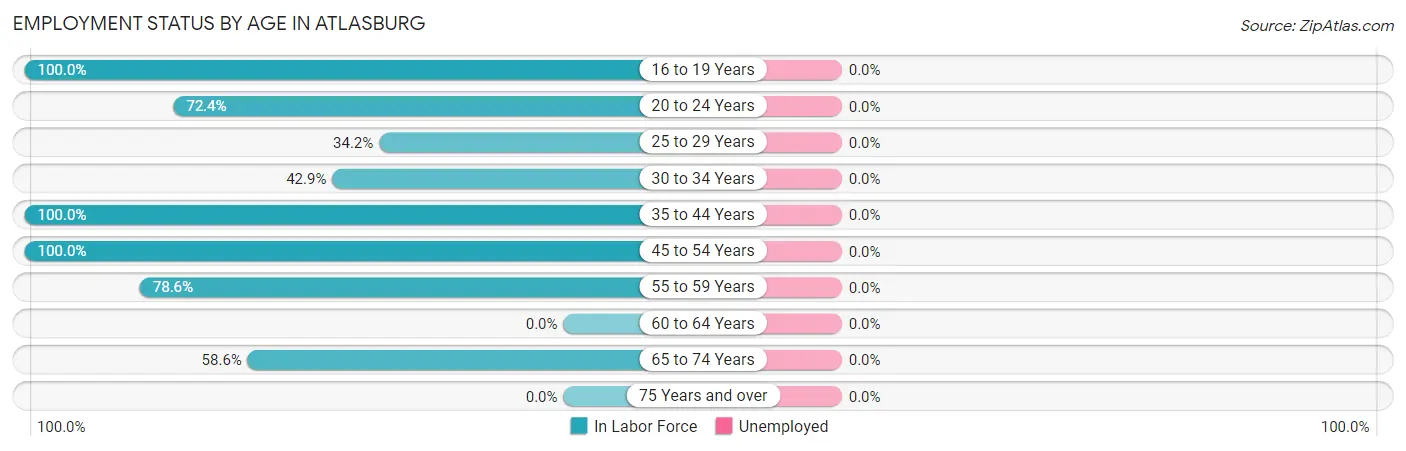
| Age Bracket | In Labor Force | Unemployed |
| 16 to 19 Years | 28 (100.0%) | 0 (0.0%) |
| 20 to 24 Years | 21 (72.4%) | 0 (0.0%) |
| 25 to 29 Years | 26 (34.2%) | 0 (0.0%) |
| 30 to 34 Years | 6 (42.9%) | 0 (0.0%) |
| 35 to 44 Years | 105 (100.0%) | 0 (0.0%) |
| 45 to 54 Years | 83 (100.0%) | 0 (0.0%) |
| 55 to 59 Years | 11 (78.6%) | 0 (0.0%) |
| 60 to 64 Years | 0 (0.0%) | 0 (0.0%) |
| 65 to 74 Years | 34 (58.6%) | 0 (0.0%) |
| 75 Years and over | 0 (0.0%) | 0 (0.0%) |
| Total | 314 (72.5%) | 0 (0.0%) |
Employment Status by Educational Attainment in Atlasburg
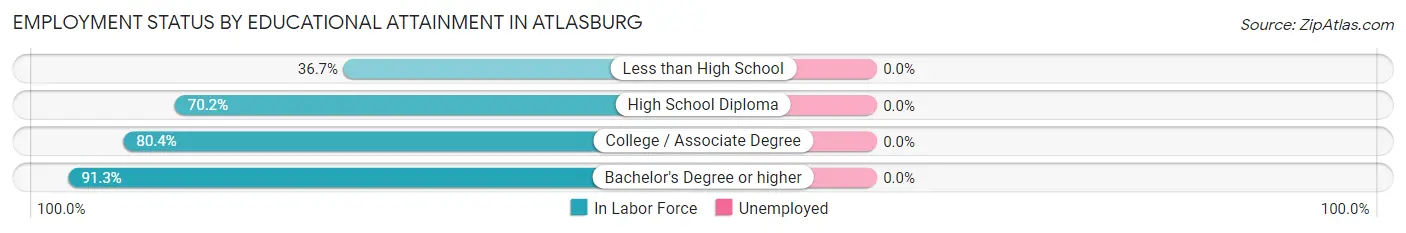
| Educational Attainment | In Labor Force | Unemployed |
| Less than High School | 18 (36.7%) | 0 (0.0%) |
| High School Diploma | 92 (70.2%) | 0 (0.0%) |
| College / Associate Degree | 37 (80.4%) | 0 (0.0%) |
| Bachelor's Degree or higher | 84 (91.3%) | 0 (0.0%) |
| Total | 231 (72.6%) | 0 (0.0%) |
Employment Occupations by Sex in Atlasburg
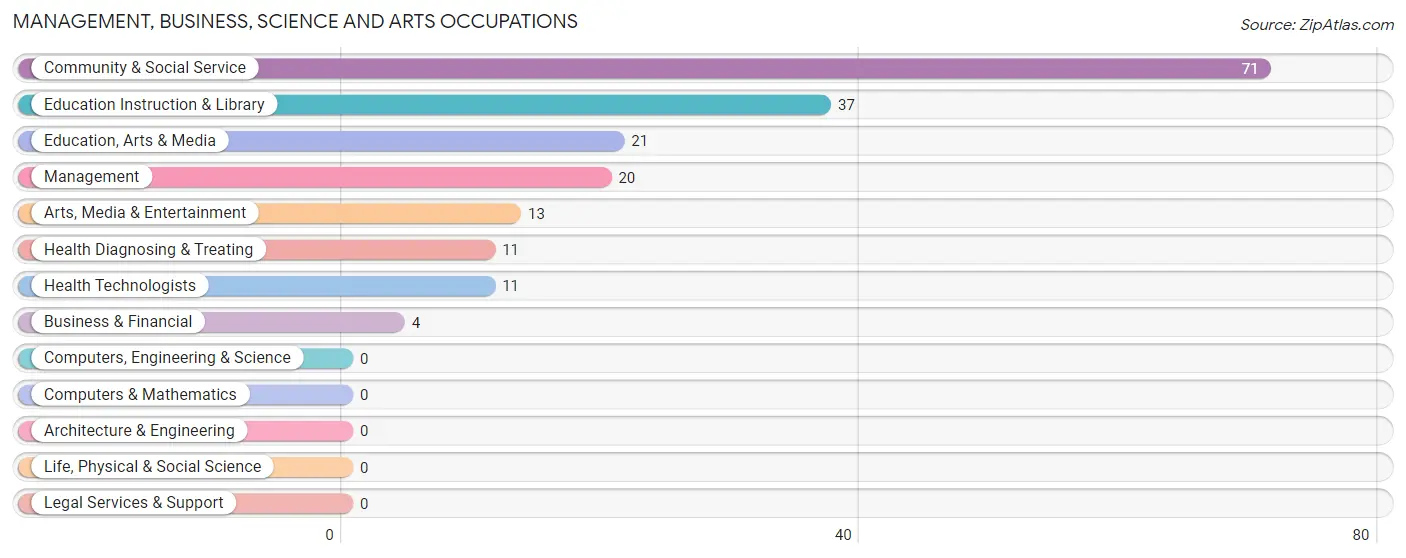
Management, Business, Science and Arts Occupations
The most common Management, Business, Science and Arts occupations in Atlasburg are Community & Social Service (71 | 23.4%), Education Instruction & Library (37 | 12.2%), Education, Arts & Media (21 | 6.9%), Management (20 | 6.6%), and Arts, Media & Entertainment (13 | 4.3%).
Management, Business, Science and Arts Occupations by Sex
Within the Management, Business, Science and Arts occupations in Atlasburg, the most male-oriented occupations are Arts, Media & Entertainment (100.0%), Health Diagnosing & Treating (100.0%), and Health Technologists (100.0%), while the most female-oriented occupations are Business & Financial (100.0%), Education, Arts & Media (100.0%), and Management (75.0%).
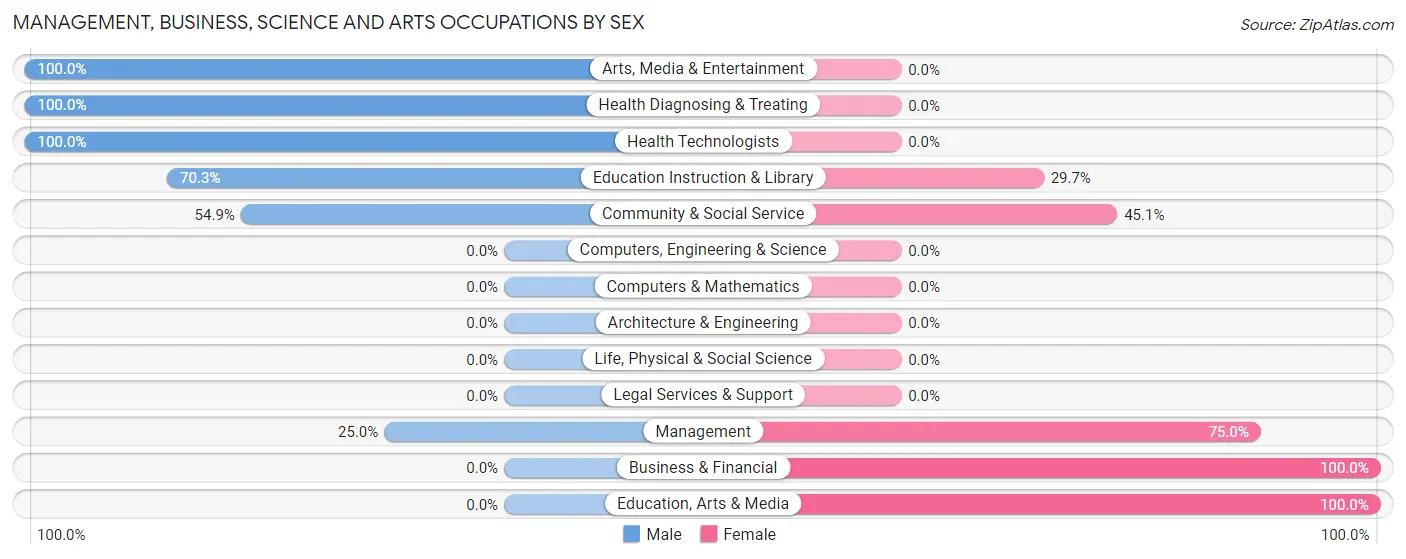
| Occupation | Male | Female |
| Management | 5 (25.0%) | 15 (75.0%) |
| Business & Financial | 0 (0.0%) | 4 (100.0%) |
| Computers, Engineering & Science | 0 (0.0%) | 0 (0.0%) |
| Computers & Mathematics | 0 (0.0%) | 0 (0.0%) |
| Architecture & Engineering | 0 (0.0%) | 0 (0.0%) |
| Life, Physical & Social Science | 0 (0.0%) | 0 (0.0%) |
| Community & Social Service | 39 (54.9%) | 32 (45.1%) |
| Education, Arts & Media | 0 (0.0%) | 21 (100.0%) |
| Legal Services & Support | 0 (0.0%) | 0 (0.0%) |
| Education Instruction & Library | 26 (70.3%) | 11 (29.7%) |
| Arts, Media & Entertainment | 13 (100.0%) | 0 (0.0%) |
| Health Diagnosing & Treating | 11 (100.0%) | 0 (0.0%) |
| Health Technologists | 11 (100.0%) | 0 (0.0%) |
| Total (Category) | 55 (51.9%) | 51 (48.1%) |
| Total (Overall) | 171 (56.4%) | 132 (43.6%) |
Services Occupations
Services Occupations by Sex
| Occupation | Male | Female |
| Healthcare Support | 0 (0.0%) | 0 (0.0%) |
| Security & Protection | 0 (0.0%) | 0 (0.0%) |
| Firefighting & Prevention | 0 (0.0%) | 0 (0.0%) |
| Law Enforcement | 0 (0.0%) | 0 (0.0%) |
| Food Preparation & Serving | 0 (0.0%) | 0 (0.0%) |
| Cleaning & Maintenance | 0 (0.0%) | 0 (0.0%) |
| Personal Care & Service | 0 (0.0%) | 0 (0.0%) |
| Total (Category) | 0 (0.0%) | 0 (0.0%) |
| Total (Overall) | 171 (56.4%) | 132 (43.6%) |
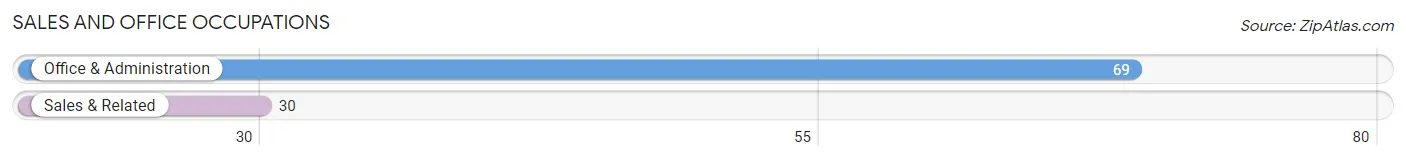
Sales and Office Occupations
The most common Sales and Office occupations in Atlasburg are Office & Administration (69 | 22.8%), and Sales & Related (30 | 9.9%).
Sales and Office Occupations by Sex

| Occupation | Male | Female |
| Sales & Related | 30 (100.0%) | 0 (0.0%) |
| Office & Administration | 15 (21.7%) | 54 (78.3%) |
| Total (Category) | 45 (45.5%) | 54 (54.5%) |
| Total (Overall) | 171 (56.4%) | 132 (43.6%) |
Natural Resources, Construction and Maintenance Occupations
The most common Natural Resources, Construction and Maintenance occupations in Atlasburg are , and Construction & Extraction (32 | 10.6%).
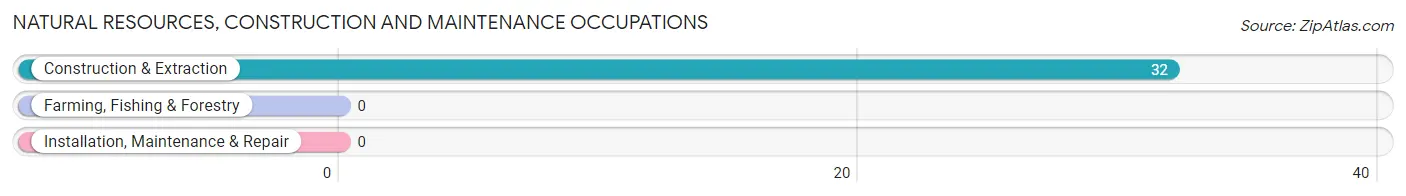
Natural Resources, Construction and Maintenance Occupations by Sex
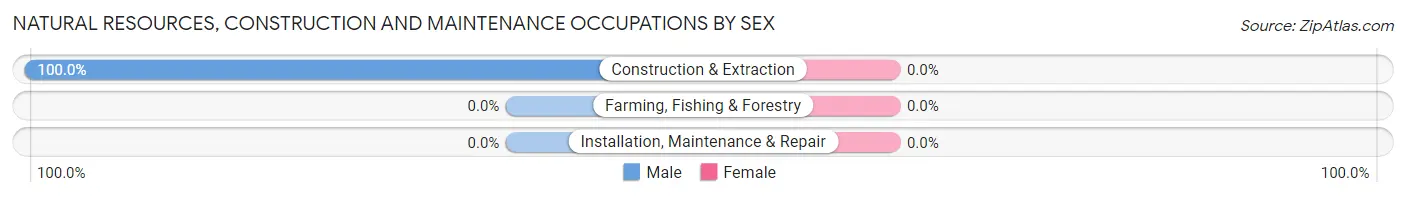
| Occupation | Male | Female |
| Farming, Fishing & Forestry | 0 (0.0%) | 0 (0.0%) |
| Construction & Extraction | 32 (100.0%) | 0 (0.0%) |
| Installation, Maintenance & Repair | 0 (0.0%) | 0 (0.0%) |
| Total (Category) | 32 (100.0%) | 0 (0.0%) |
| Total (Overall) | 171 (56.4%) | 132 (43.6%) |
Production, Transportation and Moving Occupations
The most common Production, Transportation and Moving occupations in Atlasburg are Production (27 | 8.9%), Transportation (24 | 7.9%), and Material Moving (15 | 5.0%).
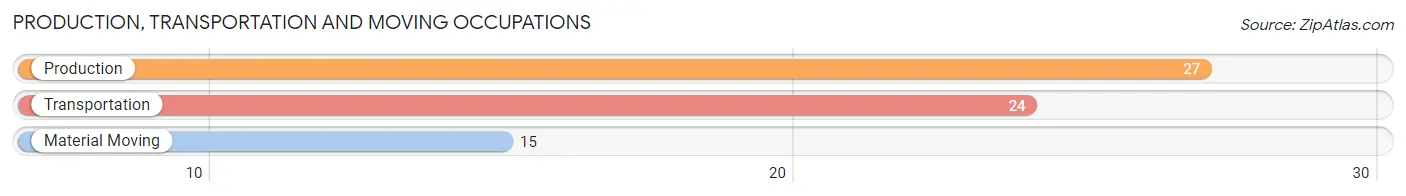
Production, Transportation and Moving Occupations by Sex
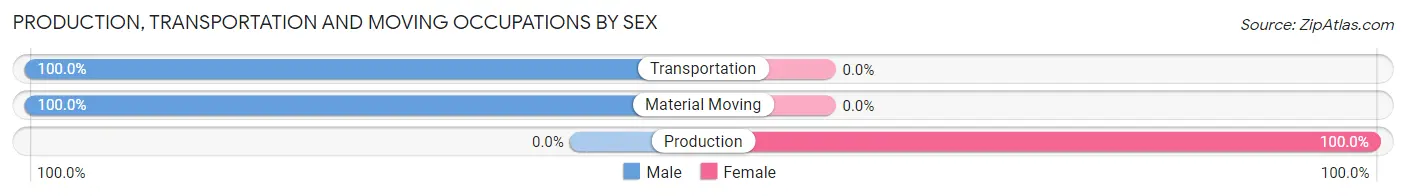
| Occupation | Male | Female |
| Production | 0 (0.0%) | 27 (100.0%) |
| Transportation | 24 (100.0%) | 0 (0.0%) |
| Material Moving | 15 (100.0%) | 0 (0.0%) |
| Total (Category) | 39 (59.1%) | 27 (40.9%) |
| Total (Overall) | 171 (56.4%) | 132 (43.6%) |
Employment Industries by Sex in Atlasburg
Employment Industries in Atlasburg
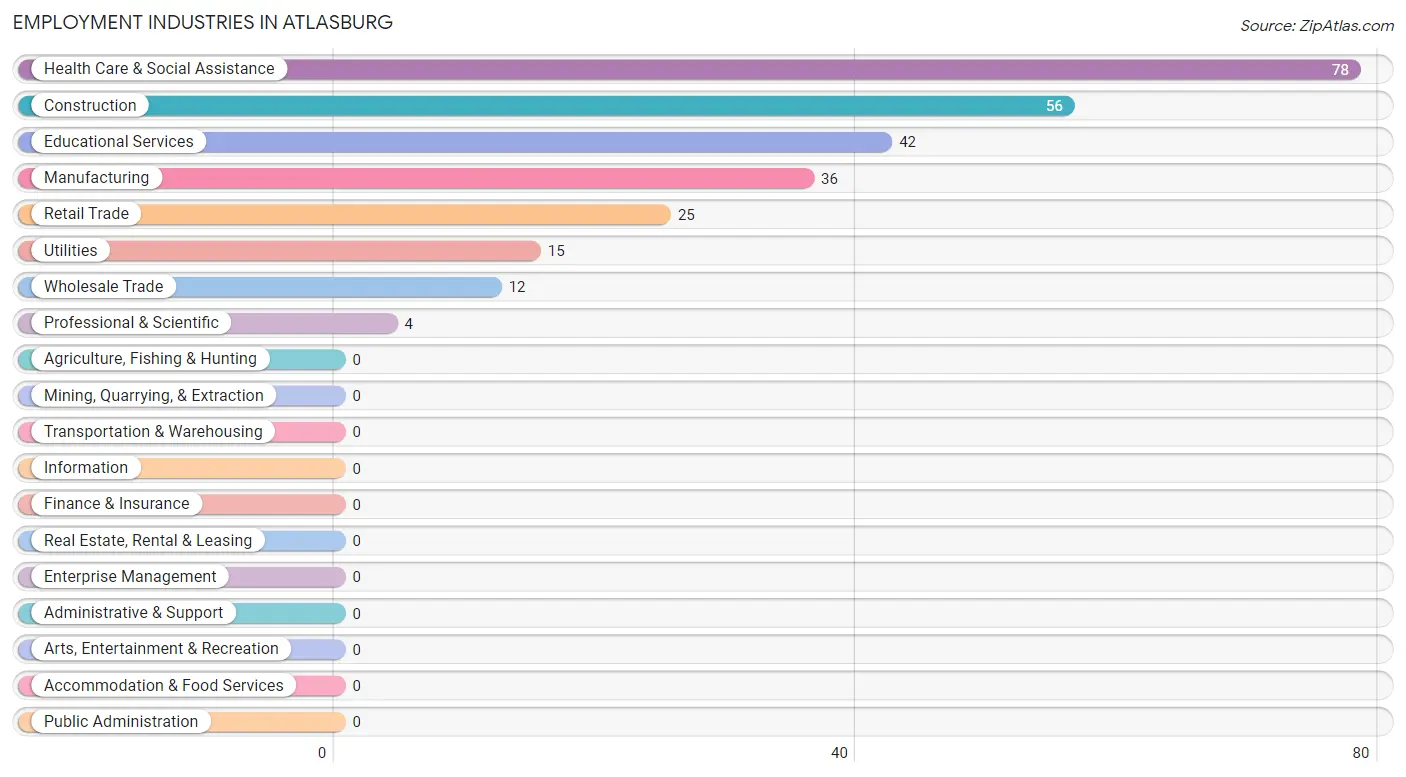
The major employment industries in Atlasburg include Health Care & Social Assistance (78 | 25.7%), Construction (56 | 18.5%), Educational Services (42 | 13.9%), Manufacturing (36 | 11.9%), and Retail Trade (25 | 8.3%).
Employment Industries by Sex in Atlasburg
The Atlasburg industries that see more men than women are Construction (100.0%), Wholesale Trade (100.0%), and Utilities (100.0%), whereas the industries that tend to have a higher number of women are Professional & Scientific (100.0%), Health Care & Social Assistance (85.9%), and Manufacturing (63.9%).

| Industry | Male | Female |
| Agriculture, Fishing & Hunting | 0 (0.0%) | 0 (0.0%) |
| Mining, Quarrying, & Extraction | 0 (0.0%) | 0 (0.0%) |
| Construction | 56 (100.0%) | 0 (0.0%) |
| Manufacturing | 13 (36.1%) | 23 (63.9%) |
| Wholesale Trade | 12 (100.0%) | 0 (0.0%) |
| Retail Trade | 15 (60.0%) | 10 (40.0%) |
| Transportation & Warehousing | 0 (0.0%) | 0 (0.0%) |
| Utilities | 15 (100.0%) | 0 (0.0%) |
| Information | 0 (0.0%) | 0 (0.0%) |
| Finance & Insurance | 0 (0.0%) | 0 (0.0%) |
| Real Estate, Rental & Leasing | 0 (0.0%) | 0 (0.0%) |
| Professional & Scientific | 0 (0.0%) | 4 (100.0%) |
| Enterprise Management | 0 (0.0%) | 0 (0.0%) |
| Administrative & Support | 0 (0.0%) | 0 (0.0%) |
| Educational Services | 31 (73.8%) | 11 (26.2%) |
| Health Care & Social Assistance | 11 (14.1%) | 67 (85.9%) |
| Arts, Entertainment & Recreation | 0 (0.0%) | 0 (0.0%) |
| Accommodation & Food Services | 0 (0.0%) | 0 (0.0%) |
| Public Administration | 0 (0.0%) | 0 (0.0%) |
| Total | 171 (56.4%) | 132 (43.6%) |
Education in Atlasburg
School Enrollment in Atlasburg
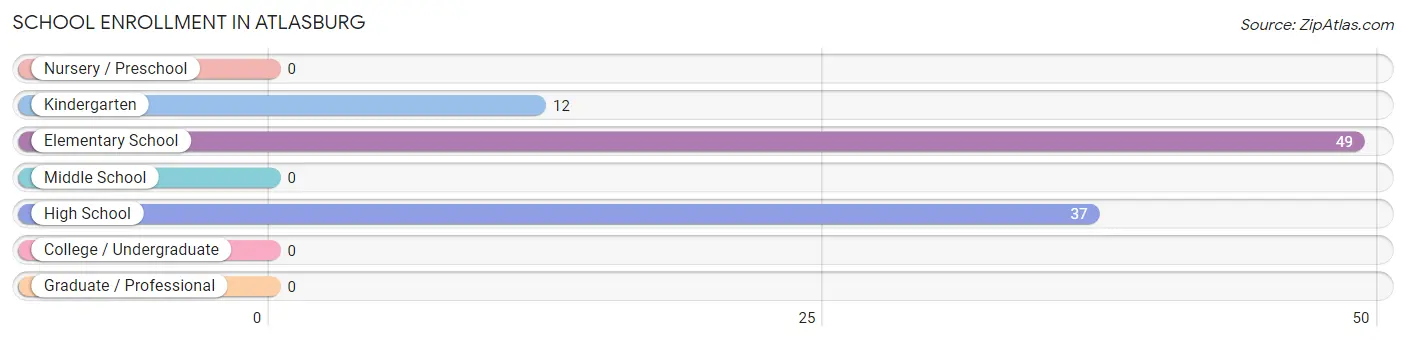
The most common levels of schooling among the 98 students in Atlasburg are elementary school (49 | 50.0%), high school (37 | 37.8%), and kindergarten (12 | 12.2%).
| School Level | # Students | % Students |
| Nursery / Preschool | 0 | 0.0% |
| Kindergarten | 12 | 12.2% |
| Elementary School | 49 | 50.0% |
| Middle School | 0 | 0.0% |
| High School | 37 | 37.8% |
| College / Undergraduate | 0 | 0.0% |
| Graduate / Professional | 0 | 0.0% |
| Total | 98 | 100.0% |
School Enrollment by Age by Funding Source in Atlasburg
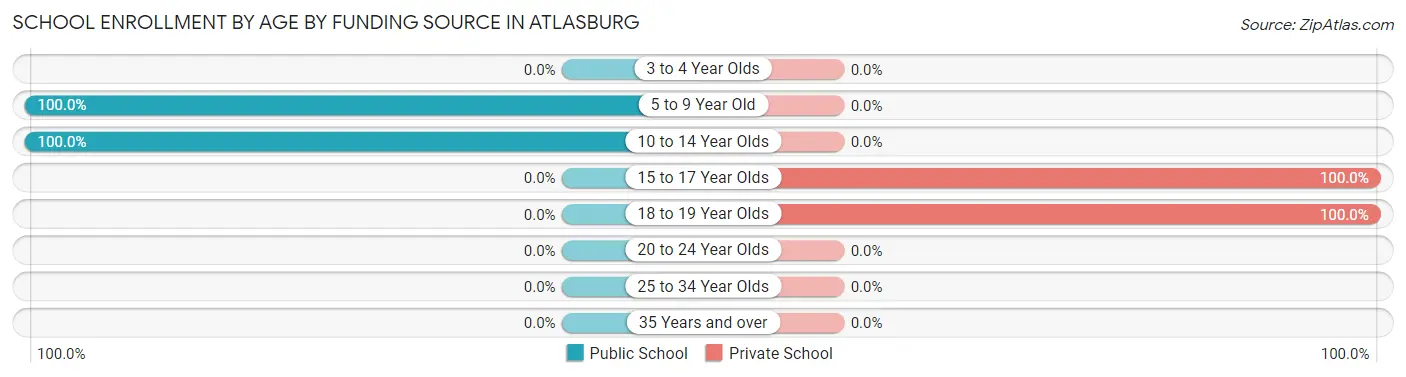
Out of a total of 98 students who are enrolled in schools in Atlasburg, 37 (37.8%) attend a private institution, while the remaining 61 (62.2%) are enrolled in public schools. The age group of 15 to 17 year olds has the highest likelihood of being enrolled in private schools, with 22 (100.0% in the age bracket) enrolled. Conversely, the age group of 5 to 9 year old has the lowest likelihood of being enrolled in a private school, with 46 (100.0% in the age bracket) attending a public institution.
| Age Bracket | Public School | Private School |
| 3 to 4 Year Olds | 0 (0.0%) | 0 (0.0%) |
| 5 to 9 Year Old | 46 (100.0%) | 0 (0.0%) |
| 10 to 14 Year Olds | 15 (100.0%) | 0 (0.0%) |
| 15 to 17 Year Olds | 0 (0.0%) | 22 (100.0%) |
| 18 to 19 Year Olds | 0 (0.0%) | 15 (100.0%) |
| 20 to 24 Year Olds | 0 (0.0%) | 0 (0.0%) |
| 25 to 34 Year Olds | 0 (0.0%) | 0 (0.0%) |
| 35 Years and over | 0 (0.0%) | 0 (0.0%) |
| Total | 61 (62.2%) | 37 (37.8%) |
Educational Attainment by Field of Study in Atlasburg
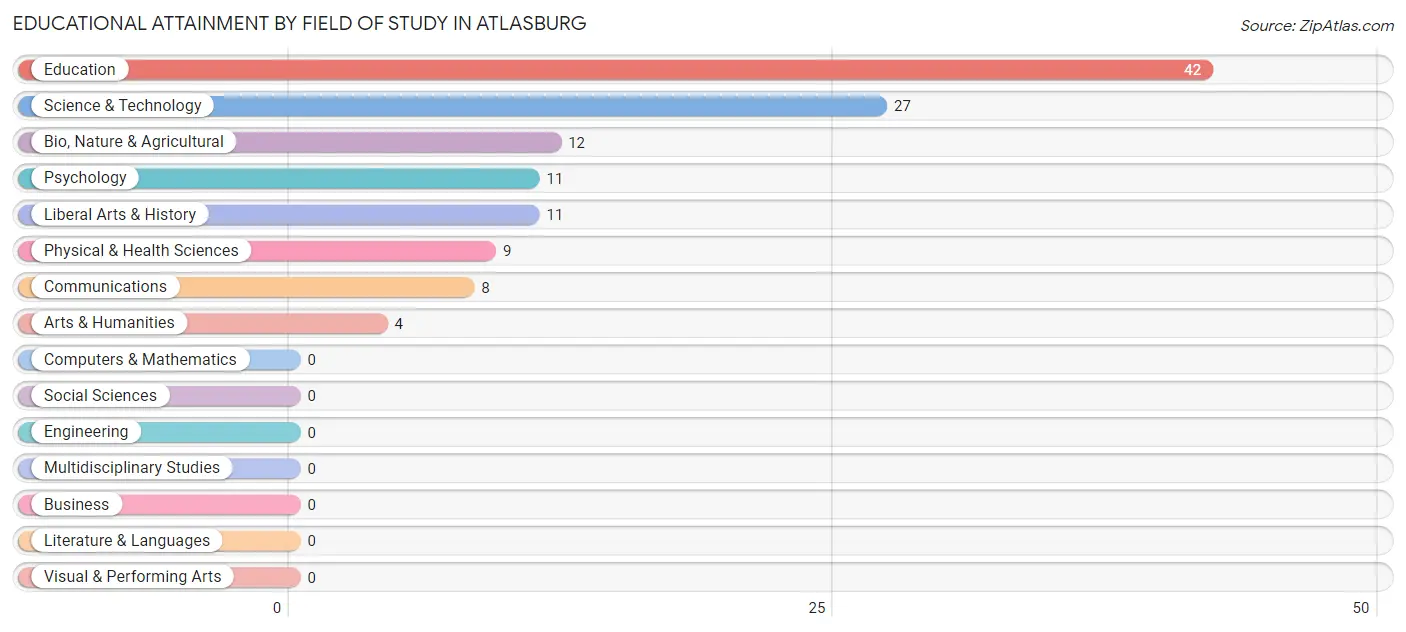
Education (42 | 33.9%), science & technology (27 | 21.8%), bio, nature & agricultural (12 | 9.7%), psychology (11 | 8.9%), and liberal arts & history (11 | 8.9%) are the most common fields of study among 124 individuals in Atlasburg who have obtained a bachelor's degree or higher.
| Field of Study | # Graduates | % Graduates |
| Computers & Mathematics | 0 | 0.0% |
| Bio, Nature & Agricultural | 12 | 9.7% |
| Physical & Health Sciences | 9 | 7.3% |
| Psychology | 11 | 8.9% |
| Social Sciences | 0 | 0.0% |
| Engineering | 0 | 0.0% |
| Multidisciplinary Studies | 0 | 0.0% |
| Science & Technology | 27 | 21.8% |
| Business | 0 | 0.0% |
| Education | 42 | 33.9% |
| Literature & Languages | 0 | 0.0% |
| Liberal Arts & History | 11 | 8.9% |
| Visual & Performing Arts | 0 | 0.0% |
| Communications | 8 | 6.5% |
| Arts & Humanities | 4 | 3.2% |
| Total | 124 | 100.0% |
Transportation & Commute in Atlasburg
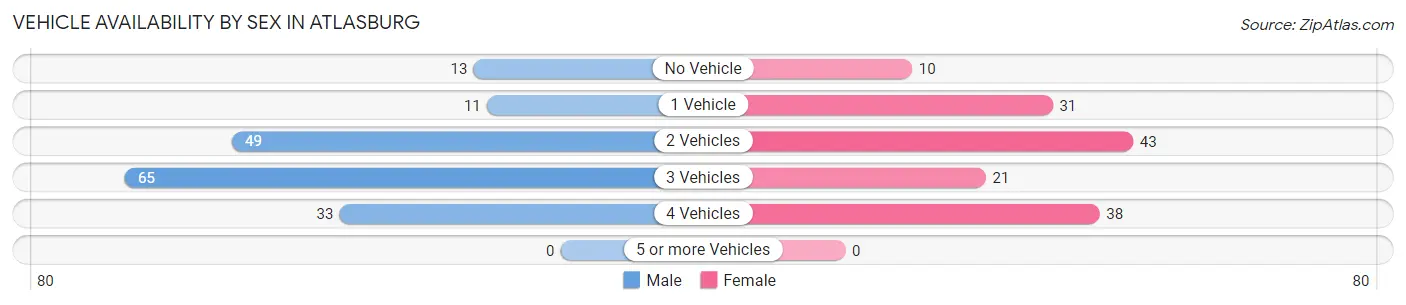
Vehicle Availability by Sex in Atlasburg
The most prevalent vehicle ownership categories in Atlasburg are males with 3 vehicles (65, accounting for 38.0%) and females with 3 vehicles (21, making up 45.5%).
| Vehicles Available | Male | Female |
| No Vehicle | 13 (7.6%) | 10 (7.0%) |
| 1 Vehicle | 11 (6.4%) | 31 (21.7%) |
| 2 Vehicles | 49 (28.6%) | 43 (30.1%) |
| 3 Vehicles | 65 (38.0%) | 21 (14.7%) |
| 4 Vehicles | 33 (19.3%) | 38 (26.6%) |
| 5 or more Vehicles | 0 (0.0%) | 0 (0.0%) |
| Total | 171 (100.0%) | 143 (100.0%) |
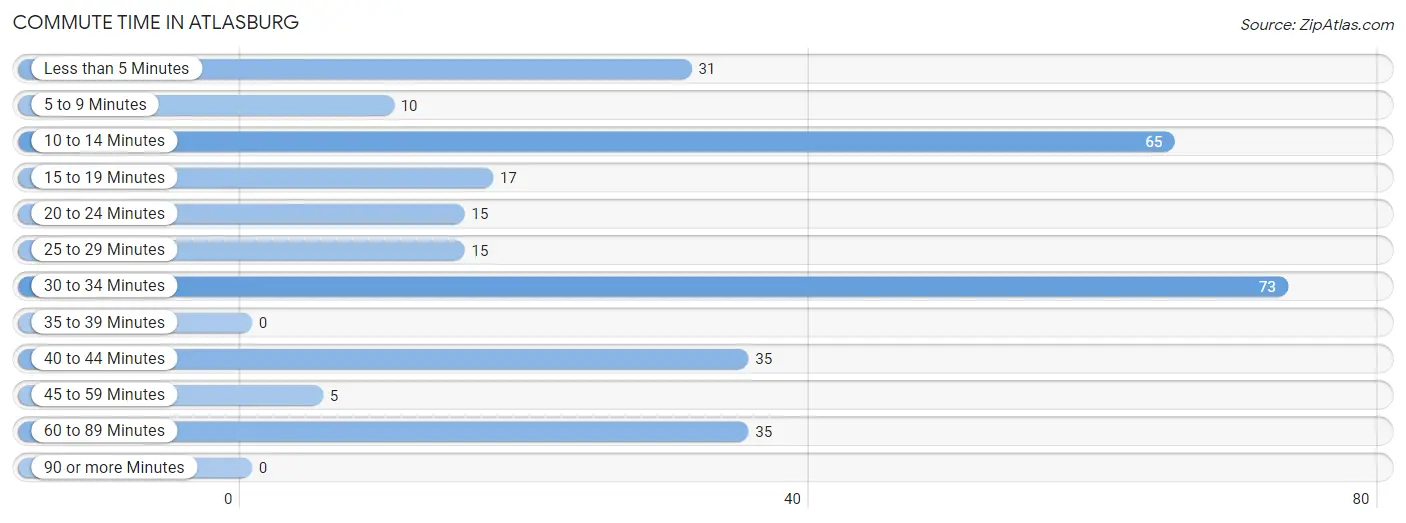
Commute Time in Atlasburg
The most frequently occuring commute durations in Atlasburg are 30 to 34 minutes (73 commuters, 24.2%), 10 to 14 minutes (65 commuters, 21.6%), and 40 to 44 minutes (35 commuters, 11.6%).
| Commute Time | # Commuters | % Commuters |
| Less than 5 Minutes | 31 | 10.3% |
| 5 to 9 Minutes | 10 | 3.3% |
| 10 to 14 Minutes | 65 | 21.6% |
| 15 to 19 Minutes | 17 | 5.7% |
| 20 to 24 Minutes | 15 | 5.0% |
| 25 to 29 Minutes | 15 | 5.0% |
| 30 to 34 Minutes | 73 | 24.2% |
| 35 to 39 Minutes | 0 | 0.0% |
| 40 to 44 Minutes | 35 | 11.6% |
| 45 to 59 Minutes | 5 | 1.7% |
| 60 to 89 Minutes | 35 | 11.6% |
| 90 or more Minutes | 0 | 0.0% |
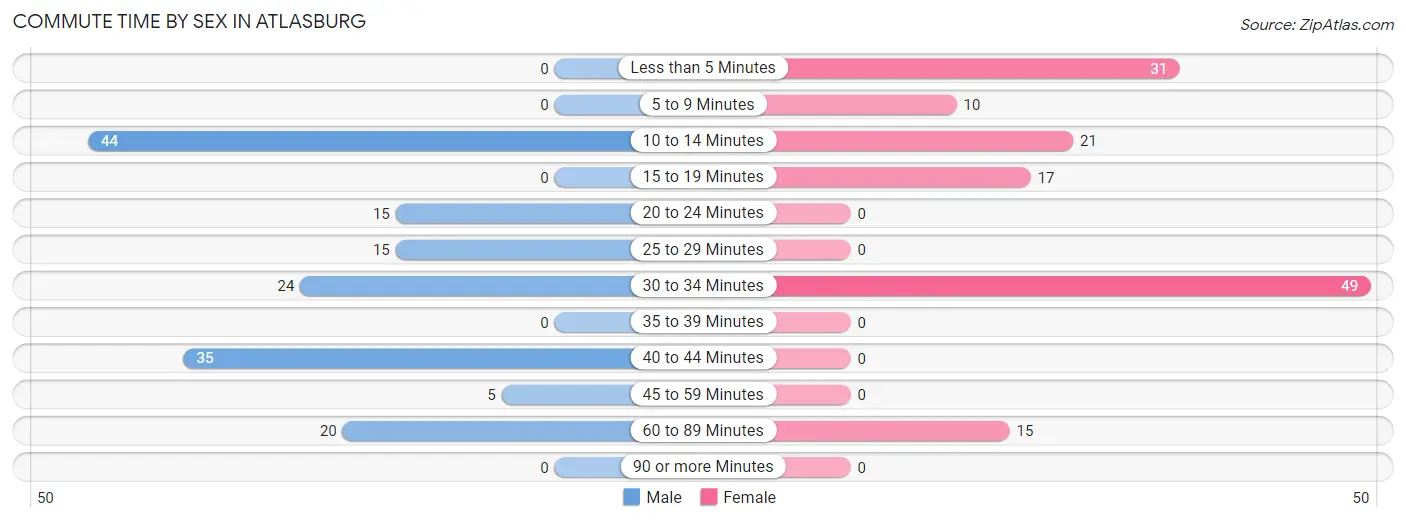
Commute Time by Sex in Atlasburg
The most common commute times in Atlasburg are 10 to 14 minutes (44 commuters, 27.9%) for males and 30 to 34 minutes (49 commuters, 34.3%) for females.
| Commute Time | Male | Female |
| Less than 5 Minutes | 0 (0.0%) | 31 (21.7%) |
| 5 to 9 Minutes | 0 (0.0%) | 10 (7.0%) |
| 10 to 14 Minutes | 44 (27.9%) | 21 (14.7%) |
| 15 to 19 Minutes | 0 (0.0%) | 17 (11.9%) |
| 20 to 24 Minutes | 15 (9.5%) | 0 (0.0%) |
| 25 to 29 Minutes | 15 (9.5%) | 0 (0.0%) |
| 30 to 34 Minutes | 24 (15.2%) | 49 (34.3%) |
| 35 to 39 Minutes | 0 (0.0%) | 0 (0.0%) |
| 40 to 44 Minutes | 35 (22.2%) | 0 (0.0%) |
| 45 to 59 Minutes | 5 (3.2%) | 0 (0.0%) |
| 60 to 89 Minutes | 20 (12.7%) | 15 (10.5%) |
| 90 or more Minutes | 0 (0.0%) | 0 (0.0%) |
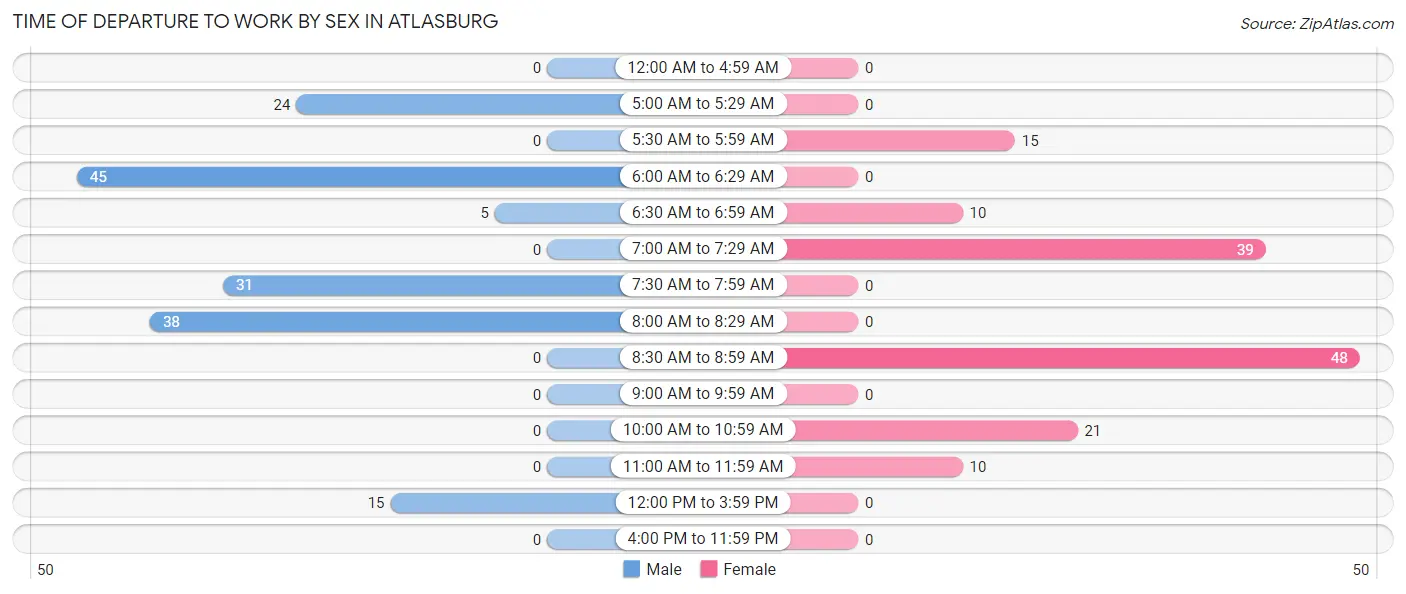
Time of Departure to Work by Sex in Atlasburg
The most frequent times of departure to work in Atlasburg are 6:00 AM to 6:29 AM (45, 28.5%) for males and 8:30 AM to 8:59 AM (48, 33.6%) for females.
| Time of Departure | Male | Female |
| 12:00 AM to 4:59 AM | 0 (0.0%) | 0 (0.0%) |
| 5:00 AM to 5:29 AM | 24 (15.2%) | 0 (0.0%) |
| 5:30 AM to 5:59 AM | 0 (0.0%) | 15 (10.5%) |
| 6:00 AM to 6:29 AM | 45 (28.5%) | 0 (0.0%) |
| 6:30 AM to 6:59 AM | 5 (3.2%) | 10 (7.0%) |
| 7:00 AM to 7:29 AM | 0 (0.0%) | 39 (27.3%) |
| 7:30 AM to 7:59 AM | 31 (19.6%) | 0 (0.0%) |
| 8:00 AM to 8:29 AM | 38 (24.0%) | 0 (0.0%) |
| 8:30 AM to 8:59 AM | 0 (0.0%) | 48 (33.6%) |
| 9:00 AM to 9:59 AM | 0 (0.0%) | 0 (0.0%) |
| 10:00 AM to 10:59 AM | 0 (0.0%) | 21 (14.7%) |
| 11:00 AM to 11:59 AM | 0 (0.0%) | 10 (7.0%) |
| 12:00 PM to 3:59 PM | 15 (9.5%) | 0 (0.0%) |
| 4:00 PM to 11:59 PM | 0 (0.0%) | 0 (0.0%) |
| Total | 158 (100.0%) | 143 (100.0%) |
Housing Occupancy in Atlasburg
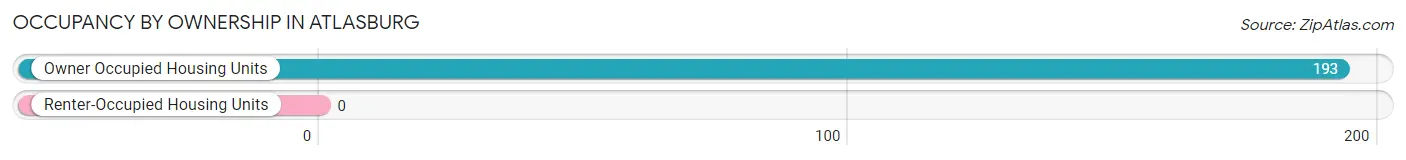
Occupancy by Ownership in Atlasburg
Of the total 193 dwellings in Atlasburg, owner-occupied units account for 193 (100.0%), while renter-occupied units make up 0 (0.0%).
| Occupancy | # Housing Units | % Housing Units |
| Owner Occupied Housing Units | 193 | 100.0% |
| Renter-Occupied Housing Units | 0 | 0.0% |
| Total Occupied Housing Units | 193 | 100.0% |
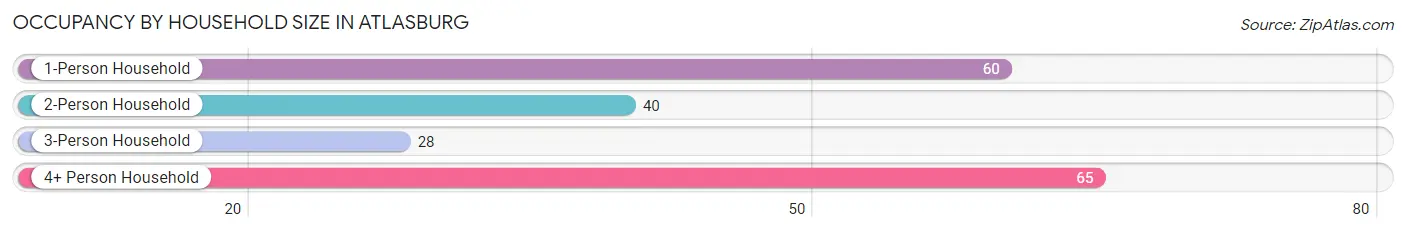
Occupancy by Household Size in Atlasburg
| Household Size | # Housing Units | % Housing Units |
| 1-Person Household | 60 | 31.1% |
| 2-Person Household | 40 | 20.7% |
| 3-Person Household | 28 | 14.5% |
| 4+ Person Household | 65 | 33.7% |
| Total Housing Units | 193 | 100.0% |
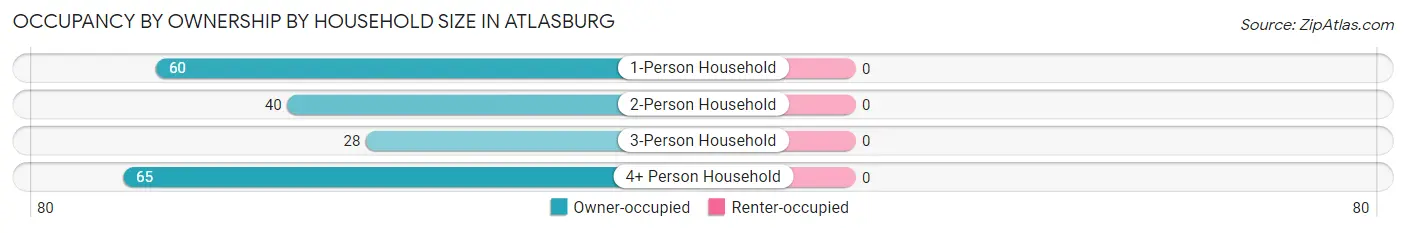
Occupancy by Ownership by Household Size in Atlasburg
| Household Size | Owner-occupied | Renter-occupied |
| 1-Person Household | 60 (100.0%) | 0 (0.0%) |
| 2-Person Household | 40 (100.0%) | 0 (0.0%) |
| 3-Person Household | 28 (100.0%) | 0 (0.0%) |
| 4+ Person Household | 65 (100.0%) | 0 (0.0%) |
| Total Housing Units | 193 (100.0%) | 0 (0.0%) |
Occupancy by Educational Attainment in Atlasburg

| Household Size | Owner-occupied | Renter-occupied |
| Less than High School | 13 (100.0%) | 0 (0.0%) |
| High School Diploma | 94 (100.0%) | 0 (0.0%) |
| College/Associate Degree | 9 (100.0%) | 0 (0.0%) |
| Bachelor's Degree or higher | 77 (100.0%) | 0 (0.0%) |
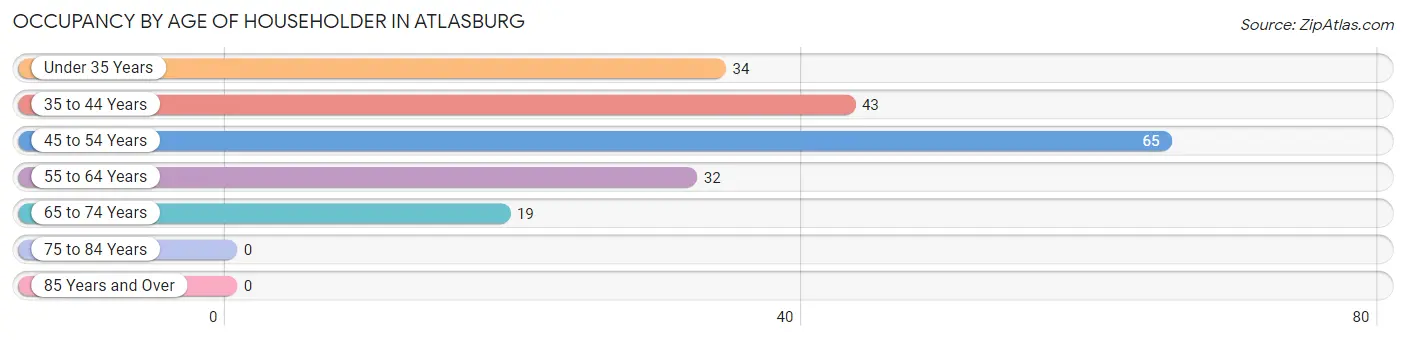
Occupancy by Age of Householder in Atlasburg
| Age Bracket | # Households | % Households |
| Under 35 Years | 34 | 17.6% |
| 35 to 44 Years | 43 | 22.3% |
| 45 to 54 Years | 65 | 33.7% |
| 55 to 64 Years | 32 | 16.6% |
| 65 to 74 Years | 19 | 9.8% |
| 75 to 84 Years | 0 | 0.0% |
| 85 Years and Over | 0 | 0.0% |
| Total | 193 | 100.0% |
Housing Finances in Atlasburg
Median Income by Occupancy in Atlasburg
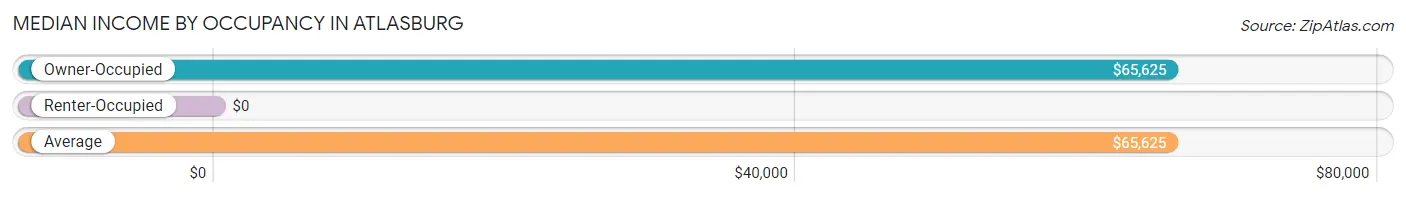
| Occupancy Type | # Households | Median Income |
| Owner-Occupied | 193 (100.0%) | $65,625 |
| Renter-Occupied | 0 (0.0%) | $0 |
| Average | 193 (100.0%) | $65,625 |
Occupancy by Householder Income Bracket in Atlasburg
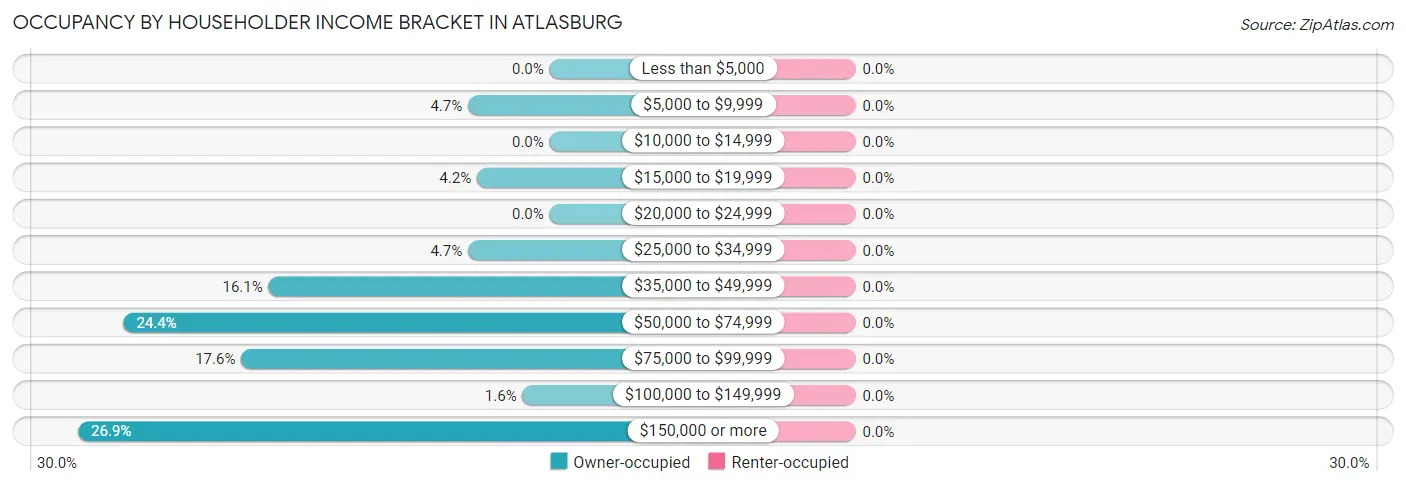
| Income Bracket | Owner-occupied | Renter-occupied |
| Less than $5,000 | 0 (0.0%) | 0 (0.0%) |
| $5,000 to $9,999 | 9 (4.7%) | 0 (0.0%) |
| $10,000 to $14,999 | 0 (0.0%) | 0 (0.0%) |
| $15,000 to $19,999 | 8 (4.2%) | 0 (0.0%) |
| $20,000 to $24,999 | 0 (0.0%) | 0 (0.0%) |
| $25,000 to $34,999 | 9 (4.7%) | 0 (0.0%) |
| $35,000 to $49,999 | 31 (16.1%) | 0 (0.0%) |
| $50,000 to $74,999 | 47 (24.3%) | 0 (0.0%) |
| $75,000 to $99,999 | 34 (17.6%) | 0 (0.0%) |
| $100,000 to $149,999 | 3 (1.5%) | 0 (0.0%) |
| $150,000 or more | 52 (26.9%) | 0 (0.0%) |
| Total | 193 (100.0%) | 0 (0.0%) |
Monthly Housing Cost Tiers in Atlasburg
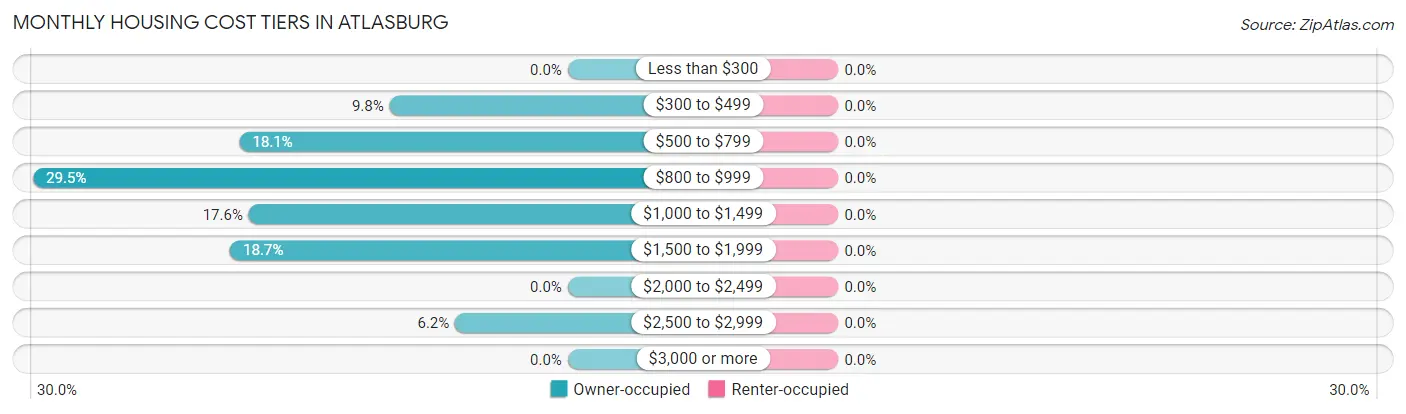
| Monthly Cost | Owner-occupied | Renter-occupied |
| Less than $300 | 0 (0.0%) | 0 (0.0%) |
| $300 to $499 | 19 (9.8%) | 0 (0.0%) |
| $500 to $799 | 35 (18.1%) | 0 (0.0%) |
| $800 to $999 | 57 (29.5%) | 0 (0.0%) |
| $1,000 to $1,499 | 34 (17.6%) | 0 (0.0%) |
| $1,500 to $1,999 | 36 (18.6%) | 0 (0.0%) |
| $2,000 to $2,499 | 0 (0.0%) | 0 (0.0%) |
| $2,500 to $2,999 | 12 (6.2%) | 0 (0.0%) |
| $3,000 or more | 0 (0.0%) | 0 (0.0%) |
| Total | 193 (100.0%) | 0 (0.0%) |
Physical Housing Characteristics in Atlasburg
Housing Structures in Atlasburg
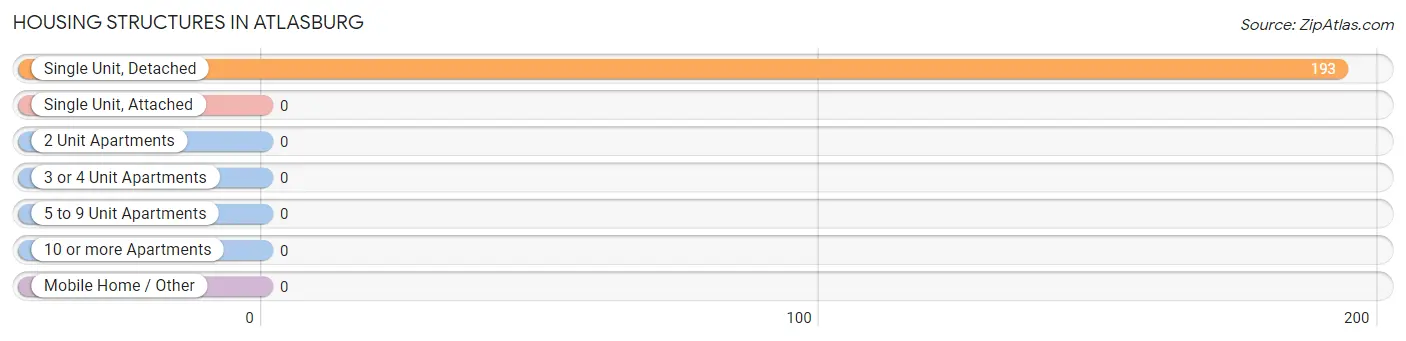
| Structure Type | # Housing Units | % Housing Units |
| Single Unit, Detached | 193 | 100.0% |
| Single Unit, Attached | 0 | 0.0% |
| 2 Unit Apartments | 0 | 0.0% |
| 3 or 4 Unit Apartments | 0 | 0.0% |
| 5 to 9 Unit Apartments | 0 | 0.0% |
| 10 or more Apartments | 0 | 0.0% |
| Mobile Home / Other | 0 | 0.0% |
| Total | 193 | 100.0% |
Housing Structures by Occupancy in Atlasburg
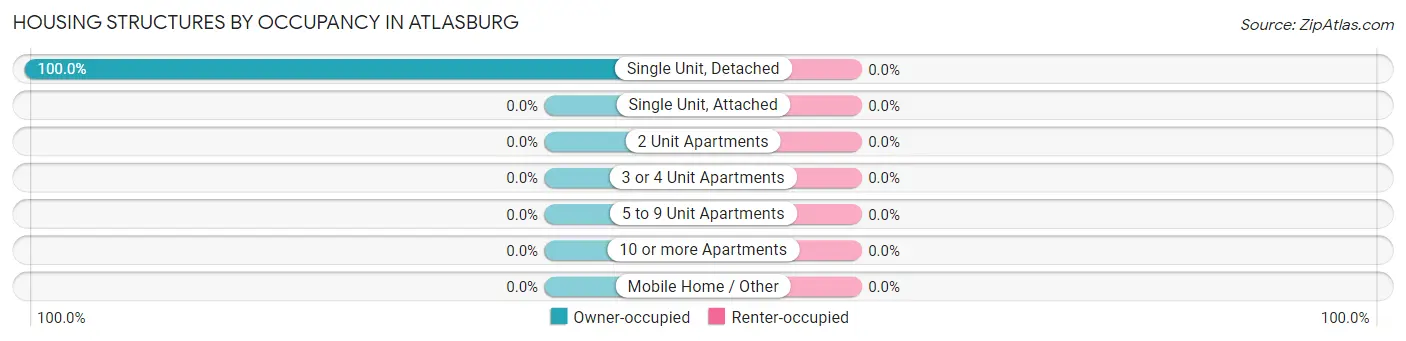
| Structure Type | Owner-occupied | Renter-occupied |
| Single Unit, Detached | 193 (100.0%) | 0 (0.0%) |
| Single Unit, Attached | 0 (0.0%) | 0 (0.0%) |
| 2 Unit Apartments | 0 (0.0%) | 0 (0.0%) |
| 3 or 4 Unit Apartments | 0 (0.0%) | 0 (0.0%) |
| 5 to 9 Unit Apartments | 0 (0.0%) | 0 (0.0%) |
| 10 or more Apartments | 0 (0.0%) | 0 (0.0%) |
| Mobile Home / Other | 0 (0.0%) | 0 (0.0%) |
| Total | 193 (100.0%) | 0 (0.0%) |
Housing Structures by Number of Rooms in Atlasburg
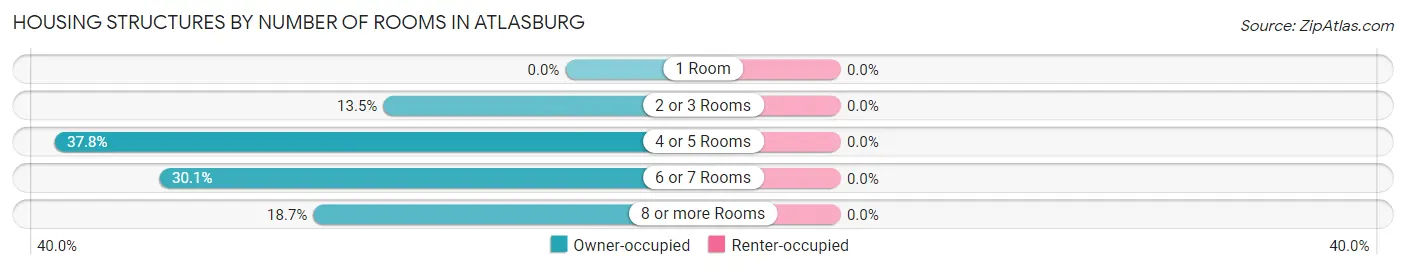
| Number of Rooms | Owner-occupied | Renter-occupied |
| 1 Room | 0 (0.0%) | 0 (0.0%) |
| 2 or 3 Rooms | 26 (13.5%) | 0 (0.0%) |
| 4 or 5 Rooms | 73 (37.8%) | 0 (0.0%) |
| 6 or 7 Rooms | 58 (30.0%) | 0 (0.0%) |
| 8 or more Rooms | 36 (18.6%) | 0 (0.0%) |
| Total | 193 (100.0%) | 0 (0.0%) |
Housing Structure by Heating Type in Atlasburg
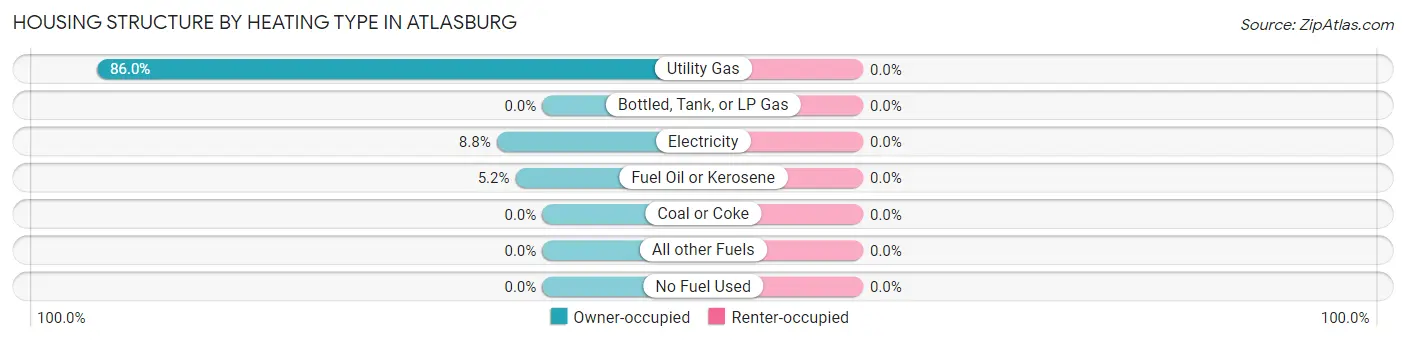
| Heating Type | Owner-occupied | Renter-occupied |
| Utility Gas | 166 (86.0%) | 0 (0.0%) |
| Bottled, Tank, or LP Gas | 0 (0.0%) | 0 (0.0%) |
| Electricity | 17 (8.8%) | 0 (0.0%) |
| Fuel Oil or Kerosene | 10 (5.2%) | 0 (0.0%) |
| Coal or Coke | 0 (0.0%) | 0 (0.0%) |
| All other Fuels | 0 (0.0%) | 0 (0.0%) |
| No Fuel Used | 0 (0.0%) | 0 (0.0%) |
| Total | 193 (100.0%) | 0 (0.0%) |
Household Vehicle Usage in Atlasburg
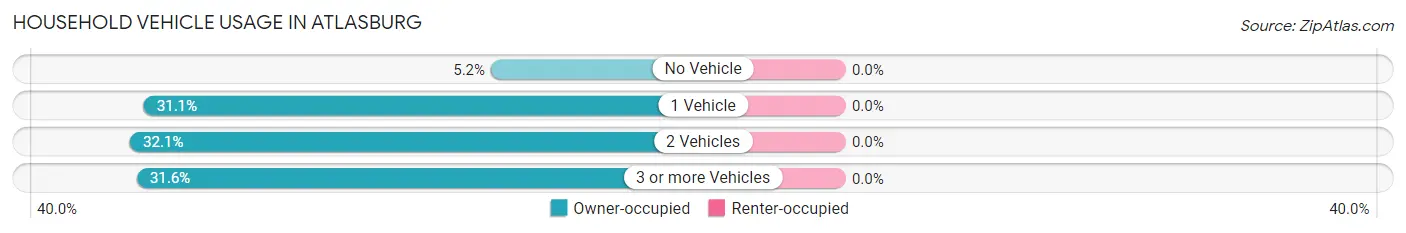
| Vehicles per Household | Owner-occupied | Renter-occupied |
| No Vehicle | 10 (5.2%) | 0 (0.0%) |
| 1 Vehicle | 60 (31.1%) | 0 (0.0%) |
| 2 Vehicles | 62 (32.1%) | 0 (0.0%) |
| 3 or more Vehicles | 61 (31.6%) | 0 (0.0%) |
| Total | 193 (100.0%) | 0 (0.0%) |
Real Estate & Mortgages in Atlasburg
Real Estate and Mortgage Overview in Atlasburg
| Characteristic | Without Mortgage | With Mortgage |
| Housing Units | 19 | 174 |
| Median Property Value | - | - |
| Median Household Income | - | - |
| Monthly Housing Costs | - | - |
| Real Estate Taxes | - | - |
Property Value by Mortgage Status in Atlasburg
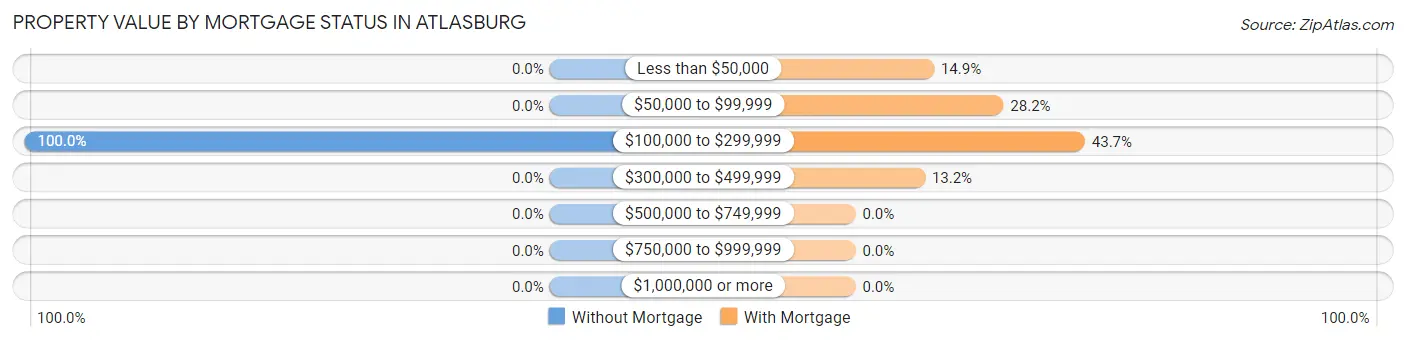
| Property Value | Without Mortgage | With Mortgage |
| Less than $50,000 | 0 (0.0%) | 26 (14.9%) |
| $50,000 to $99,999 | 0 (0.0%) | 49 (28.2%) |
| $100,000 to $299,999 | 19 (100.0%) | 76 (43.7%) |
| $300,000 to $499,999 | 0 (0.0%) | 23 (13.2%) |
| $500,000 to $749,999 | 0 (0.0%) | 0 (0.0%) |
| $750,000 to $999,999 | 0 (0.0%) | 0 (0.0%) |
| $1,000,000 or more | 0 (0.0%) | 0 (0.0%) |
| Total | 19 (100.0%) | 174 (100.0%) |
Household Income by Mortgage Status in Atlasburg
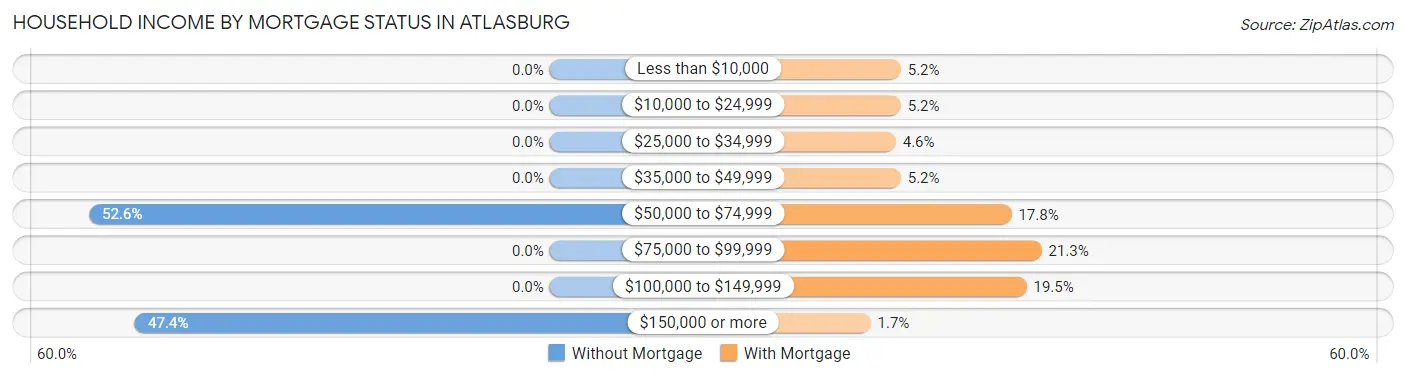
| Household Income | Without Mortgage | With Mortgage |
| Less than $10,000 | 0 (0.0%) | 9 (5.2%) |
| $10,000 to $24,999 | 0 (0.0%) | 9 (5.2%) |
| $25,000 to $34,999 | 0 (0.0%) | 8 (4.6%) |
| $35,000 to $49,999 | 0 (0.0%) | 9 (5.2%) |
| $50,000 to $74,999 | 10 (52.6%) | 31 (17.8%) |
| $75,000 to $99,999 | 0 (0.0%) | 37 (21.3%) |
| $100,000 to $149,999 | 0 (0.0%) | 34 (19.5%) |
| $150,000 or more | 9 (47.4%) | 3 (1.7%) |
| Total | 19 (100.0%) | 174 (100.0%) |
Property Value to Household Income Ratio in Atlasburg
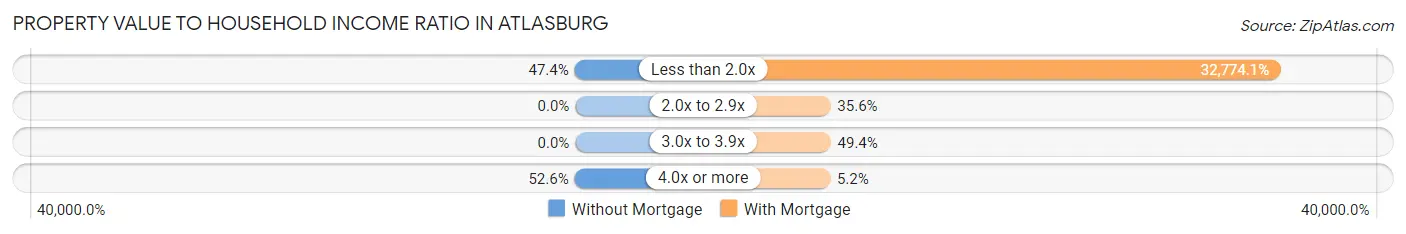
| Value-to-Income Ratio | Without Mortgage | With Mortgage |
| Less than 2.0x | 9 (47.4%) | 57,027 (32,774.1%) |
| 2.0x to 2.9x | 0 (0.0%) | 62 (35.6%) |
| 3.0x to 3.9x | 0 (0.0%) | 86 (49.4%) |
| 4.0x or more | 10 (52.6%) | 9 (5.2%) |
| Total | 19 (100.0%) | 174 (100.0%) |
Real Estate Taxes by Mortgage Status in Atlasburg
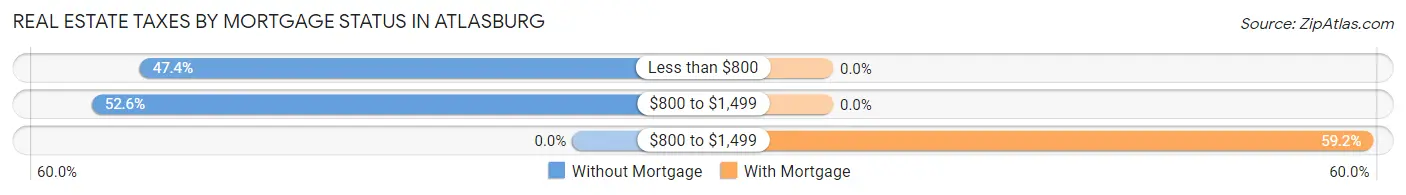
| Property Taxes | Without Mortgage | With Mortgage |
| Less than $800 | 9 (47.4%) | 0 (0.0%) |
| $800 to $1,499 | 10 (52.6%) | 0 (0.0%) |
| $800 to $1,499 | 0 (0.0%) | 103 (59.2%) |
| Total | 19 (100.0%) | 174 (100.0%) |
Health & Disability in Atlasburg
Health Insurance Coverage by Age in Atlasburg
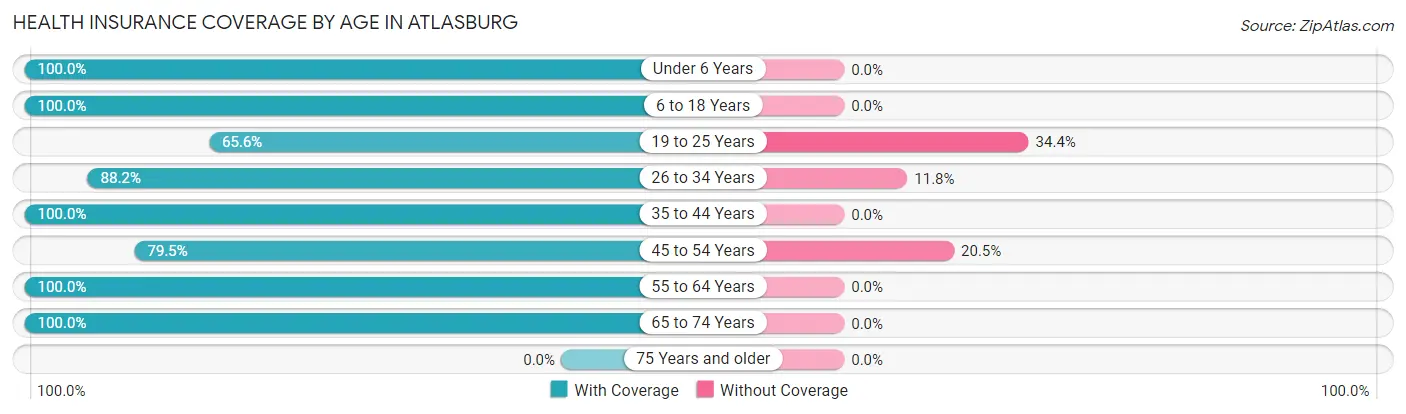
| Age Bracket | With Coverage | Without Coverage |
| Under 6 Years | 30 (100.0%) | 0 (0.0%) |
| 6 to 18 Years | 108 (100.0%) | 0 (0.0%) |
| 19 to 25 Years | 42 (65.6%) | 22 (34.4%) |
| 26 to 34 Years | 60 (88.2%) | 8 (11.8%) |
| 35 to 44 Years | 94 (100.0%) | 0 (0.0%) |
| 45 to 54 Years | 66 (79.5%) | 17 (20.5%) |
| 55 to 64 Years | 40 (100.0%) | 0 (0.0%) |
| 65 to 74 Years | 58 (100.0%) | 0 (0.0%) |
| 75 Years and older | 0 (0.0%) | 0 (0.0%) |
| Total | 498 (91.4%) | 47 (8.6%) |
Health Insurance Coverage by Citizenship Status in Atlasburg
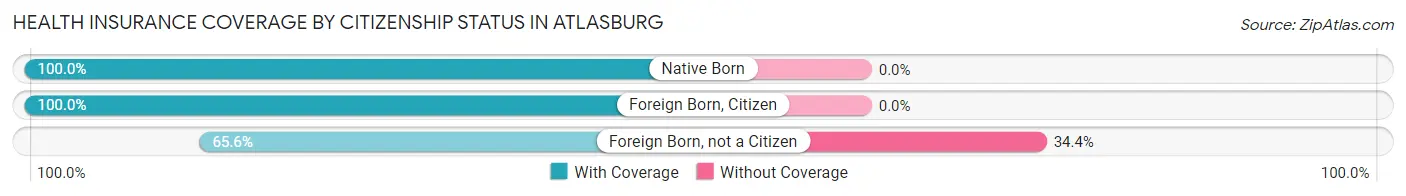
| Citizenship Status | With Coverage | Without Coverage |
| Native Born | 30 (100.0%) | 0 (0.0%) |
| Foreign Born, Citizen | 108 (100.0%) | 0 (0.0%) |
| Foreign Born, not a Citizen | 42 (65.6%) | 22 (34.4%) |
Health Insurance Coverage by Household Income in Atlasburg
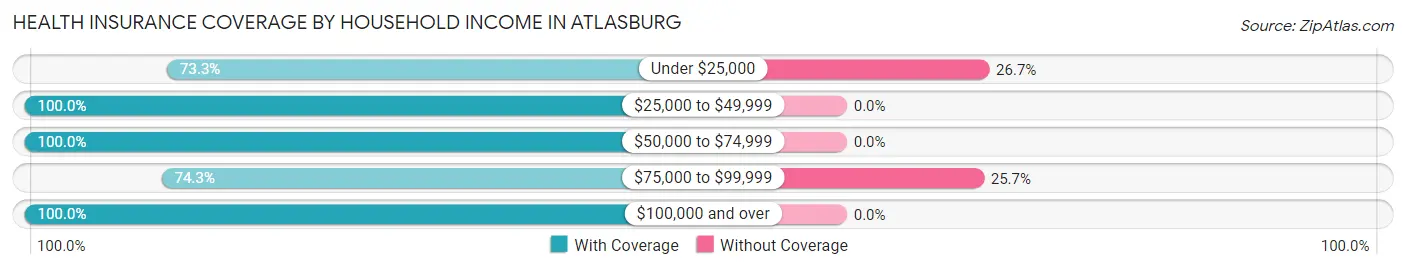
| Household Income | With Coverage | Without Coverage |
| Under $25,000 | 22 (73.3%) | 8 (26.7%) |
| $25,000 to $49,999 | 40 (100.0%) | 0 (0.0%) |
| $50,000 to $74,999 | 106 (100.0%) | 0 (0.0%) |
| $75,000 to $99,999 | 113 (74.3%) | 39 (25.7%) |
| $100,000 and over | 217 (100.0%) | 0 (0.0%) |
Public vs Private Health Insurance Coverage by Age in Atlasburg
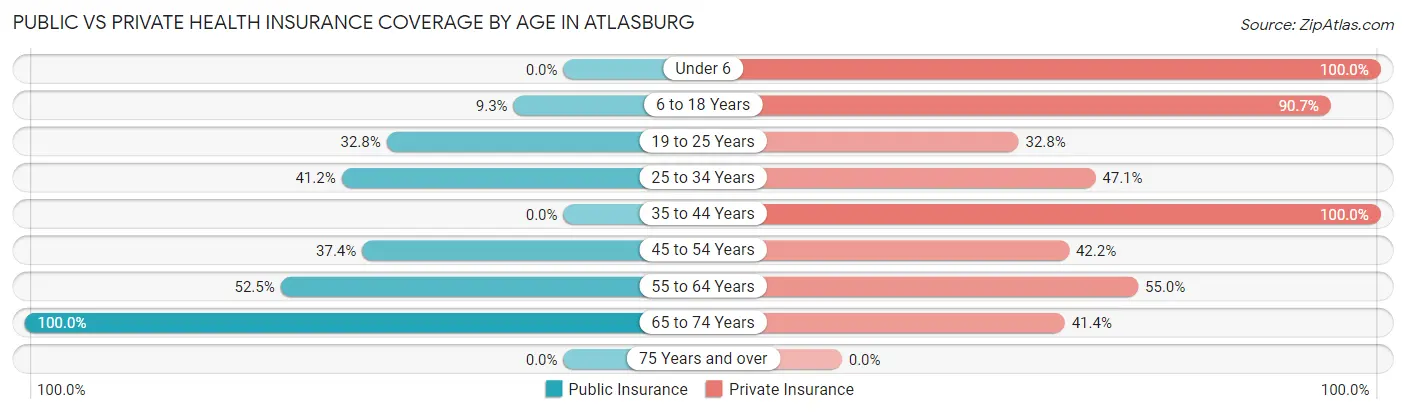
| Age Bracket | Public Insurance | Private Insurance |
| Under 6 | 0 (0.0%) | 30 (100.0%) |
| 6 to 18 Years | 10 (9.3%) | 98 (90.7%) |
| 19 to 25 Years | 21 (32.8%) | 21 (32.8%) |
| 25 to 34 Years | 28 (41.2%) | 32 (47.1%) |
| 35 to 44 Years | 0 (0.0%) | 94 (100.0%) |
| 45 to 54 Years | 31 (37.3%) | 35 (42.2%) |
| 55 to 64 Years | 21 (52.5%) | 22 (55.0%) |
| 65 to 74 Years | 58 (100.0%) | 24 (41.4%) |
| 75 Years and over | 0 (0.0%) | 0 (0.0%) |
| Total | 169 (31.0%) | 356 (65.3%) |
Disability Status by Sex by Age in Atlasburg
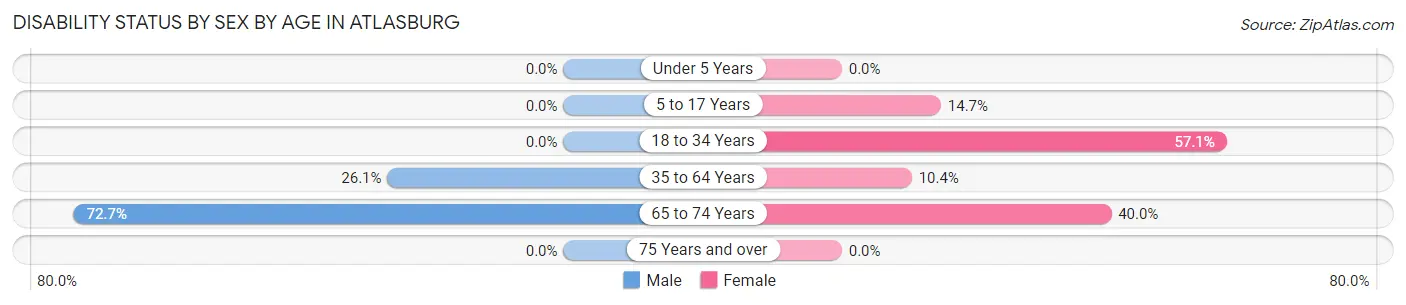
| Age Bracket | Male | Female |
| Under 5 Years | 0 (0.0%) | 0 (0.0%) |
| 5 to 17 Years | 0 (0.0%) | 10 (14.7%) |
| 18 to 34 Years | 0 (0.0%) | 36 (57.1%) |
| 35 to 64 Years | 29 (26.1%) | 11 (10.4%) |
| 65 to 74 Years | 24 (72.7%) | 10 (40.0%) |
| 75 Years and over | 0 (0.0%) | 0 (0.0%) |
Disability Class by Sex by Age in Atlasburg
Disability Class: Hearing Difficulty
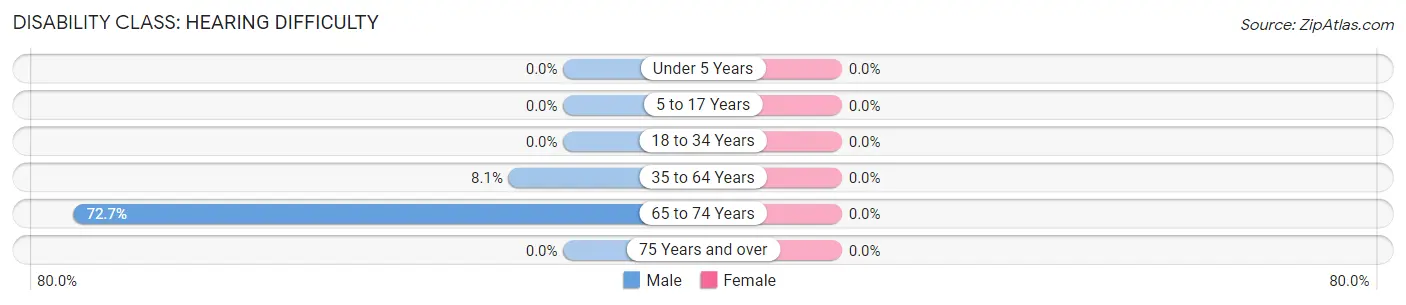
| Age Bracket | Male | Female |
| Under 5 Years | 0 (0.0%) | 0 (0.0%) |
| 5 to 17 Years | 0 (0.0%) | 0 (0.0%) |
| 18 to 34 Years | 0 (0.0%) | 0 (0.0%) |
| 35 to 64 Years | 9 (8.1%) | 0 (0.0%) |
| 65 to 74 Years | 24 (72.7%) | 0 (0.0%) |
| 75 Years and over | 0 (0.0%) | 0 (0.0%) |
Disability Class: Vision Difficulty
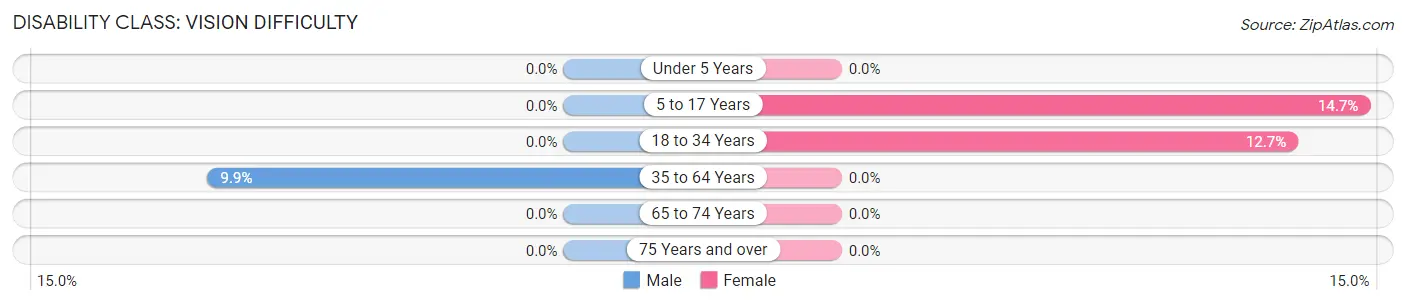
| Age Bracket | Male | Female |
| Under 5 Years | 0 (0.0%) | 0 (0.0%) |
| 5 to 17 Years | 0 (0.0%) | 10 (14.7%) |
| 18 to 34 Years | 0 (0.0%) | 8 (12.7%) |
| 35 to 64 Years | 11 (9.9%) | 0 (0.0%) |
| 65 to 74 Years | 0 (0.0%) | 0 (0.0%) |
| 75 Years and over | 0 (0.0%) | 0 (0.0%) |
Disability Class: Cognitive Difficulty
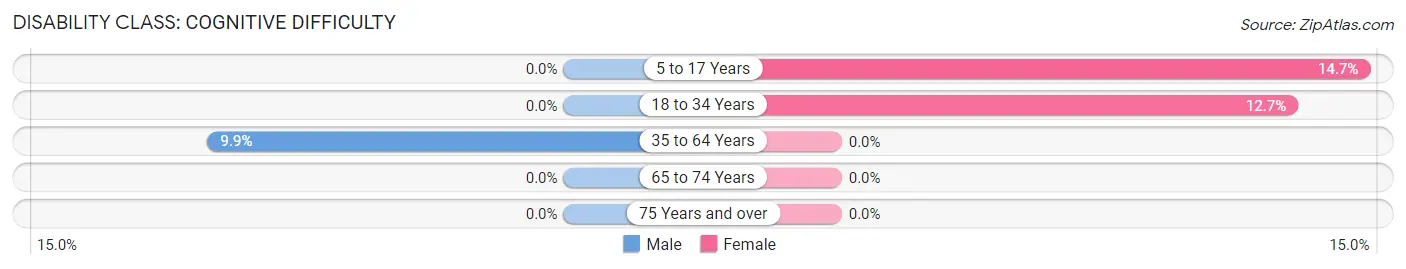
| Age Bracket | Male | Female |
| 5 to 17 Years | 0 (0.0%) | 10 (14.7%) |
| 18 to 34 Years | 0 (0.0%) | 8 (12.7%) |
| 35 to 64 Years | 11 (9.9%) | 0 (0.0%) |
| 65 to 74 Years | 0 (0.0%) | 0 (0.0%) |
| 75 Years and over | 0 (0.0%) | 0 (0.0%) |
Disability Class: Ambulatory Difficulty
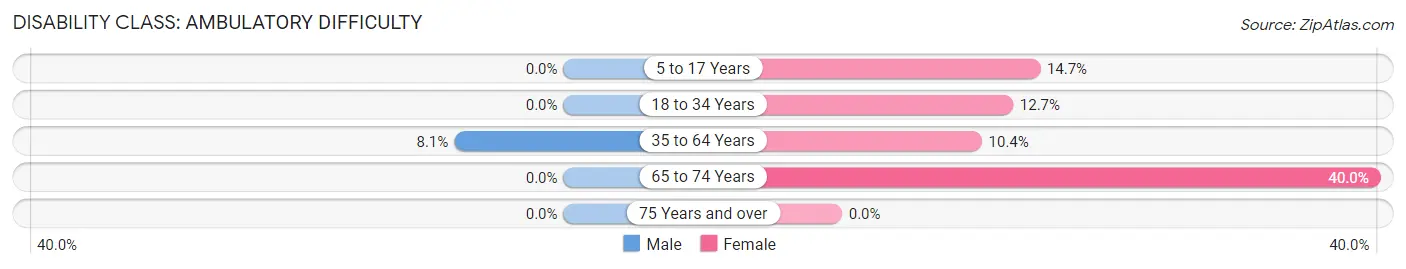
| Age Bracket | Male | Female |
| 5 to 17 Years | 0 (0.0%) | 10 (14.7%) |
| 18 to 34 Years | 0 (0.0%) | 8 (12.7%) |
| 35 to 64 Years | 9 (8.1%) | 11 (10.4%) |
| 65 to 74 Years | 0 (0.0%) | 10 (40.0%) |
| 75 Years and over | 0 (0.0%) | 0 (0.0%) |
Disability Class: Self-Care Difficulty
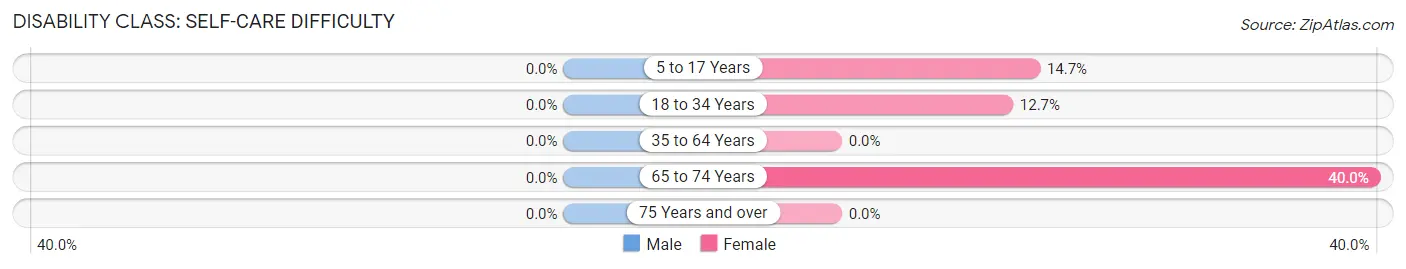
| Age Bracket | Male | Female |
| 5 to 17 Years | 0 (0.0%) | 10 (14.7%) |
| 18 to 34 Years | 0 (0.0%) | 8 (12.7%) |
| 35 to 64 Years | 0 (0.0%) | 0 (0.0%) |
| 65 to 74 Years | 0 (0.0%) | 10 (40.0%) |
| 75 Years and over | 0 (0.0%) | 0 (0.0%) |
Technology Access in Atlasburg
Computing Device Access in Atlasburg
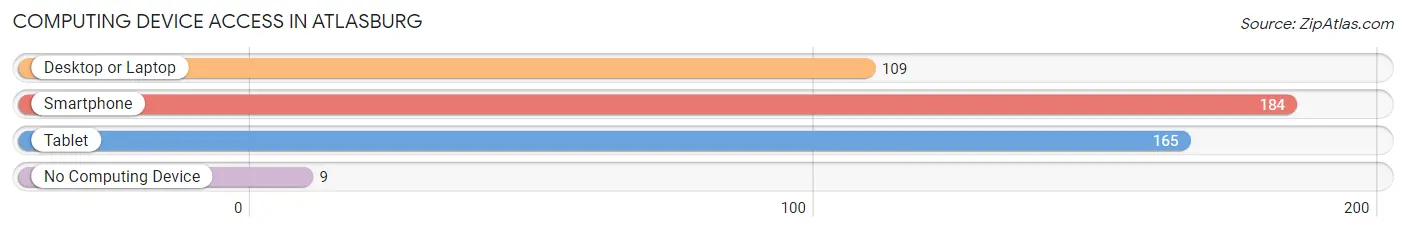
| Device Type | # Households | % Households |
| Desktop or Laptop | 109 | 56.5% |
| Smartphone | 184 | 95.3% |
| Tablet | 165 | 85.5% |
| No Computing Device | 9 | 4.7% |
| Total | 193 | 100.0% |
Internet Access in Atlasburg
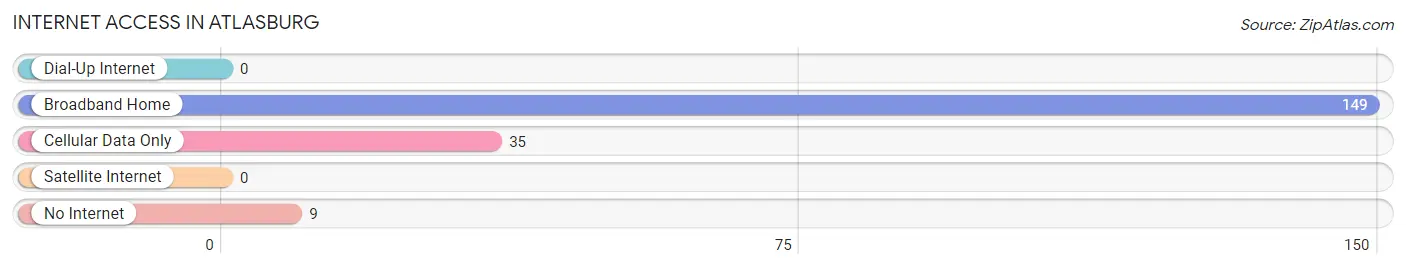
| Internet Type | # Households | % Households |
| Dial-Up Internet | 0 | 0.0% |
| Broadband Home | 149 | 77.2% |
| Cellular Data Only | 35 | 18.1% |
| Satellite Internet | 0 | 0.0% |
| No Internet | 9 | 4.7% |
| Total | 193 | 100.0% |
Atlasburg Summary
Atlasburg is a small borough located in Washington County, Pennsylvania. It is situated in the southwestern corner of the state, approximately 25 miles southwest of Pittsburgh. The population of Atlasburg was 1,093 at the 2010 census.
History
Atlasburg was founded in 1832 by John and William Atlas, two brothers who had emigrated from England. The Atlas brothers purchased a large tract of land in the area and began to develop it into a small village. The village was named after the Atlas brothers and was incorporated as a borough in 1867.
Atlasburg was a small farming community for much of its history. The town was home to several small businesses, including a general store, a blacksmith shop, and a grist mill. The town also had a post office, a school, and a church.
In the late 19th century, Atlasburg began to experience a period of growth and development. The town was connected to the Pittsburgh and Lake Erie Railroad in 1883, which allowed for increased trade and commerce. The town also saw the construction of several new buildings, including a hotel, a bank, and a theater.
Geography
Atlasburg is located at 40°14'45" North, 80°14'45" West (40.245833, -80.245833). The borough is situated in the southwestern corner of Washington County, approximately 25 miles southwest of Pittsburgh.
Atlasburg is located in a rural area of southwestern Pennsylvania. The borough is surrounded by rolling hills and farmland. The town is located along the banks of the Chartiers Creek, which flows through the center of the borough.
Economy
Atlasburg is a small, rural community with a limited economy. The town is home to several small businesses, including a general store, a hardware store, and a restaurant. The town also has a post office and a bank.
The town is also home to several small manufacturing companies, including a metal fabrication plant and a plastics factory. The town is also home to a small airport, which serves the surrounding area.
Demographics
Atlasburg is a small borough with a population of 1,093 at the 2010 census. The population is primarily white (97.2%) and the median age is 44.7 years. The median household income is $41,944 and the median home value is $112,500.
The town is served by the Chartiers Valley School District. The town is also home to several churches, including the Atlasburg United Methodist Church and the Atlasburg Presbyterian Church.
Conclusion
Atlasburg is a small borough located in Washington County, Pennsylvania. The town was founded in 1832 by the Atlas brothers and was incorporated as a borough in 1867. The town is a small, rural community with a limited economy. The population of Atlasburg was 1,093 at the 2010 census. The town is primarily white and the median age is 44.7 years. The town is served by the Chartiers Valley School District and is home to several churches.
Common Questions
What is Per Capita Income in Atlasburg?
Per Capita income in Atlasburg is $34,034.
What is the Median Family Income in Atlasburg?
Median Family Income in Atlasburg is $148,750.
What is the Median Household income in Atlasburg?
Median Household Income in Atlasburg is $65,625.
What is Income or Wage Gap in Atlasburg?
Income or Wage Gap in Atlasburg is 40.0%.
Women in Atlasburg earn 60.0 cents for every dollar earned by a man.
What is Inequality or Gini Index in Atlasburg?
Inequality or Gini Index in Atlasburg is 0.36.
What is the Total Population of Atlasburg?
Total Population of Atlasburg is 556.
What is the Total Male Population of Atlasburg?
Total Male Population of Atlasburg is 283.
What is the Total Female Population of Atlasburg?
Total Female Population of Atlasburg is 273.
What is the Ratio of Males per 100 Females in Atlasburg?
There are 103.66 Males per 100 Females in Atlasburg.
What is the Ratio of Females per 100 Males in Atlasburg?
There are 96.47 Females per 100 Males in Atlasburg.
What is the Median Population Age in Atlasburg?
Median Population Age in Atlasburg is 37.7 Years.
What is the Average Family Size in Atlasburg
Average Family Size in Atlasburg is 3.9 People.
What is the Average Household Size in Atlasburg
Average Household Size in Atlasburg is 2.9 People.
How Large is the Labor Force in Atlasburg?
There are 314 People in the Labor Forcein in Atlasburg.
What is the Percentage of People in the Labor Force in Atlasburg?
72.5% of People are in the Labor Force in Atlasburg.