Pocono Pines, PA Map & Demographics
Pocono Pines Map
Pocono Pines Overview
$53,307
PER CAPITA INCOME
$95,060
AVG FAMILY INCOME
$95,833
AVG HOUSEHOLD INCOME
0.34
INEQUALITY / GINI INDEX
654
TOTAL POPULATION
391
MALE POPULATION
263
FEMALE POPULATION
148.67
MALES / 100 FEMALES
67.26
FEMALES / 100 MALES
65.4
MEDIAN AGE
2.4
AVG FAMILY SIZE
1.7
AVG HOUSEHOLD SIZE
287
LABOR FORCE [ PEOPLE ]
44.6%
PERCENT IN LABOR FORCE
7.7%
UNEMPLOYMENT RATE
Pocono Pines Zip Codes
Pocono Pines Area Codes
Income in Pocono Pines
Income Overview in Pocono Pines
Per Capita Income in Pocono Pines is $53,307, while median incomes of families and households are $95,060 and $95,833 respectively.
| Characteristic | Number | Measure |
| Per Capita Income | 654 | $53,307 |
| Median Family Income | 175 | $95,060 |
| Mean Family Income | 175 | $92,084 |
| Median Household Income | 382 | $95,833 |
| Mean Household Income | 382 | $89,247 |
| Income Deficit | 175 | $0 |
| Wage / Income Gap (%) | 654 | 0.00% |
| Wage / Income Gap ($) | 654 | 100.00¢ per $1 |
| Gini / Inequality Index | 654 | 0.34 |
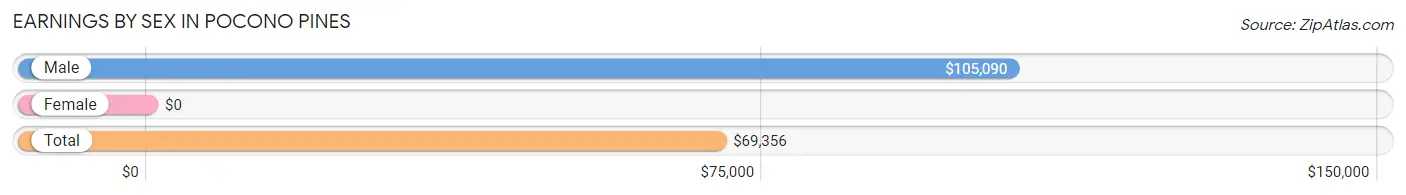
Earnings by Sex in Pocono Pines
| Sex | Number | Average Earnings |
| Male | 238 (75.6%) | $105,090 |
| Female | 77 (24.4%) | $0 |
| Total | 315 (100.0%) | $69,356 |
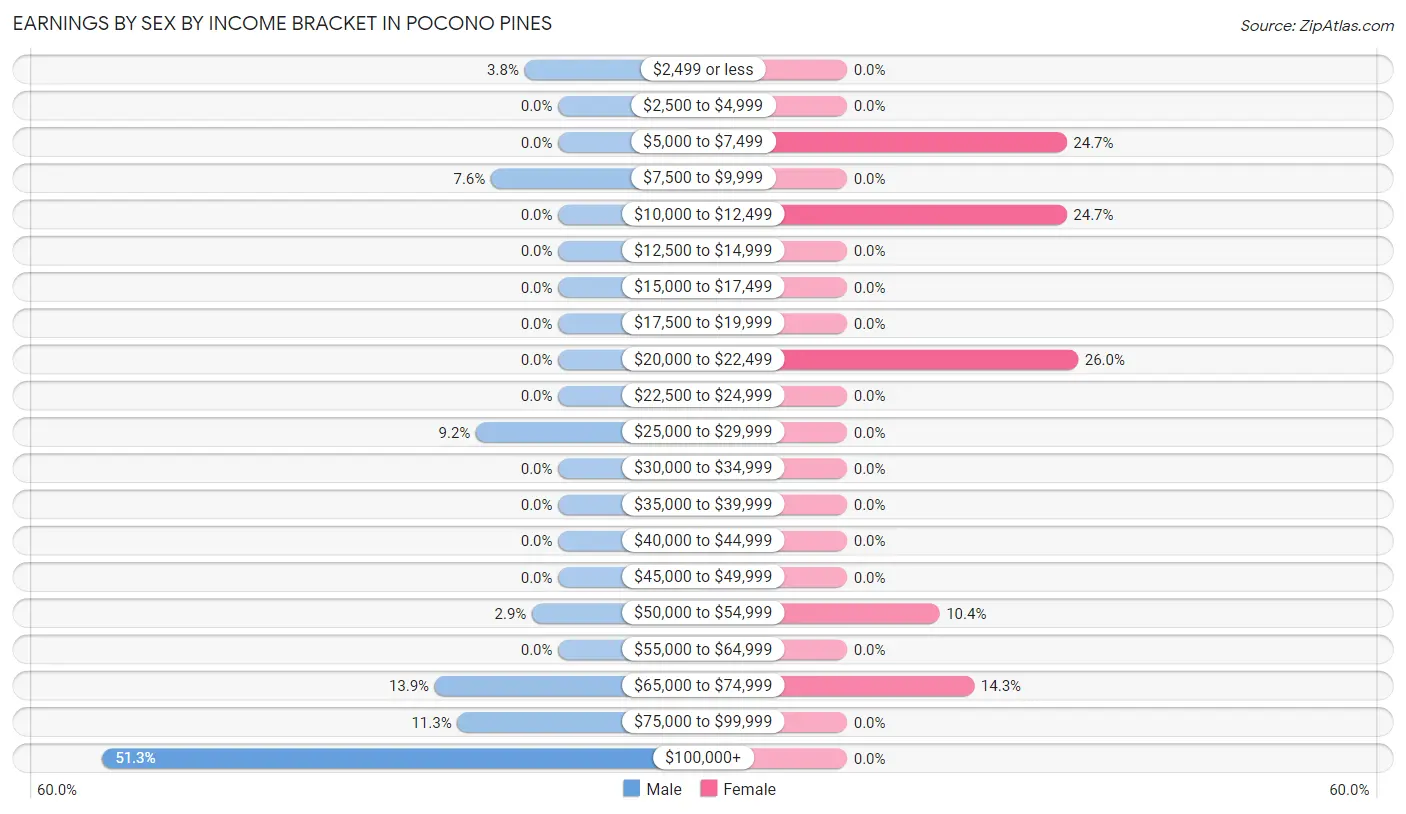
Earnings by Sex by Income Bracket in Pocono Pines
The most common earnings brackets in Pocono Pines are $100,000+ for men (122 | 51.3%) and $20,000 to $22,499 for women (20 | 26.0%).
| Income | Male | Female |
| $2,499 or less | 9 (3.8%) | 0 (0.0%) |
| $2,500 to $4,999 | 0 (0.0%) | 0 (0.0%) |
| $5,000 to $7,499 | 0 (0.0%) | 19 (24.7%) |
| $7,500 to $9,999 | 18 (7.6%) | 0 (0.0%) |
| $10,000 to $12,499 | 0 (0.0%) | 19 (24.7%) |
| $12,500 to $14,999 | 0 (0.0%) | 0 (0.0%) |
| $15,000 to $17,499 | 0 (0.0%) | 0 (0.0%) |
| $17,500 to $19,999 | 0 (0.0%) | 0 (0.0%) |
| $20,000 to $22,499 | 0 (0.0%) | 20 (26.0%) |
| $22,500 to $24,999 | 0 (0.0%) | 0 (0.0%) |
| $25,000 to $29,999 | 22 (9.2%) | 0 (0.0%) |
| $30,000 to $34,999 | 0 (0.0%) | 0 (0.0%) |
| $35,000 to $39,999 | 0 (0.0%) | 0 (0.0%) |
| $40,000 to $44,999 | 0 (0.0%) | 0 (0.0%) |
| $45,000 to $49,999 | 0 (0.0%) | 0 (0.0%) |
| $50,000 to $54,999 | 7 (2.9%) | 8 (10.4%) |
| $55,000 to $64,999 | 0 (0.0%) | 0 (0.0%) |
| $65,000 to $74,999 | 33 (13.9%) | 11 (14.3%) |
| $75,000 to $99,999 | 27 (11.3%) | 0 (0.0%) |
| $100,000+ | 122 (51.3%) | 0 (0.0%) |
| Total | 238 (100.0%) | 77 (100.0%) |
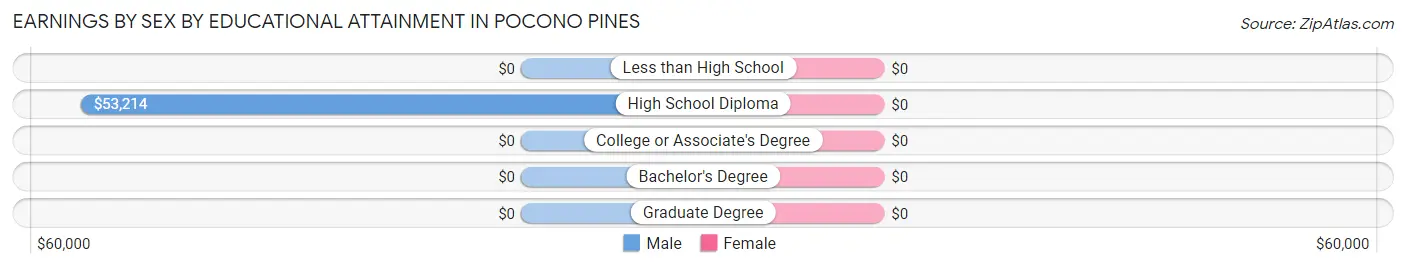
Earnings by Sex by Educational Attainment in Pocono Pines
| Educational Attainment | Male Income | Female Income |
| Less than High School | - | - |
| High School Diploma | $53,214 | $0 |
| College or Associate's Degree | - | - |
| Bachelor's Degree | - | - |
| Graduate Degree | - | - |
| Total | $105,090 | $0 |
Family Income in Pocono Pines
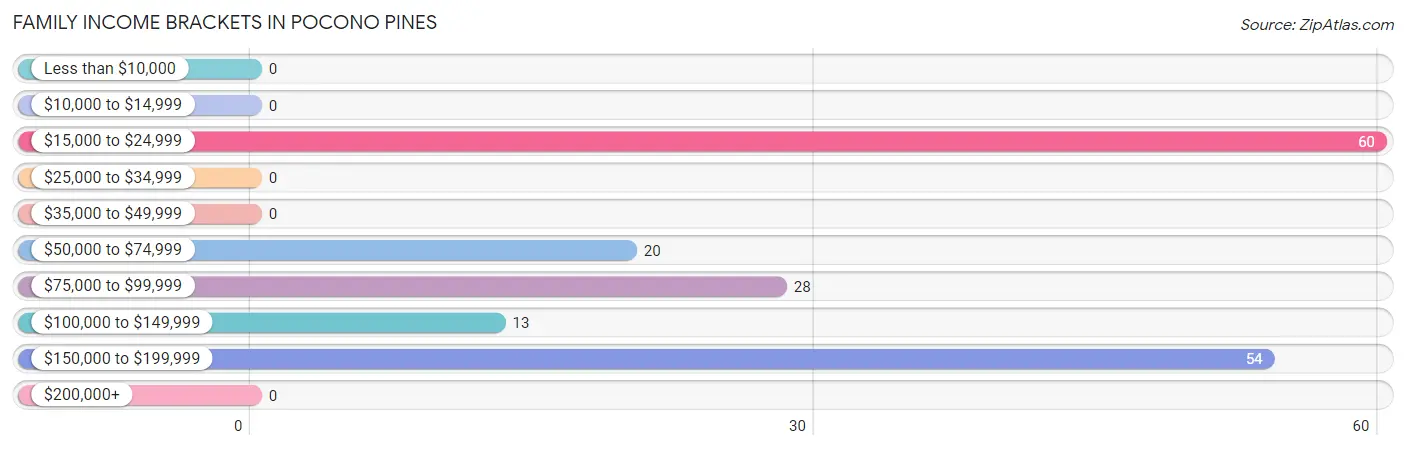
Family Income Brackets in Pocono Pines
According to the Pocono Pines family income data, there are 60 families falling into the $15,000 to $24,999 income range, which is the most common income bracket and makes up 34.3% of all families.
| Income Bracket | # Families | % Families |
| Less than $10,000 | 0 | 0.0% |
| $10,000 to $14,999 | 0 | 0.0% |
| $15,000 to $24,999 | 60 | 34.3% |
| $25,000 to $34,999 | 0 | 0.0% |
| $35,000 to $49,999 | 0 | 0.0% |
| $50,000 to $74,999 | 20 | 11.4% |
| $75,000 to $99,999 | 28 | 16.0% |
| $100,000 to $149,999 | 13 | 7.4% |
| $150,000 to $199,999 | 54 | 30.9% |
| $200,000+ | 0 | 0.0% |
Family Income by Famaliy Size in Pocono Pines
| Income Bracket | # Families | Median Income |
| 2-Person Families | 128 (73.1%) | $0 |
| 3-Person Families | 47 (26.9%) | $0 |
| 4-Person Families | 0 (0.0%) | $0 |
| 5-Person Families | 0 (0.0%) | $0 |
| 6-Person Families | 0 (0.0%) | $0 |
| 7+ Person Families | 0 (0.0%) | $0 |
| Total | 175 (100.0%) | $95,060 |
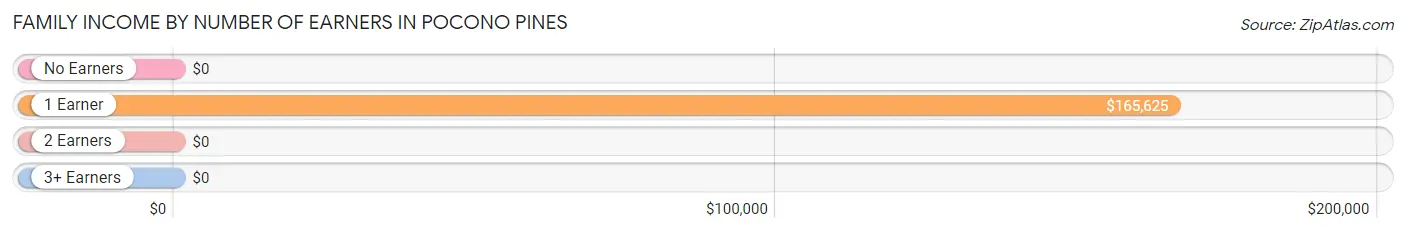
Family Income by Number of Earners in Pocono Pines
| Number of Earners | # Families | Median Income |
| No Earners | 81 (46.3%) | $0 |
| 1 Earner | 61 (34.9%) | $165,625 |
| 2 Earners | 33 (18.9%) | $0 |
| 3+ Earners | 0 (0.0%) | $0 |
| Total | 175 (100.0%) | $95,060 |
Household Income in Pocono Pines
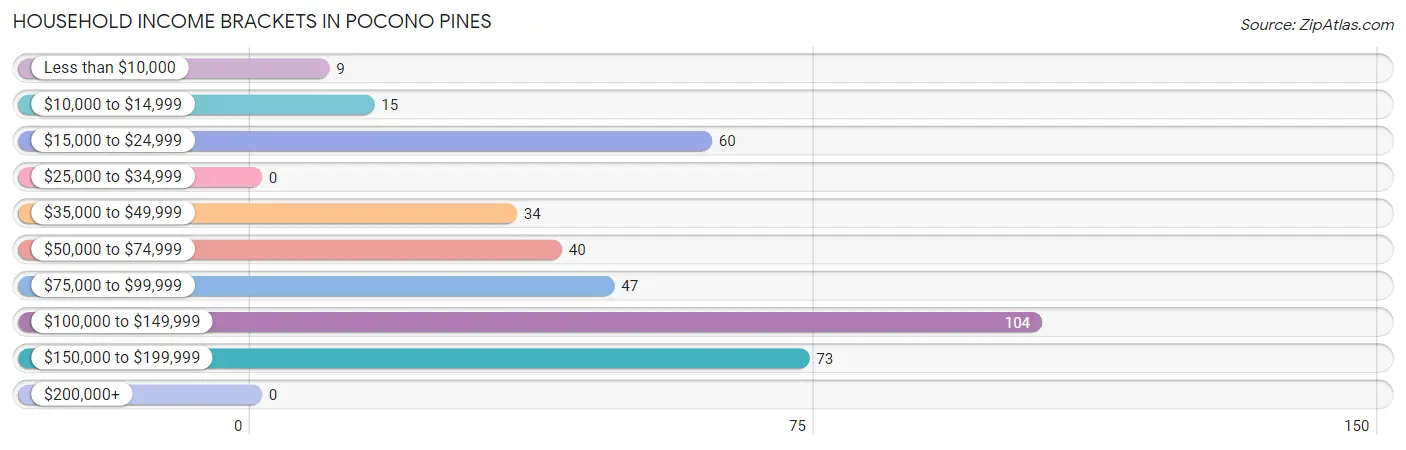
Household Income Brackets in Pocono Pines
With 104 households falling in the category, the $100,000 to $149,999 income range is the most frequent in Pocono Pines, accounting for 27.2% of all households.
| Income Bracket | # Households | % Households |
| Less than $10,000 | 9 | 2.4% |
| $10,000 to $14,999 | 15 | 3.9% |
| $15,000 to $24,999 | 60 | 15.7% |
| $25,000 to $34,999 | 0 | 0.0% |
| $35,000 to $49,999 | 34 | 8.9% |
| $50,000 to $74,999 | 40 | 10.5% |
| $75,000 to $99,999 | 47 | 12.3% |
| $100,000 to $149,999 | 104 | 27.2% |
| $150,000 to $199,999 | 73 | 19.1% |
| $200,000+ | 0 | 0.0% |
Household Income by Householder Age in Pocono Pines
The median household income in Pocono Pines is $95,833, with the highest median household income of $105,723 found in the 45 to 64 years age bracket for the primary householder. A total of 172 households (45.0%) fall into this category.
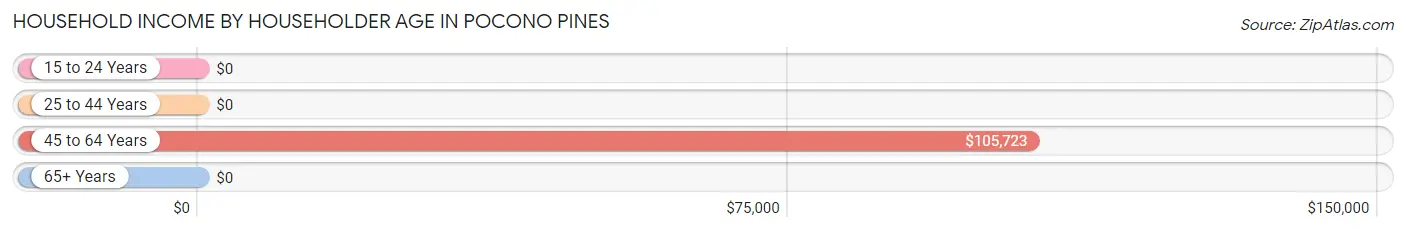
| Income Bracket | # Households | Median Income |
| 15 to 24 Years | 0 (0.0%) | $0 |
| 25 to 44 Years | 8 (2.1%) | $0 |
| 45 to 64 Years | 172 (45.0%) | $105,723 |
| 65+ Years | 202 (52.9%) | $0 |
| Total | 382 (100.0%) | $95,833 |
Poverty in Pocono Pines
Income Below Poverty by Sex and Age in Pocono Pines
With 2.3% poverty level for males and 5.7% for females among the residents of Pocono Pines, 75 year old and over males and 55 to 64 year old females are the most vulnerable to poverty, with 9 males (23.1%) and 15 females (41.7%) in their respective age groups living below the poverty level.
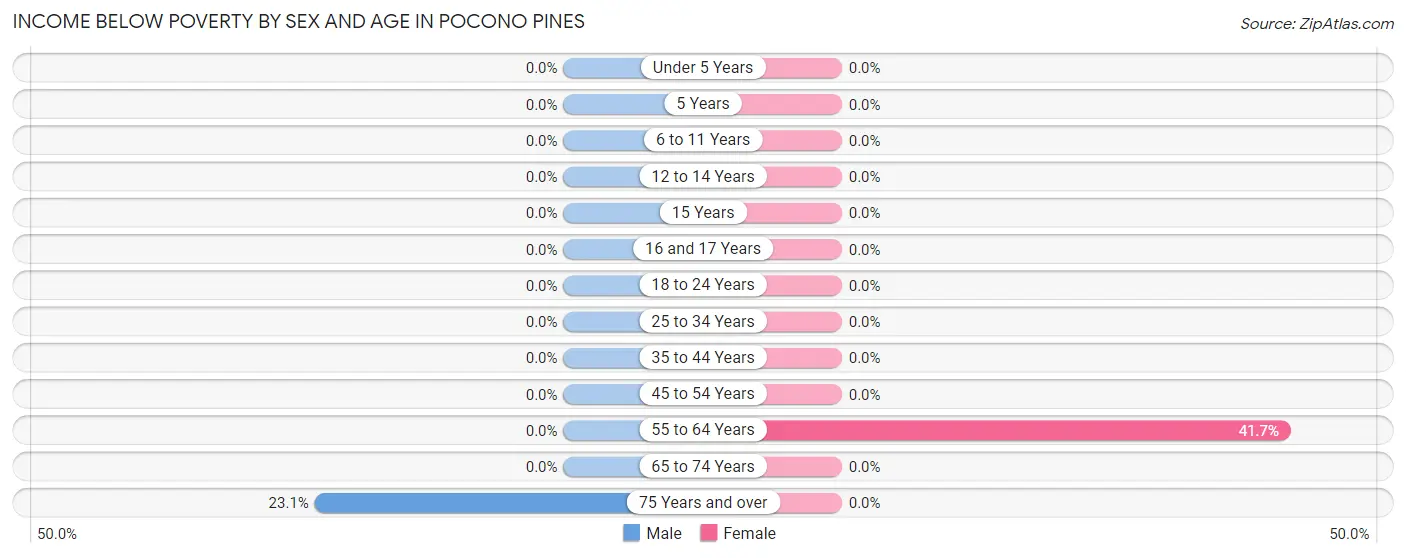
| Age Bracket | Male | Female |
| Under 5 Years | 0 (0.0%) | 0 (0.0%) |
| 5 Years | 0 (0.0%) | 0 (0.0%) |
| 6 to 11 Years | 0 (0.0%) | 0 (0.0%) |
| 12 to 14 Years | 0 (0.0%) | 0 (0.0%) |
| 15 Years | 0 (0.0%) | 0 (0.0%) |
| 16 and 17 Years | 0 (0.0%) | 0 (0.0%) |
| 18 to 24 Years | 0 (0.0%) | 0 (0.0%) |
| 25 to 34 Years | 0 (0.0%) | 0 (0.0%) |
| 35 to 44 Years | 0 (0.0%) | 0 (0.0%) |
| 45 to 54 Years | 0 (0.0%) | 0 (0.0%) |
| 55 to 64 Years | 0 (0.0%) | 15 (41.7%) |
| 65 to 74 Years | 0 (0.0%) | 0 (0.0%) |
| 75 Years and over | 9 (23.1%) | 0 (0.0%) |
| Total | 9 (2.3%) | 15 (5.7%) |
Income Above Poverty by Sex and Age in Pocono Pines
According to the poverty statistics in Pocono Pines, males aged 25 to 34 years and females aged 6 to 11 years are the age groups that are most secure financially, with 100.0% of males and 100.0% of females in these age groups living above the poverty line.
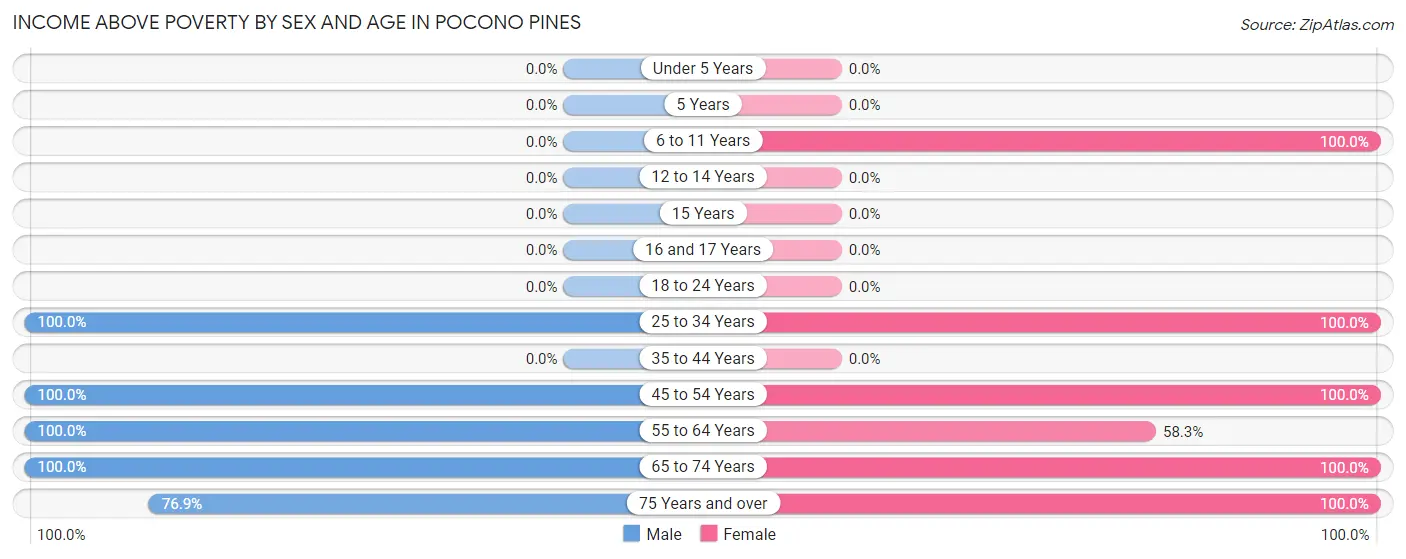
| Age Bracket | Male | Female |
| Under 5 Years | 0 (0.0%) | 0 (0.0%) |
| 5 Years | 0 (0.0%) | 0 (0.0%) |
| 6 to 11 Years | 0 (0.0%) | 11 (100.0%) |
| 12 to 14 Years | 0 (0.0%) | 0 (0.0%) |
| 15 Years | 0 (0.0%) | 0 (0.0%) |
| 16 and 17 Years | 0 (0.0%) | 0 (0.0%) |
| 18 to 24 Years | 0 (0.0%) | 0 (0.0%) |
| 25 to 34 Years | 37 (100.0%) | 26 (100.0%) |
| 35 to 44 Years | 0 (0.0%) | 0 (0.0%) |
| 45 to 54 Years | 125 (100.0%) | 31 (100.0%) |
| 55 to 64 Years | 50 (100.0%) | 21 (58.3%) |
| 65 to 74 Years | 140 (100.0%) | 113 (100.0%) |
| 75 Years and over | 30 (76.9%) | 46 (100.0%) |
| Total | 382 (97.7%) | 248 (94.3%) |
Income Below Poverty Among Married-Couple Families in Pocono Pines
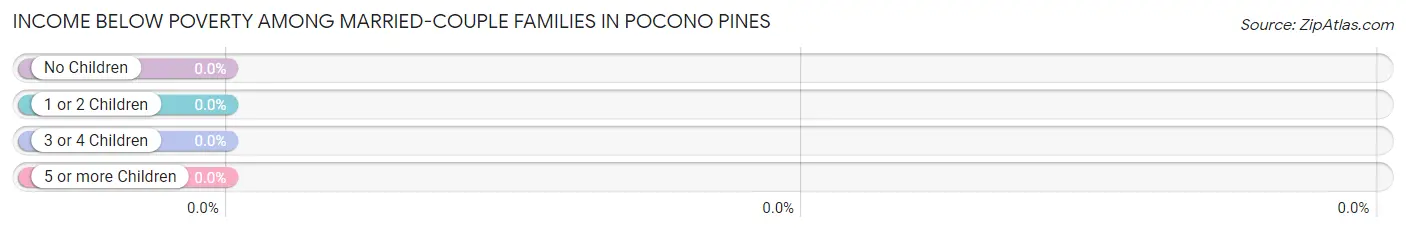
| Children | Above Poverty | Below Poverty |
| No Children | 162 (100.0%) | 0 (0.0%) |
| 1 or 2 Children | 13 (100.0%) | 0 (0.0%) |
| 3 or 4 Children | 0 (0.0%) | 0 (0.0%) |
| 5 or more Children | 0 (0.0%) | 0 (0.0%) |
| Total | 175 (100.0%) | 0 (0.0%) |
Income Below Poverty Among Single-Parent Households in Pocono Pines
| Children | Single Father | Single Mother |
| No Children | 0 (0.0%) | 0 (0.0%) |
| 1 or 2 Children | 0 (0.0%) | 0 (0.0%) |
| 3 or 4 Children | 0 (0.0%) | 0 (0.0%) |
| 5 or more Children | 0 (0.0%) | 0 (0.0%) |
| Total | 0 (0.0%) | 0 (0.0%) |
Income Below Poverty Among Married-Couple vs Single-Parent Households in Pocono Pines
| Children | Married-Couple Families | Single-Parent Households |
| No Children | 0 (0.0%) | 0 (0.0%) |
| 1 or 2 Children | 0 (0.0%) | 0 (0.0%) |
| 3 or 4 Children | 0 (0.0%) | 0 (0.0%) |
| 5 or more Children | 0 (0.0%) | 0 (0.0%) |
| Total | 0 (0.0%) | 0 (0.0%) |
Race in Pocono Pines
The most populous races in Pocono Pines are White / Caucasian (528 | 80.7%), Asian (83 | 12.7%), and Two or more Races (43 | 6.6%).
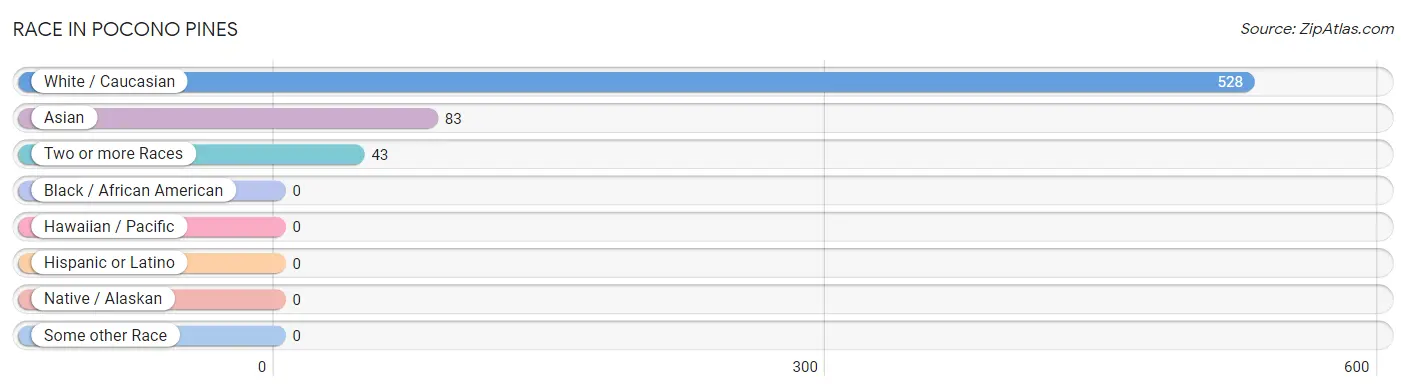
| Race | # Population | % Population |
| Asian | 83 | 12.7% |
| Black / African American | 0 | 0.0% |
| Hawaiian / Pacific | 0 | 0.0% |
| Hispanic or Latino | 0 | 0.0% |
| Native / Alaskan | 0 | 0.0% |
| White / Caucasian | 528 | 80.7% |
| Two or more Races | 43 | 6.6% |
| Some other Race | 0 | 0.0% |
| Total | 654 | 100.0% |
Ancestry in Pocono Pines
The most populous ancestries reported in Pocono Pines are German (148 | 22.6%), Italian (146 | 22.3%), Irish (91 | 13.9%), Burmese (83 | 12.7%), and Polish (68 | 10.4%), together accounting for 82.0% of all Pocono Pines residents.
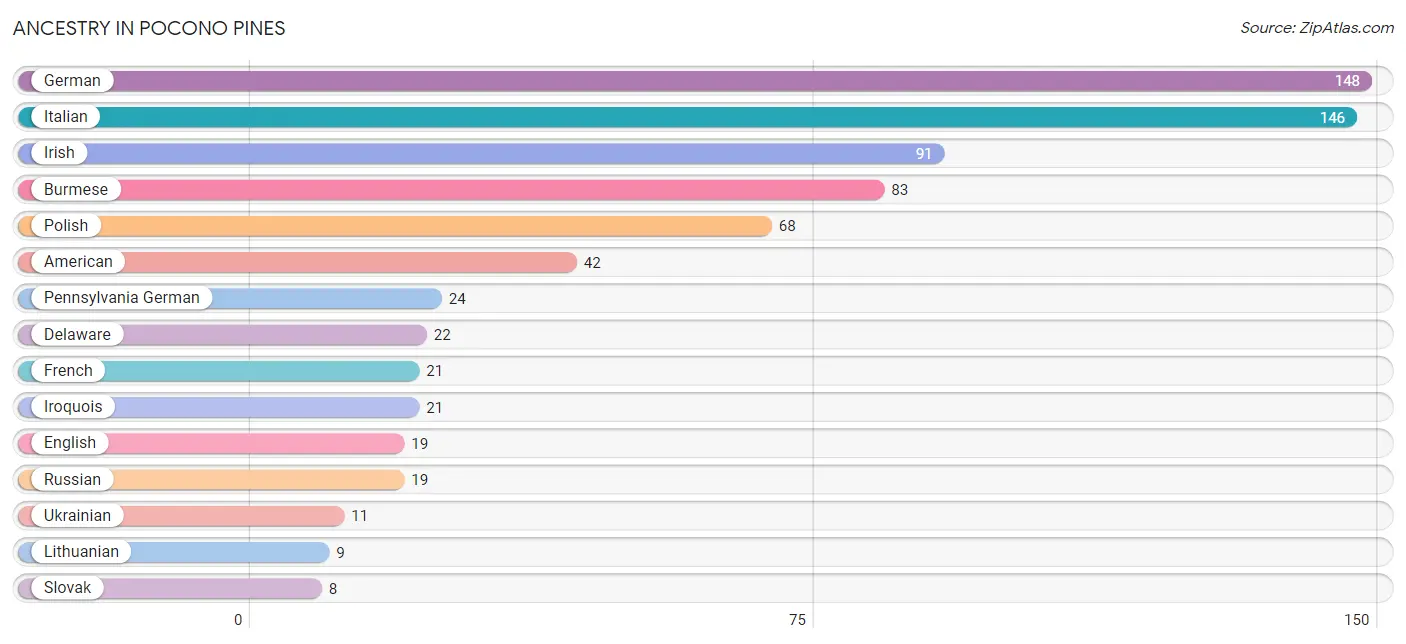
| Ancestry | # Population | % Population |
| American | 42 | 6.4% |
| Burmese | 83 | 12.7% |
| Delaware | 22 | 3.4% |
| English | 19 | 2.9% |
| French | 21 | 3.2% |
| German | 148 | 22.6% |
| Irish | 91 | 13.9% |
| Iroquois | 21 | 3.2% |
| Italian | 146 | 22.3% |
| Lithuanian | 9 | 1.4% |
| Pennsylvania German | 24 | 3.7% |
| Polish | 68 | 10.4% |
| Russian | 19 | 2.9% |
| Slovak | 8 | 1.2% |
| Ukrainian | 11 | 1.7% | View All 15 Rows |
Immigrants in Pocono Pines
The most numerous immigrant groups reported in Pocono Pines came from Asia (83 | 12.7%), Eastern Asia (83 | 12.7%), and Korea (83 | 12.7%), together accounting for 38.1% of all Pocono Pines residents.
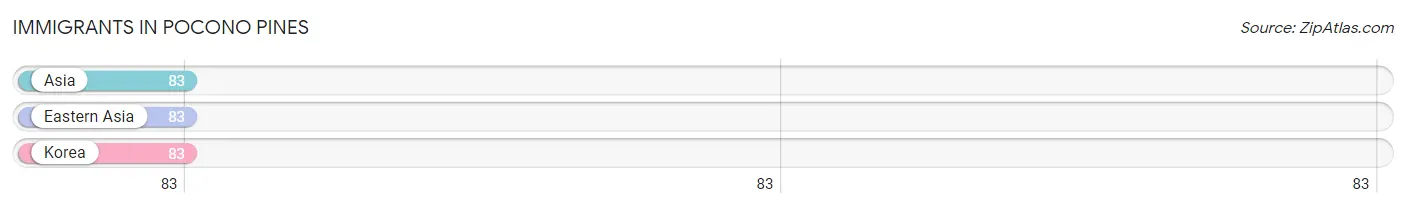
| Immigration Origin | # Population | % Population |
| Asia | 83 | 12.7% |
| Eastern Asia | 83 | 12.7% |
| Korea | 83 | 12.7% | View All 3 Rows |
Sex and Age in Pocono Pines
Sex and Age in Pocono Pines
The most populous age groups in Pocono Pines are 50 to 54 Years (105 | 26.9%) for men and 70 to 74 Years (60 | 22.8%) for women.
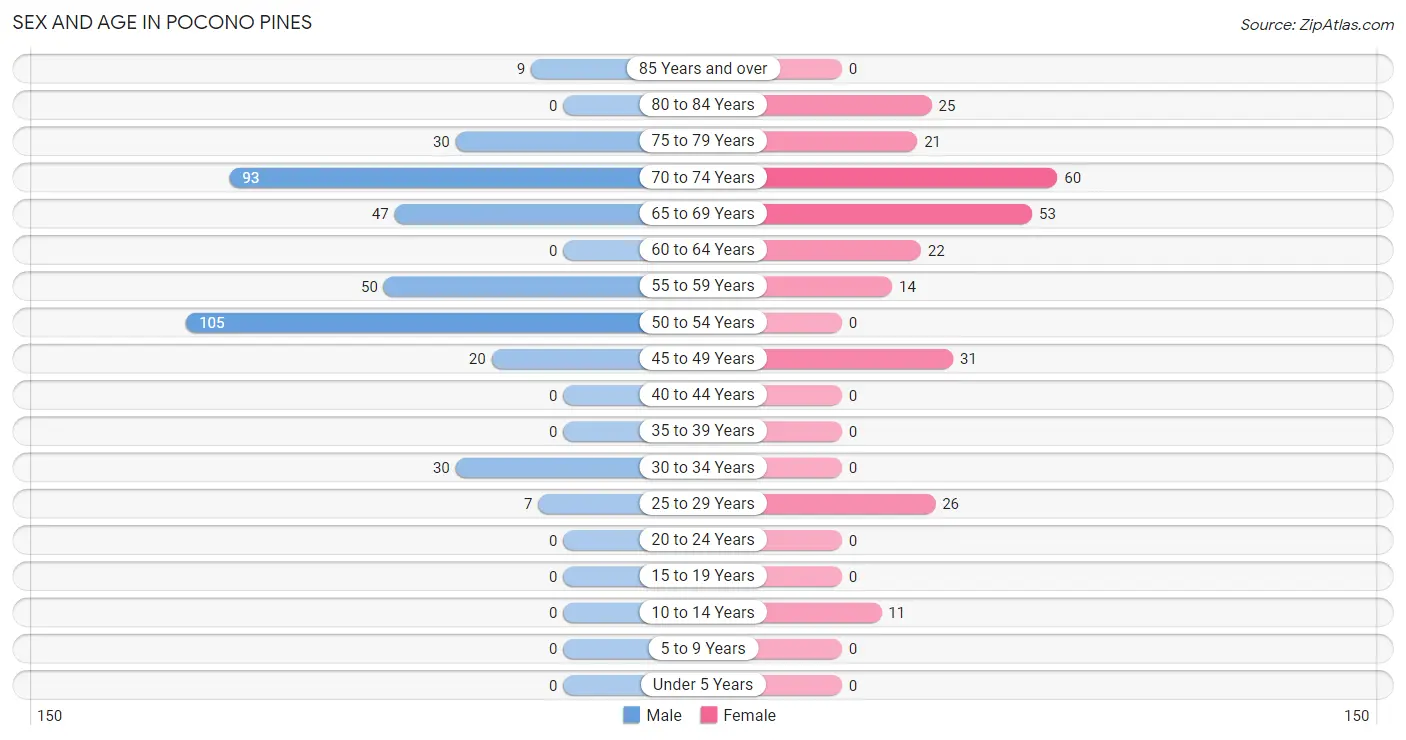
| Age Bracket | Male | Female |
| Under 5 Years | 0 (0.0%) | 0 (0.0%) |
| 5 to 9 Years | 0 (0.0%) | 0 (0.0%) |
| 10 to 14 Years | 0 (0.0%) | 11 (4.2%) |
| 15 to 19 Years | 0 (0.0%) | 0 (0.0%) |
| 20 to 24 Years | 0 (0.0%) | 0 (0.0%) |
| 25 to 29 Years | 7 (1.8%) | 26 (9.9%) |
| 30 to 34 Years | 30 (7.7%) | 0 (0.0%) |
| 35 to 39 Years | 0 (0.0%) | 0 (0.0%) |
| 40 to 44 Years | 0 (0.0%) | 0 (0.0%) |
| 45 to 49 Years | 20 (5.1%) | 31 (11.8%) |
| 50 to 54 Years | 105 (26.9%) | 0 (0.0%) |
| 55 to 59 Years | 50 (12.8%) | 14 (5.3%) |
| 60 to 64 Years | 0 (0.0%) | 22 (8.4%) |
| 65 to 69 Years | 47 (12.0%) | 53 (20.2%) |
| 70 to 74 Years | 93 (23.8%) | 60 (22.8%) |
| 75 to 79 Years | 30 (7.7%) | 21 (8.0%) |
| 80 to 84 Years | 0 (0.0%) | 25 (9.5%) |
| 85 Years and over | 9 (2.3%) | 0 (0.0%) |
| Total | 391 (100.0%) | 263 (100.0%) |
Families and Households in Pocono Pines
Median Family Size in Pocono Pines
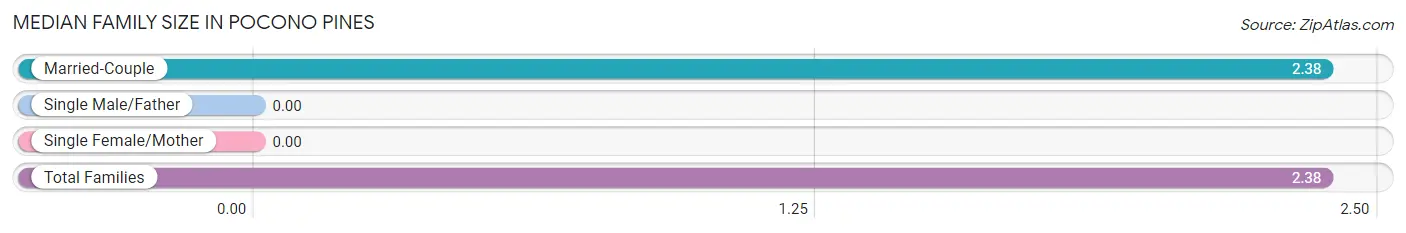
| Family Type | # Families | Family Size |
| Married-Couple | 175 (100.0%) | 2.38 |
| Single Male/Father | 0 (0.0%) | - |
| Single Female/Mother | 0 (0.0%) | - |
| Total Families | 175 (100.0%) | 2.38 |
Median Household Size in Pocono Pines
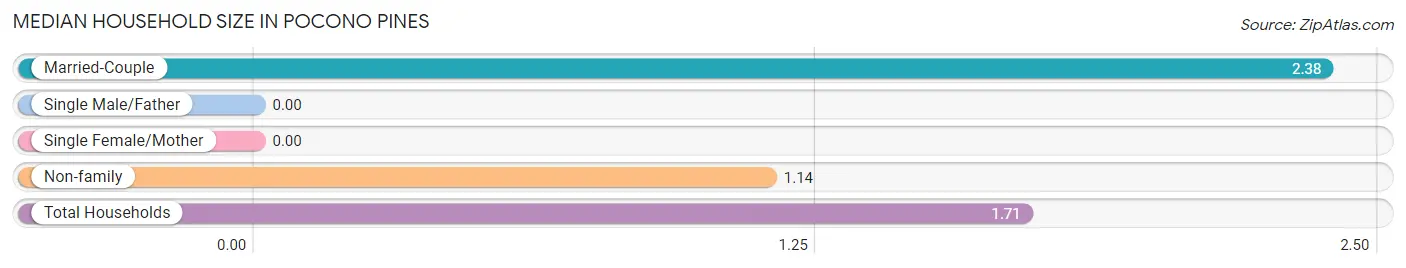
| Household Type | # Households | Household Size |
| Married-Couple | 175 (45.8%) | 2.38 |
| Single Male/Father | 0 (0.0%) | - |
| Single Female/Mother | 0 (0.0%) | - |
| Non-family | 207 (54.2%) | 1.14 |
| Total Households | 382 (100.0%) | 1.71 |
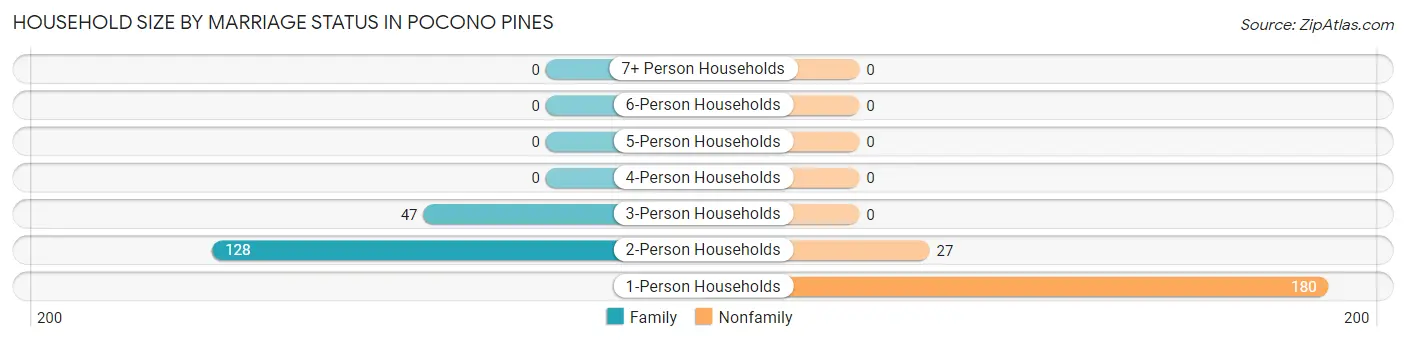
Household Size by Marriage Status in Pocono Pines
Out of a total of 382 households in Pocono Pines, 175 (45.8%) are family households, while 207 (54.2%) are nonfamily households. The most numerous type of family households are 2-person households, comprising 128, and the most common type of nonfamily households are 1-person households, comprising 180.
| Household Size | Family Households | Nonfamily Households |
| 1-Person Households | - | 180 (47.1%) |
| 2-Person Households | 128 (33.5%) | 27 (7.1%) |
| 3-Person Households | 47 (12.3%) | 0 (0.0%) |
| 4-Person Households | 0 (0.0%) | 0 (0.0%) |
| 5-Person Households | 0 (0.0%) | 0 (0.0%) |
| 6-Person Households | 0 (0.0%) | 0 (0.0%) |
| 7+ Person Households | 0 (0.0%) | 0 (0.0%) |
| Total | 175 (45.8%) | 207 (54.2%) |
Female Fertility in Pocono Pines
Fertility by Age in Pocono Pines
| Age Bracket | Women with Births | Births / 1,000 Women |
| 15 to 19 years | 0 (0.0%) | 0.0 |
| 20 to 34 years | 0 (0.0%) | 0.0 |
| 35 to 50 years | 0 (0.0%) | 0.0 |
| Total | 0 (0.0%) | 0.0 |
Fertility by Age by Marriage Status in Pocono Pines
| Age Bracket | Married | Unmarried |
| 15 to 19 years | 0 (0.0%) | 0 (0.0%) |
| 20 to 34 years | 0 (0.0%) | 0 (0.0%) |
| 35 to 50 years | 0 (0.0%) | 0 (0.0%) |
| Total | 0 (0.0%) | 0 (0.0%) |
Fertility by Education in Pocono Pines
| Educational Attainment | Women with Births | Births / 1,000 Women |
| Less than High School | 0 (0.0%) | 0.0 |
| High School Diploma | 0 (0.0%) | 0.0 |
| College or Associate's Degree | 0 (0.0%) | 0.0 |
| Bachelor's Degree | 0 (0.0%) | 0.0 |
| Graduate Degree | 0 (0.0%) | 0.0 |
| Total | 0 (0.0%) | 0.0 |
Fertility by Education by Marriage Status in Pocono Pines
| Educational Attainment | Married | Unmarried |
| Less than High School | 0 (0.0%) | 0 (0.0%) |
| High School Diploma | 0 (0.0%) | 0 (0.0%) |
| College or Associate's Degree | 0 (0.0%) | 0 (0.0%) |
| Bachelor's Degree | 0 (0.0%) | 0 (0.0%) |
| Graduate Degree | 0 (0.0%) | 0 (0.0%) |
| Total | 0 (0.0%) | 0 (0.0%) |
Employment Characteristics in Pocono Pines
Employment by Class of Employer in Pocono Pines
Among the 259 employed individuals in Pocono Pines, private company employees (109 | 42.1%), local government employees (101 | 39.0%), and not-for-profit organizations (29 | 11.2%) make up the most common classes of employment.
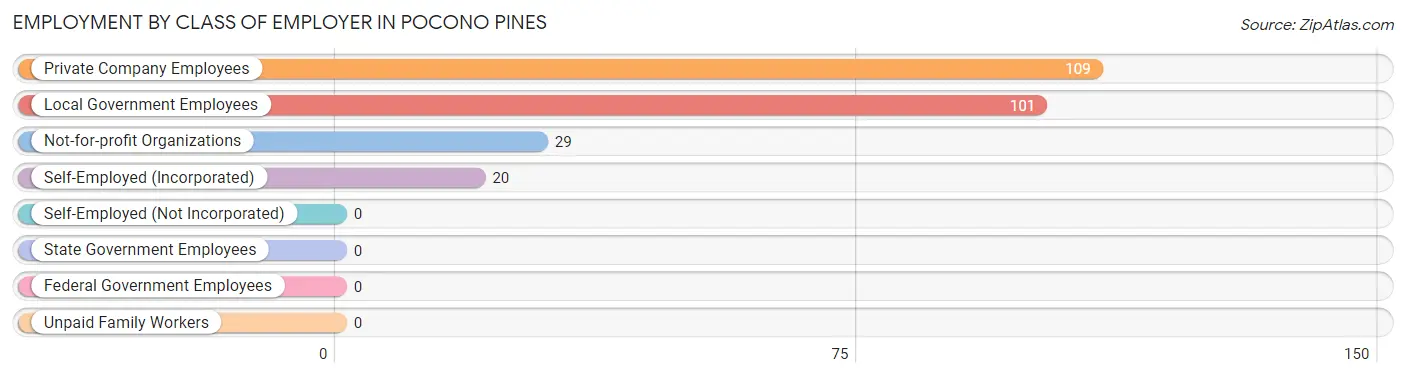
| Employer Class | # Employees | % Employees |
| Private Company Employees | 109 | 42.1% |
| Self-Employed (Incorporated) | 20 | 7.7% |
| Self-Employed (Not Incorporated) | 0 | 0.0% |
| Not-for-profit Organizations | 29 | 11.2% |
| Local Government Employees | 101 | 39.0% |
| State Government Employees | 0 | 0.0% |
| Federal Government Employees | 0 | 0.0% |
| Unpaid Family Workers | 0 | 0.0% |
| Total | 259 | 100.0% |
Employment Status by Age in Pocono Pines
According to the labor force statistics for Pocono Pines, out of the total population over 16 years of age (643), 44.6% or 287 individuals are in the labor force, with 7.7% or 22 of them unemployed. The age group with the highest labor force participation rate is 45 to 54 years, with 100.0% or 156 individuals in the labor force. Within the labor force, the 45 to 54 years age range has the highest percentage of unemployed individuals, with 14.1% or 22 of them being unemployed.
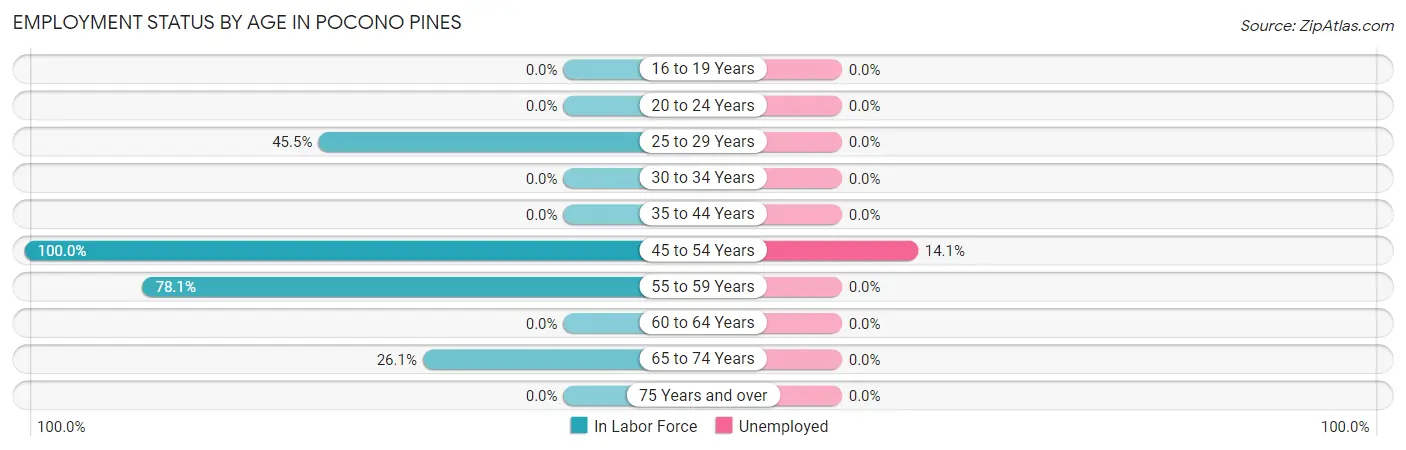
| Age Bracket | In Labor Force | Unemployed |
| 16 to 19 Years | 0 (0.0%) | 0 (0.0%) |
| 20 to 24 Years | 0 (0.0%) | 0 (0.0%) |
| 25 to 29 Years | 15 (45.5%) | 0 (0.0%) |
| 30 to 34 Years | 0 (0.0%) | 0 (0.0%) |
| 35 to 44 Years | 0 (0.0%) | 0 (0.0%) |
| 45 to 54 Years | 156 (100.0%) | 22 (14.1%) |
| 55 to 59 Years | 50 (78.1%) | 0 (0.0%) |
| 60 to 64 Years | 0 (0.0%) | 0 (0.0%) |
| 65 to 74 Years | 66 (26.1%) | 0 (0.0%) |
| 75 Years and over | 0 (0.0%) | 0 (0.0%) |
| Total | 287 (44.6%) | 22 (7.7%) |
Employment Status by Educational Attainment in Pocono Pines
According to labor force statistics for Pocono Pines, 72.5% of individuals (221) out of the total population between 25 and 64 years of age (305) are in the labor force, with 10.0% or 22 of them being unemployed. The group with the highest labor force participation rate are those with the educational attainment of bachelor's degree or higher, with 100.0% or 112 individuals in the labor force. Within the labor force, individuals with high school diploma education have the highest percentage of unemployment, with 35.5% or 22 of them being unemployed.
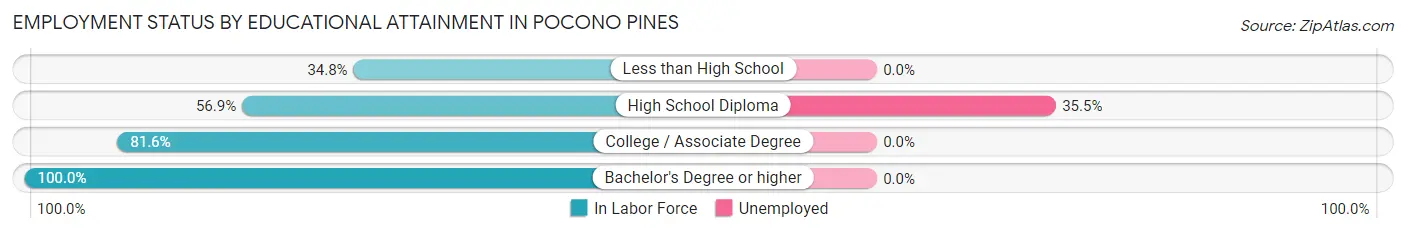
| Educational Attainment | In Labor Force | Unemployed |
| Less than High School | 16 (34.8%) | 0 (0.0%) |
| High School Diploma | 62 (56.9%) | 39 (35.5%) |
| College / Associate Degree | 31 (81.6%) | 0 (0.0%) |
| Bachelor's Degree or higher | 112 (100.0%) | 0 (0.0%) |
| Total | 221 (72.5%) | 30 (10.0%) |
Employment Occupations by Sex in Pocono Pines
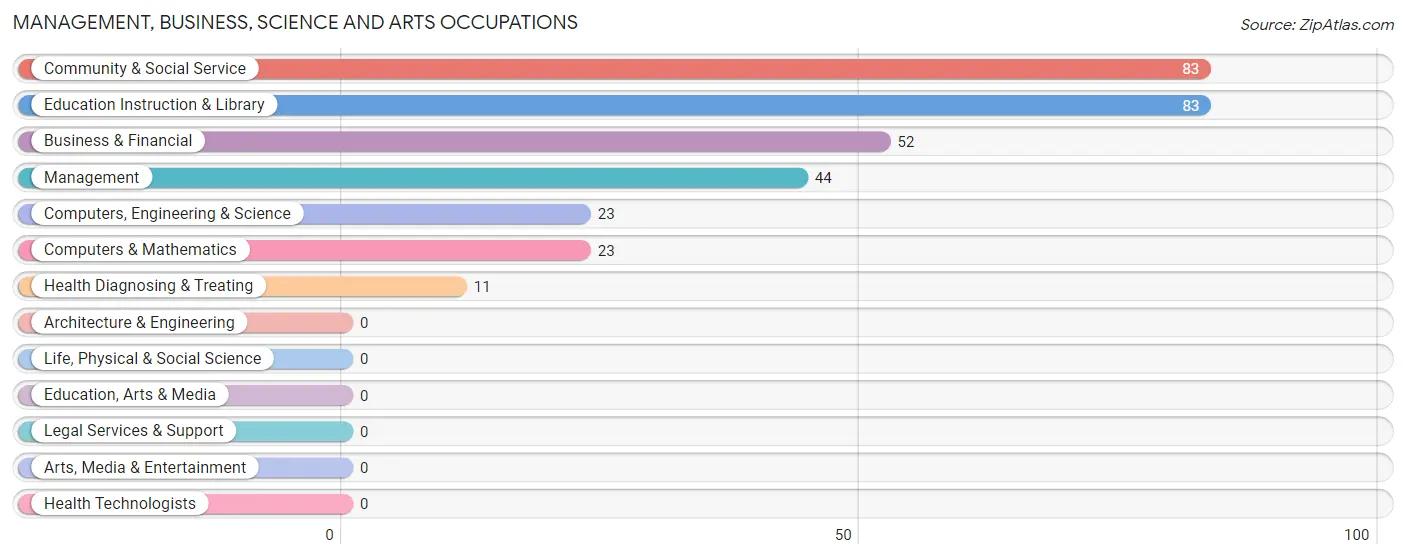
Management, Business, Science and Arts Occupations
The most common Management, Business, Science and Arts occupations in Pocono Pines are Community & Social Service (83 | 31.3%), Education Instruction & Library (83 | 31.3%), Business & Financial (52 | 19.6%), Management (44 | 16.6%), and Computers, Engineering & Science (23 | 8.7%).
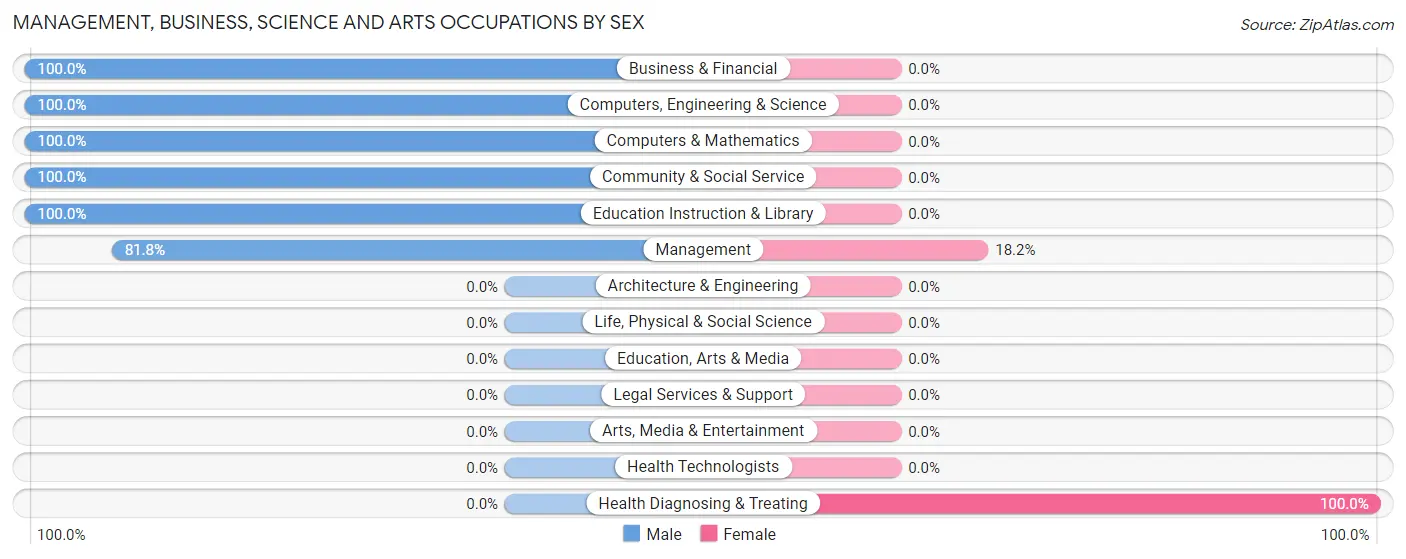
Management, Business, Science and Arts Occupations by Sex
Within the Management, Business, Science and Arts occupations in Pocono Pines, the most male-oriented occupations are Business & Financial (100.0%), Computers, Engineering & Science (100.0%), and Computers & Mathematics (100.0%), while the most female-oriented occupations are Health Diagnosing & Treating (100.0%), and Management (18.2%).
| Occupation | Male | Female |
| Management | 36 (81.8%) | 8 (18.2%) |
| Business & Financial | 52 (100.0%) | 0 (0.0%) |
| Computers, Engineering & Science | 23 (100.0%) | 0 (0.0%) |
| Computers & Mathematics | 23 (100.0%) | 0 (0.0%) |
| Architecture & Engineering | 0 (0.0%) | 0 (0.0%) |
| Life, Physical & Social Science | 0 (0.0%) | 0 (0.0%) |
| Community & Social Service | 83 (100.0%) | 0 (0.0%) |
| Education, Arts & Media | 0 (0.0%) | 0 (0.0%) |
| Legal Services & Support | 0 (0.0%) | 0 (0.0%) |
| Education Instruction & Library | 83 (100.0%) | 0 (0.0%) |
| Arts, Media & Entertainment | 0 (0.0%) | 0 (0.0%) |
| Health Diagnosing & Treating | 0 (0.0%) | 11 (100.0%) |
| Health Technologists | 0 (0.0%) | 0 (0.0%) |
| Total (Category) | 194 (91.1%) | 19 (8.9%) |
| Total (Overall) | 207 (78.1%) | 58 (21.9%) |
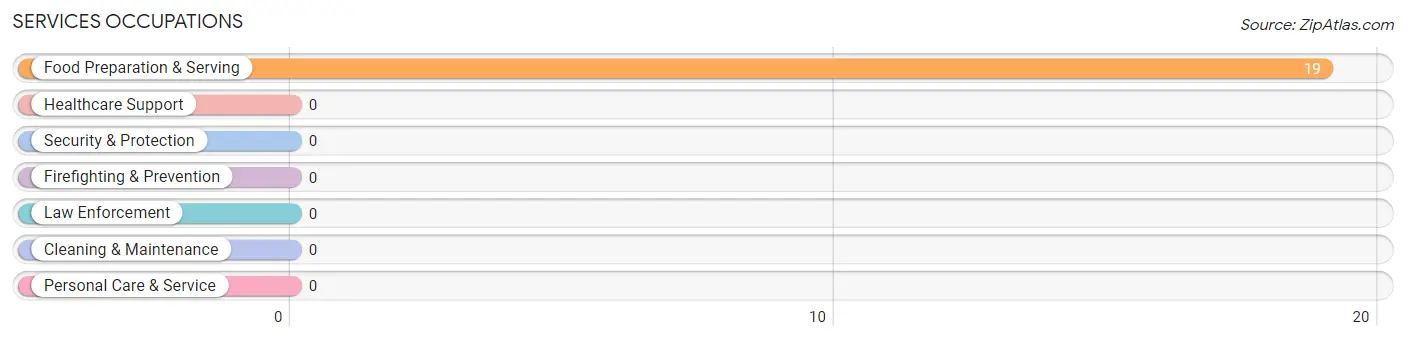
Services Occupations
The most common Services occupations in Pocono Pines are , and Food Preparation & Serving (19 | 7.2%).
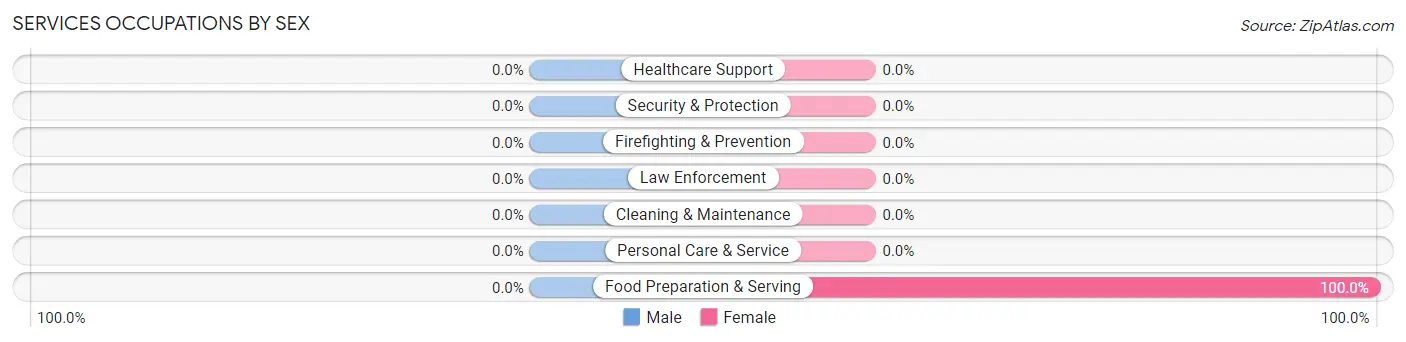
Services Occupations by Sex
| Occupation | Male | Female |
| Healthcare Support | 0 (0.0%) | 0 (0.0%) |
| Security & Protection | 0 (0.0%) | 0 (0.0%) |
| Firefighting & Prevention | 0 (0.0%) | 0 (0.0%) |
| Law Enforcement | 0 (0.0%) | 0 (0.0%) |
| Food Preparation & Serving | 0 (0.0%) | 19 (100.0%) |
| Cleaning & Maintenance | 0 (0.0%) | 0 (0.0%) |
| Personal Care & Service | 0 (0.0%) | 0 (0.0%) |
| Total (Category) | 0 (0.0%) | 19 (100.0%) |
| Total (Overall) | 207 (78.1%) | 58 (21.9%) |
Sales and Office Occupations
Sales and Office Occupations by Sex
| Occupation | Male | Female |
| Sales & Related | 0 (0.0%) | 0 (0.0%) |
| Office & Administration | 0 (0.0%) | 0 (0.0%) |
| Total (Category) | 0 (0.0%) | 0 (0.0%) |
| Total (Overall) | 207 (78.1%) | 58 (21.9%) |
Natural Resources, Construction and Maintenance Occupations
The most common Natural Resources, Construction and Maintenance occupations in Pocono Pines are , and Construction & Extraction (6 | 2.3%).
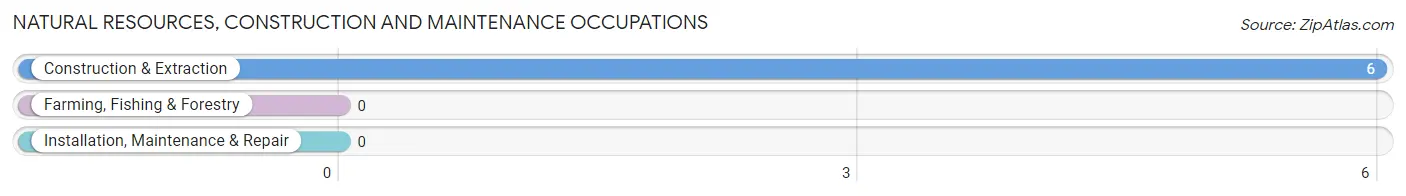
Natural Resources, Construction and Maintenance Occupations by Sex
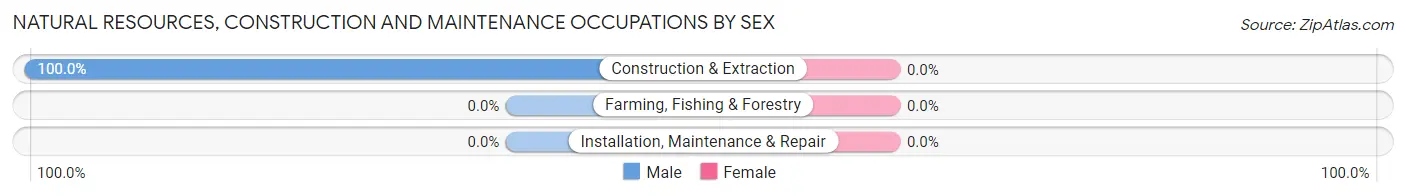
| Occupation | Male | Female |
| Farming, Fishing & Forestry | 0 (0.0%) | 0 (0.0%) |
| Construction & Extraction | 6 (100.0%) | 0 (0.0%) |
| Installation, Maintenance & Repair | 0 (0.0%) | 0 (0.0%) |
| Total (Category) | 6 (100.0%) | 0 (0.0%) |
| Total (Overall) | 207 (78.1%) | 58 (21.9%) |
Production, Transportation and Moving Occupations
The most common Production, Transportation and Moving occupations in Pocono Pines are Material Moving (20 | 7.5%), and Production (7 | 2.6%).
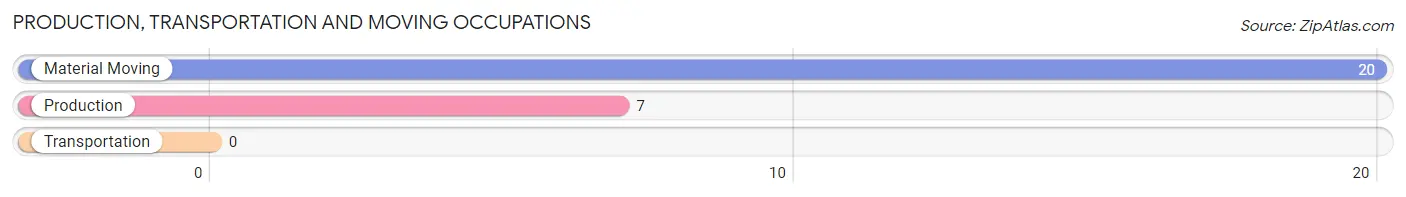
Production, Transportation and Moving Occupations by Sex
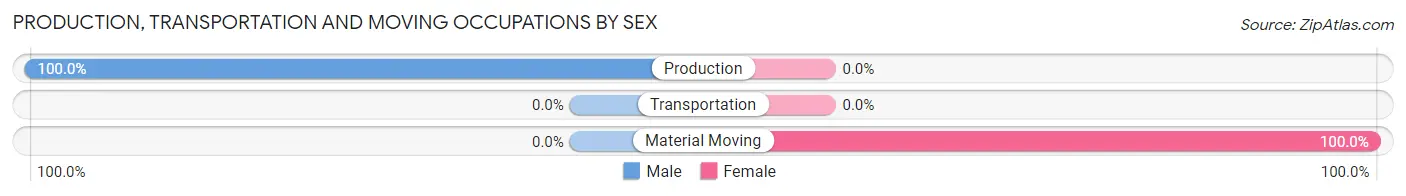
| Occupation | Male | Female |
| Production | 7 (100.0%) | 0 (0.0%) |
| Transportation | 0 (0.0%) | 0 (0.0%) |
| Material Moving | 0 (0.0%) | 20 (100.0%) |
| Total (Category) | 7 (25.9%) | 20 (74.1%) |
| Total (Overall) | 207 (78.1%) | 58 (21.9%) |
Employment Industries by Sex in Pocono Pines
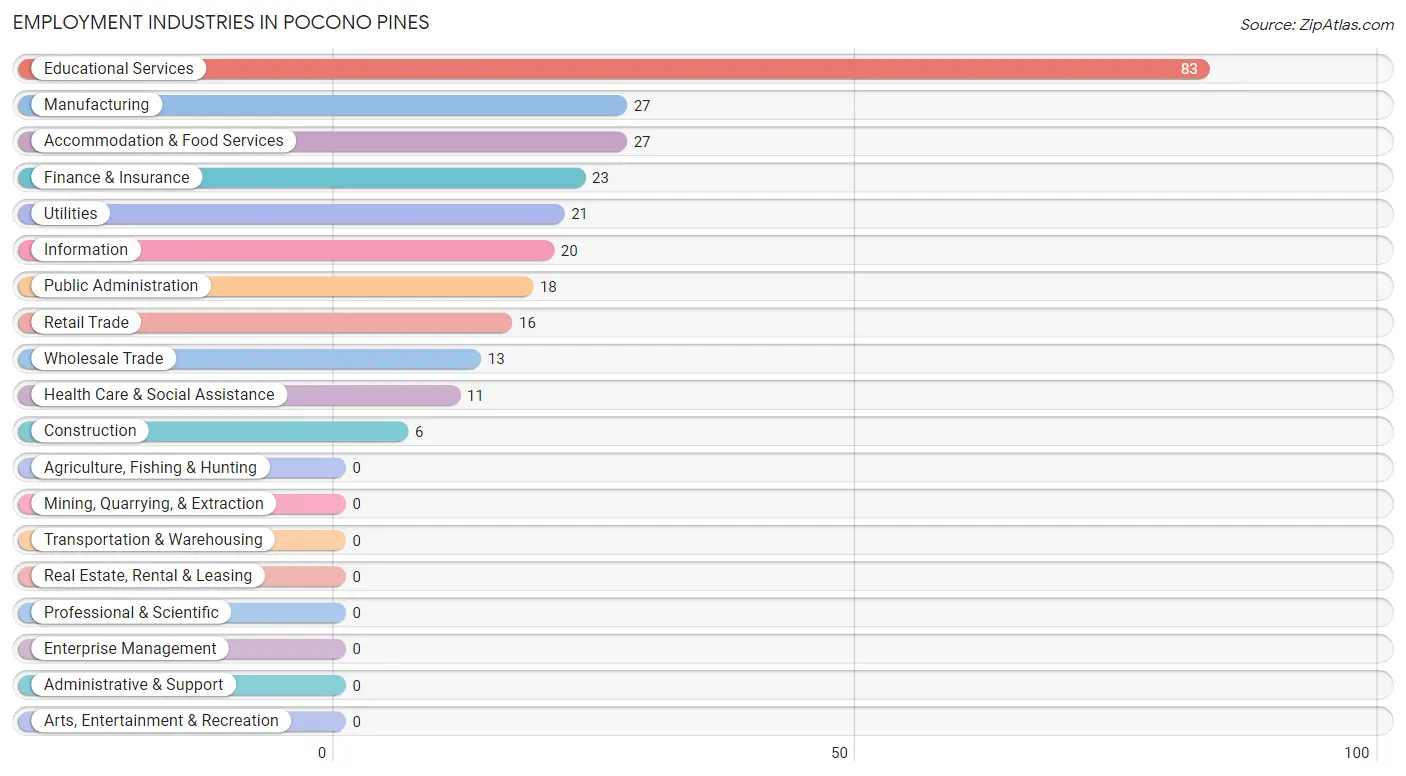
Employment Industries in Pocono Pines
The major employment industries in Pocono Pines include Educational Services (83 | 31.3%), Manufacturing (27 | 10.2%), Accommodation & Food Services (27 | 10.2%), Finance & Insurance (23 | 8.7%), and Utilities (21 | 7.9%).
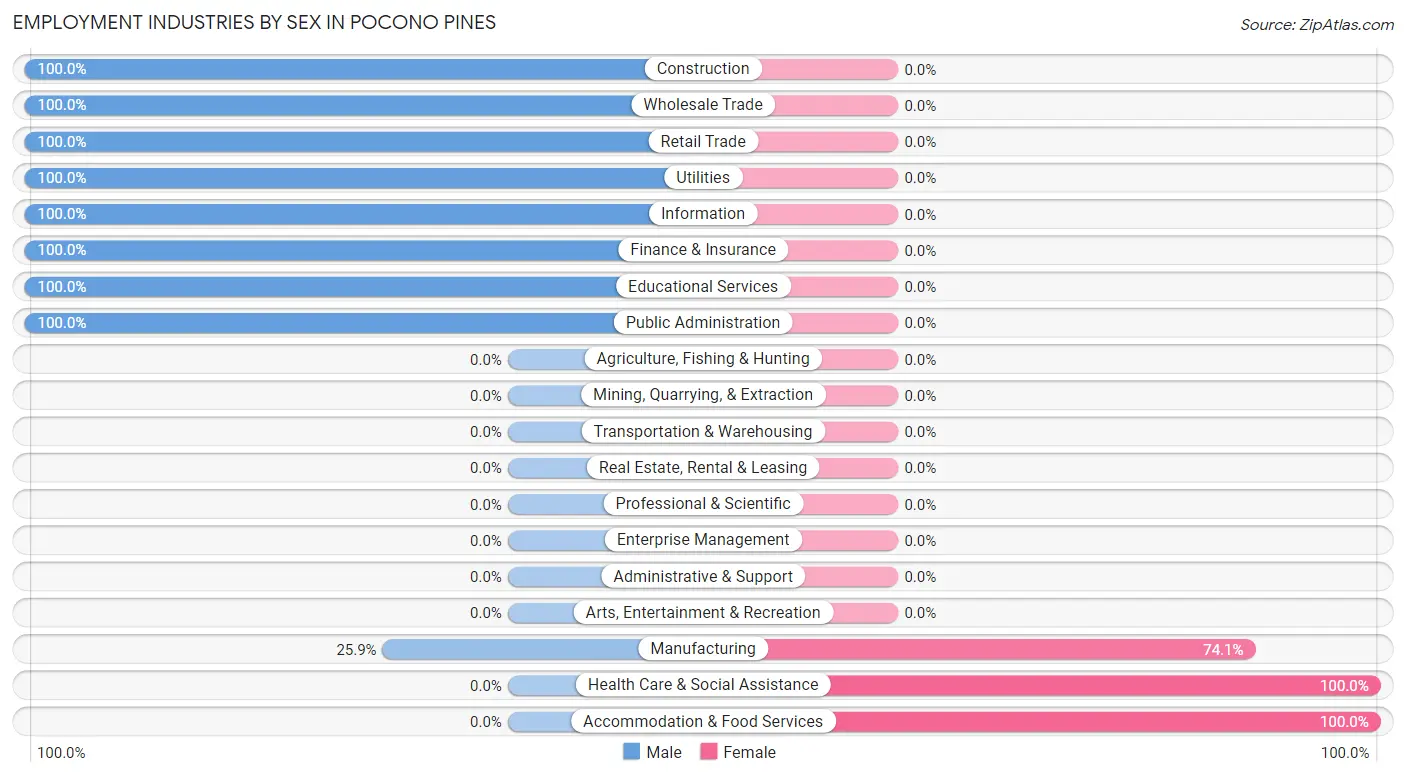
Employment Industries by Sex in Pocono Pines
The Pocono Pines industries that see more men than women are Construction (100.0%), Wholesale Trade (100.0%), and Retail Trade (100.0%), whereas the industries that tend to have a higher number of women are Health Care & Social Assistance (100.0%), Accommodation & Food Services (100.0%), and Manufacturing (74.1%).
| Industry | Male | Female |
| Agriculture, Fishing & Hunting | 0 (0.0%) | 0 (0.0%) |
| Mining, Quarrying, & Extraction | 0 (0.0%) | 0 (0.0%) |
| Construction | 6 (100.0%) | 0 (0.0%) |
| Manufacturing | 7 (25.9%) | 20 (74.1%) |
| Wholesale Trade | 13 (100.0%) | 0 (0.0%) |
| Retail Trade | 16 (100.0%) | 0 (0.0%) |
| Transportation & Warehousing | 0 (0.0%) | 0 (0.0%) |
| Utilities | 21 (100.0%) | 0 (0.0%) |
| Information | 20 (100.0%) | 0 (0.0%) |
| Finance & Insurance | 23 (100.0%) | 0 (0.0%) |
| Real Estate, Rental & Leasing | 0 (0.0%) | 0 (0.0%) |
| Professional & Scientific | 0 (0.0%) | 0 (0.0%) |
| Enterprise Management | 0 (0.0%) | 0 (0.0%) |
| Administrative & Support | 0 (0.0%) | 0 (0.0%) |
| Educational Services | 83 (100.0%) | 0 (0.0%) |
| Health Care & Social Assistance | 0 (0.0%) | 11 (100.0%) |
| Arts, Entertainment & Recreation | 0 (0.0%) | 0 (0.0%) |
| Accommodation & Food Services | 0 (0.0%) | 27 (100.0%) |
| Public Administration | 18 (100.0%) | 0 (0.0%) |
| Total | 207 (78.1%) | 58 (21.9%) |
Education in Pocono Pines
School Enrollment in Pocono Pines
The most common levels of schooling among the 105 students in Pocono Pines are graduate / professional (83 | 79.0%), elementary school (11 | 10.5%), and college / undergraduate (11 | 10.5%).
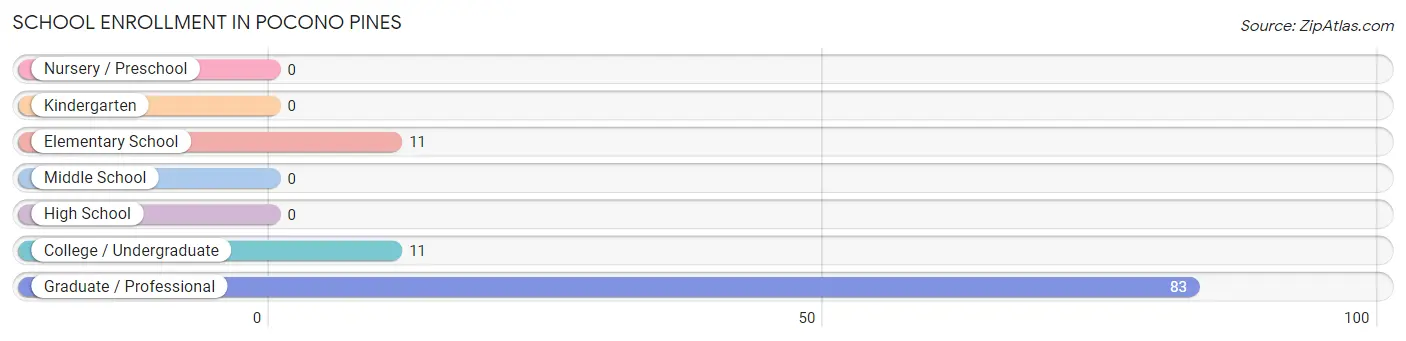
| School Level | # Students | % Students |
| Nursery / Preschool | 0 | 0.0% |
| Kindergarten | 0 | 0.0% |
| Elementary School | 11 | 10.5% |
| Middle School | 0 | 0.0% |
| High School | 0 | 0.0% |
| College / Undergraduate | 11 | 10.5% |
| Graduate / Professional | 83 | 79.0% |
| Total | 105 | 100.0% |
School Enrollment by Age by Funding Source in Pocono Pines
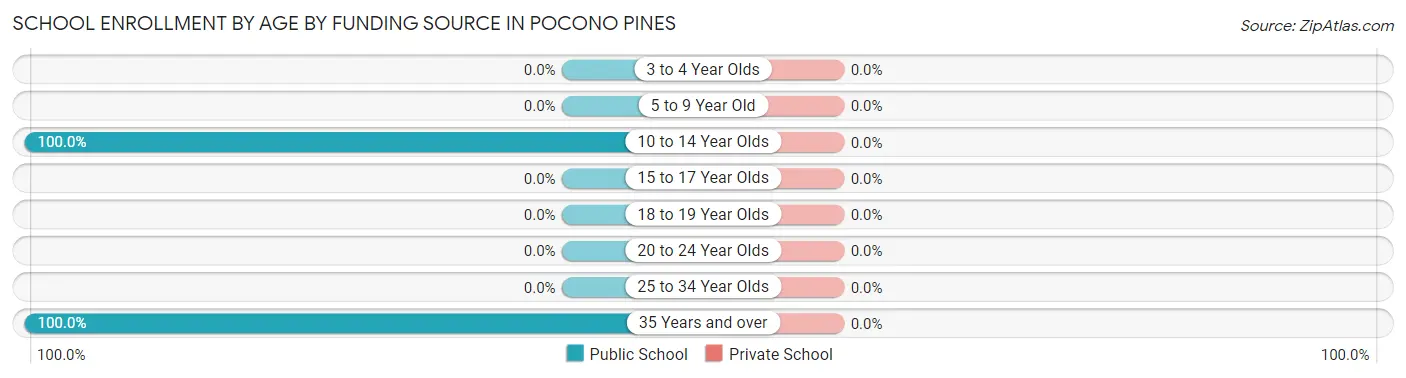
| Age Bracket | Public School | Private School |
| 3 to 4 Year Olds | 0 (0.0%) | 0 (0.0%) |
| 5 to 9 Year Old | 0 (0.0%) | 0 (0.0%) |
| 10 to 14 Year Olds | 11 (100.0%) | 0 (0.0%) |
| 15 to 17 Year Olds | 0 (0.0%) | 0 (0.0%) |
| 18 to 19 Year Olds | 0 (0.0%) | 0 (0.0%) |
| 20 to 24 Year Olds | 0 (0.0%) | 0 (0.0%) |
| 25 to 34 Year Olds | 0 (0.0%) | 0 (0.0%) |
| 35 Years and over | 94 (100.0%) | 0 (0.0%) |
| Total | 105 (100.0%) | 0 (0.0%) |
Educational Attainment by Field of Study in Pocono Pines
Business (100 | 51.3%), science & technology (34 | 17.4%), education (22 | 11.3%), multidisciplinary studies (21 | 10.8%), and bio, nature & agricultural (18 | 9.2%) are the most common fields of study among 195 individuals in Pocono Pines who have obtained a bachelor's degree or higher.
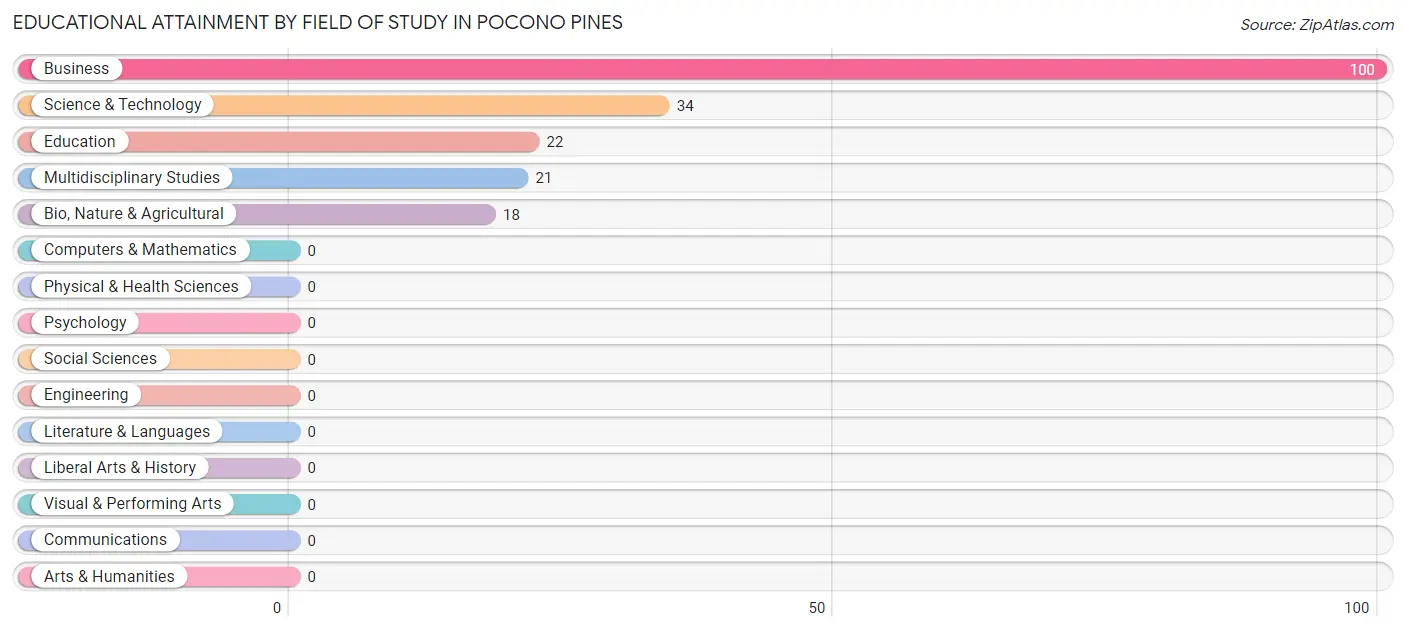
| Field of Study | # Graduates | % Graduates |
| Computers & Mathematics | 0 | 0.0% |
| Bio, Nature & Agricultural | 18 | 9.2% |
| Physical & Health Sciences | 0 | 0.0% |
| Psychology | 0 | 0.0% |
| Social Sciences | 0 | 0.0% |
| Engineering | 0 | 0.0% |
| Multidisciplinary Studies | 21 | 10.8% |
| Science & Technology | 34 | 17.4% |
| Business | 100 | 51.3% |
| Education | 22 | 11.3% |
| Literature & Languages | 0 | 0.0% |
| Liberal Arts & History | 0 | 0.0% |
| Visual & Performing Arts | 0 | 0.0% |
| Communications | 0 | 0.0% |
| Arts & Humanities | 0 | 0.0% |
| Total | 195 | 100.0% |
Transportation & Commute in Pocono Pines
Vehicle Availability by Sex in Pocono Pines
The most prevalent vehicle ownership categories in Pocono Pines are males with 1 vehicle (103, accounting for 51.2%) and females with 1 vehicle (0, making up 177.6%).
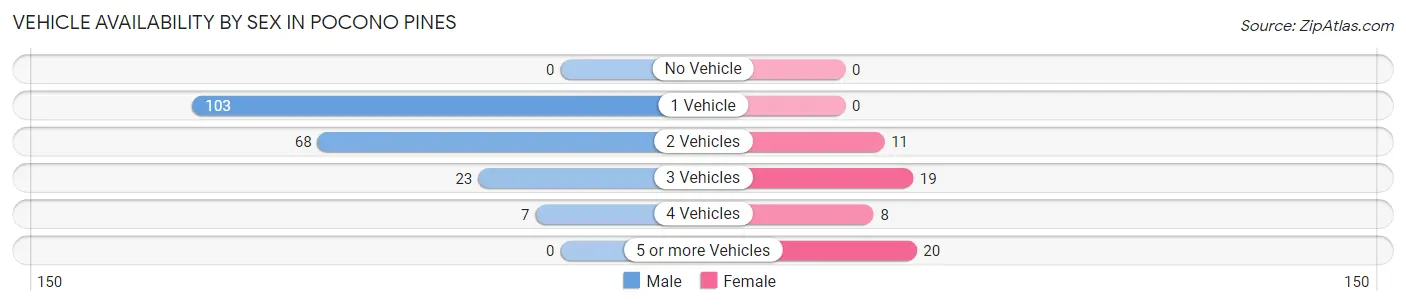
| Vehicles Available | Male | Female |
| No Vehicle | 0 (0.0%) | 0 (0.0%) |
| 1 Vehicle | 103 (51.2%) | 0 (0.0%) |
| 2 Vehicles | 68 (33.8%) | 11 (19.0%) |
| 3 Vehicles | 23 (11.4%) | 19 (32.8%) |
| 4 Vehicles | 7 (3.5%) | 8 (13.8%) |
| 5 or more Vehicles | 0 (0.0%) | 20 (34.5%) |
| Total | 201 (100.0%) | 58 (100.0%) |
Commute Time in Pocono Pines
The most frequently occuring commute durations in Pocono Pines are 10 to 14 minutes (62 commuters, 38.0%), 30 to 34 minutes (39 commuters, 23.9%), and 5 to 9 minutes (28 commuters, 17.2%).
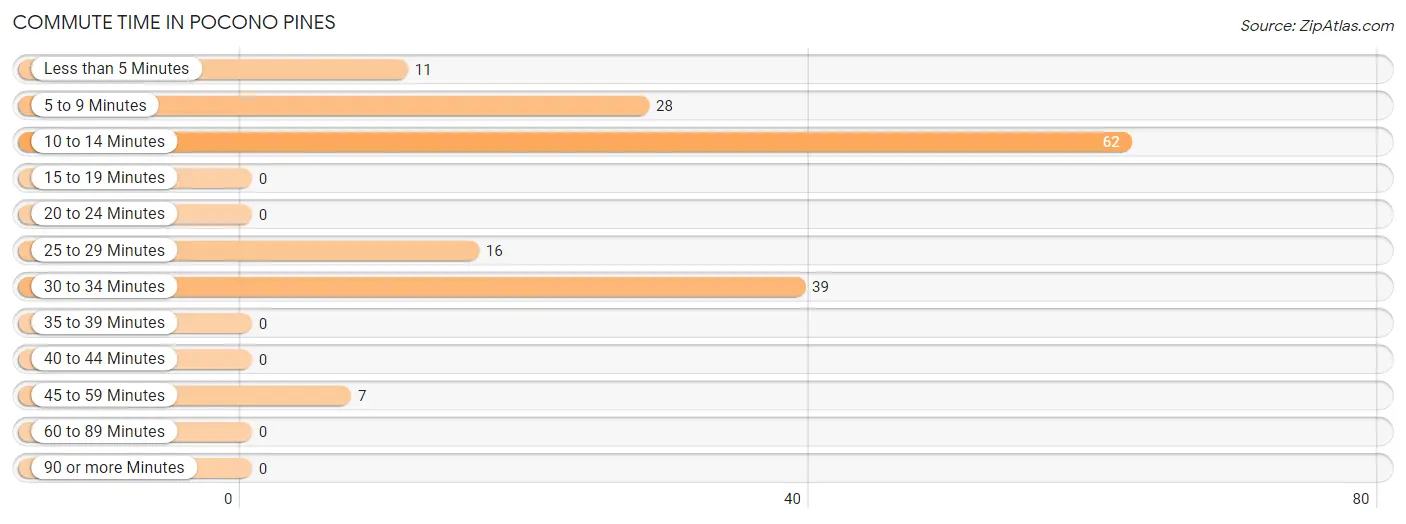
| Commute Time | # Commuters | % Commuters |
| Less than 5 Minutes | 11 | 6.8% |
| 5 to 9 Minutes | 28 | 17.2% |
| 10 to 14 Minutes | 62 | 38.0% |
| 15 to 19 Minutes | 0 | 0.0% |
| 20 to 24 Minutes | 0 | 0.0% |
| 25 to 29 Minutes | 16 | 9.8% |
| 30 to 34 Minutes | 39 | 23.9% |
| 35 to 39 Minutes | 0 | 0.0% |
| 40 to 44 Minutes | 0 | 0.0% |
| 45 to 59 Minutes | 7 | 4.3% |
| 60 to 89 Minutes | 0 | 0.0% |
| 90 or more Minutes | 0 | 0.0% |
Commute Time by Sex in Pocono Pines
The most common commute times in Pocono Pines are 30 to 34 minutes (39 commuters, 37.1%) for males and 10 to 14 minutes (39 commuters, 67.2%) for females.
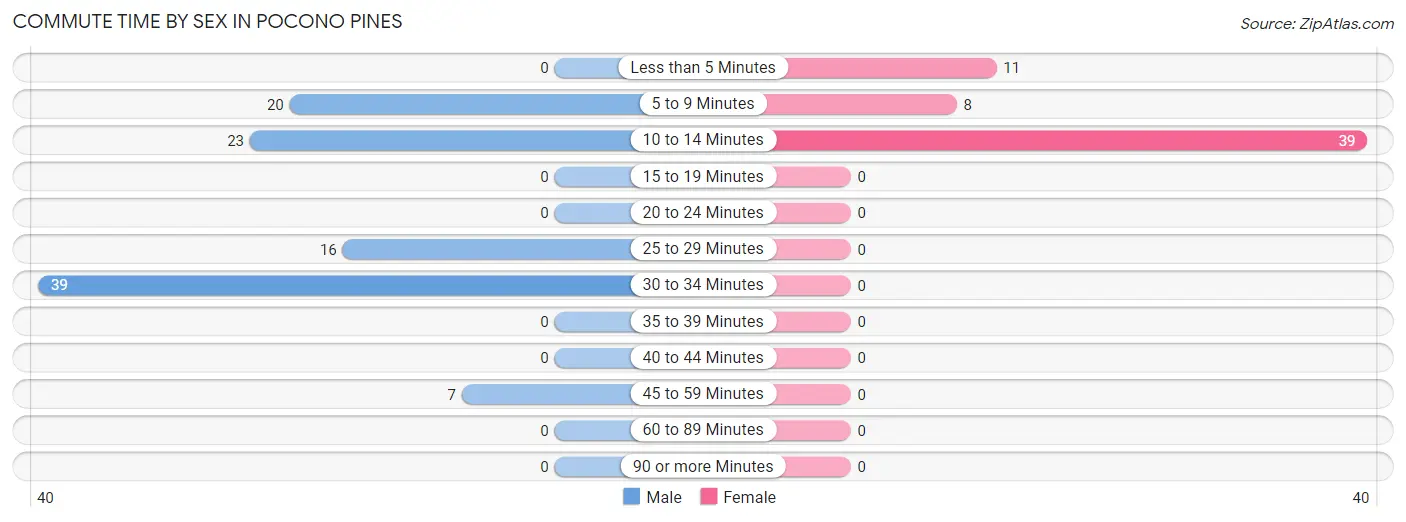
| Commute Time | Male | Female |
| Less than 5 Minutes | 0 (0.0%) | 11 (19.0%) |
| 5 to 9 Minutes | 20 (19.1%) | 8 (13.8%) |
| 10 to 14 Minutes | 23 (21.9%) | 39 (67.2%) |
| 15 to 19 Minutes | 0 (0.0%) | 0 (0.0%) |
| 20 to 24 Minutes | 0 (0.0%) | 0 (0.0%) |
| 25 to 29 Minutes | 16 (15.2%) | 0 (0.0%) |
| 30 to 34 Minutes | 39 (37.1%) | 0 (0.0%) |
| 35 to 39 Minutes | 0 (0.0%) | 0 (0.0%) |
| 40 to 44 Minutes | 0 (0.0%) | 0 (0.0%) |
| 45 to 59 Minutes | 7 (6.7%) | 0 (0.0%) |
| 60 to 89 Minutes | 0 (0.0%) | 0 (0.0%) |
| 90 or more Minutes | 0 (0.0%) | 0 (0.0%) |
Time of Departure to Work by Sex in Pocono Pines
The most frequent times of departure to work in Pocono Pines are 9:00 AM to 9:59 AM (39, 37.1%) for males and 8:00 AM to 8:29 AM (27, 46.6%) for females.
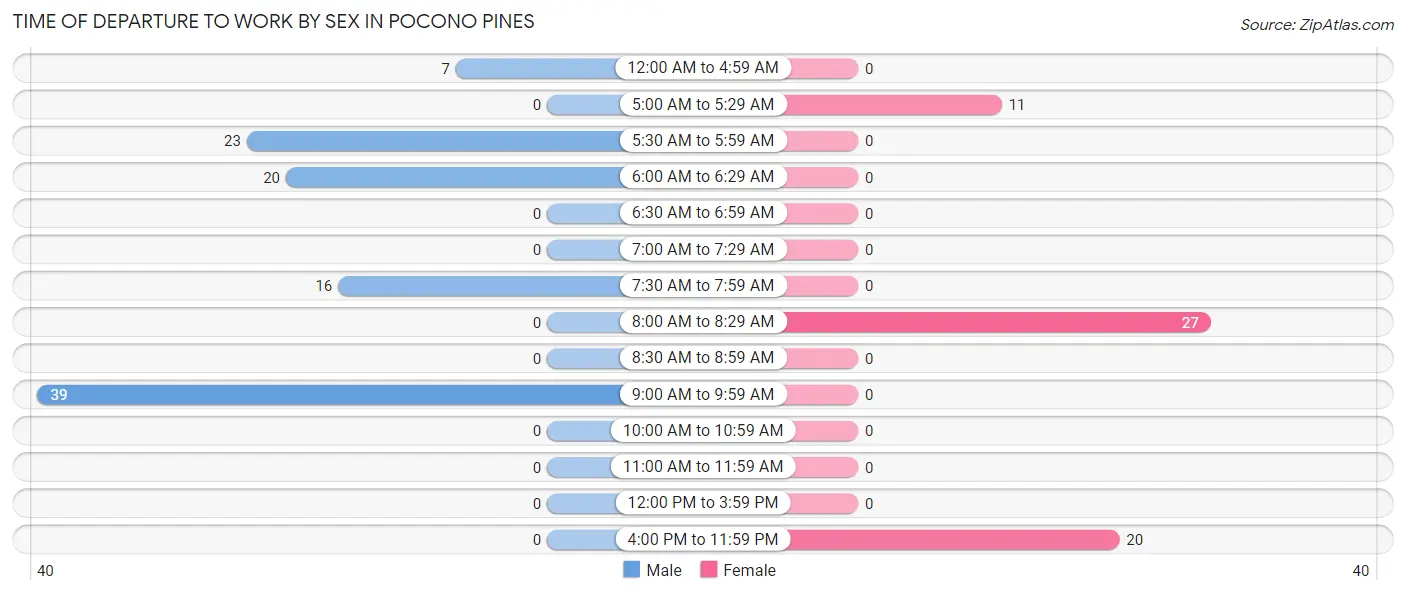
| Time of Departure | Male | Female |
| 12:00 AM to 4:59 AM | 7 (6.7%) | 0 (0.0%) |
| 5:00 AM to 5:29 AM | 0 (0.0%) | 11 (19.0%) |
| 5:30 AM to 5:59 AM | 23 (21.9%) | 0 (0.0%) |
| 6:00 AM to 6:29 AM | 20 (19.1%) | 0 (0.0%) |
| 6:30 AM to 6:59 AM | 0 (0.0%) | 0 (0.0%) |
| 7:00 AM to 7:29 AM | 0 (0.0%) | 0 (0.0%) |
| 7:30 AM to 7:59 AM | 16 (15.2%) | 0 (0.0%) |
| 8:00 AM to 8:29 AM | 0 (0.0%) | 27 (46.6%) |
| 8:30 AM to 8:59 AM | 0 (0.0%) | 0 (0.0%) |
| 9:00 AM to 9:59 AM | 39 (37.1%) | 0 (0.0%) |
| 10:00 AM to 10:59 AM | 0 (0.0%) | 0 (0.0%) |
| 11:00 AM to 11:59 AM | 0 (0.0%) | 0 (0.0%) |
| 12:00 PM to 3:59 PM | 0 (0.0%) | 0 (0.0%) |
| 4:00 PM to 11:59 PM | 0 (0.0%) | 20 (34.5%) |
| Total | 105 (100.0%) | 58 (100.0%) |
Housing Occupancy in Pocono Pines
Occupancy by Ownership in Pocono Pines
Of the total 382 dwellings in Pocono Pines, owner-occupied units account for 382 (100.0%), while renter-occupied units make up 0 (0.0%).
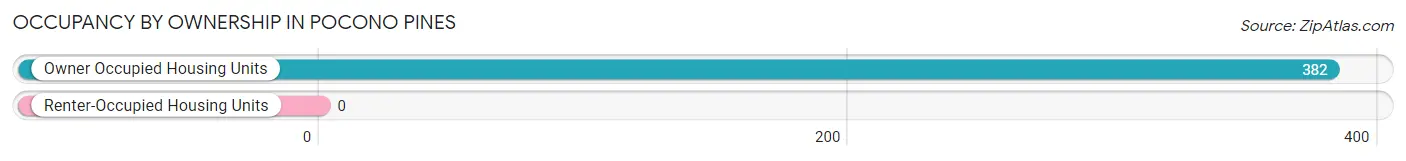
| Occupancy | # Housing Units | % Housing Units |
| Owner Occupied Housing Units | 382 | 100.0% |
| Renter-Occupied Housing Units | 0 | 0.0% |
| Total Occupied Housing Units | 382 | 100.0% |
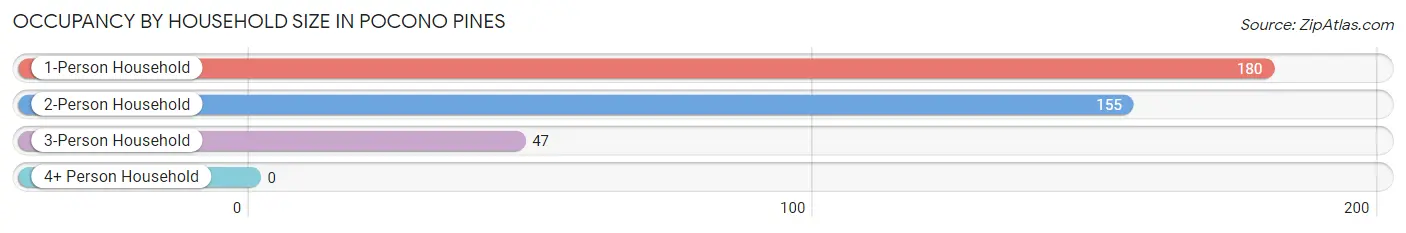
Occupancy by Household Size in Pocono Pines
| Household Size | # Housing Units | % Housing Units |
| 1-Person Household | 180 | 47.1% |
| 2-Person Household | 155 | 40.6% |
| 3-Person Household | 47 | 12.3% |
| 4+ Person Household | 0 | 0.0% |
| Total Housing Units | 382 | 100.0% |
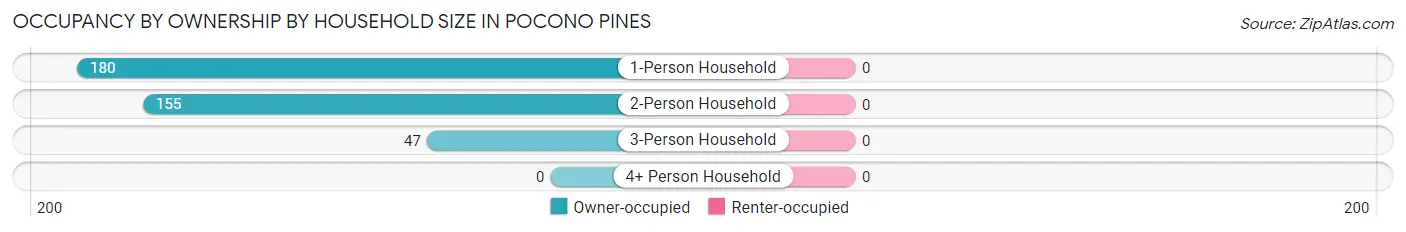
Occupancy by Ownership by Household Size in Pocono Pines
| Household Size | Owner-occupied | Renter-occupied |
| 1-Person Household | 180 (100.0%) | 0 (0.0%) |
| 2-Person Household | 155 (100.0%) | 0 (0.0%) |
| 3-Person Household | 47 (100.0%) | 0 (0.0%) |
| 4+ Person Household | 0 (0.0%) | 0 (0.0%) |
| Total Housing Units | 382 (100.0%) | 0 (0.0%) |
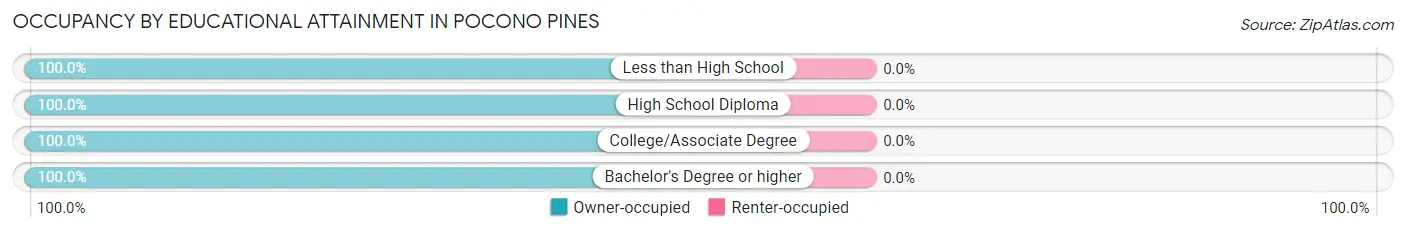
Occupancy by Educational Attainment in Pocono Pines
| Household Size | Owner-occupied | Renter-occupied |
| Less than High School | 79 (100.0%) | 0 (0.0%) |
| High School Diploma | 117 (100.0%) | 0 (0.0%) |
| College/Associate Degree | 27 (100.0%) | 0 (0.0%) |
| Bachelor's Degree or higher | 159 (100.0%) | 0 (0.0%) |
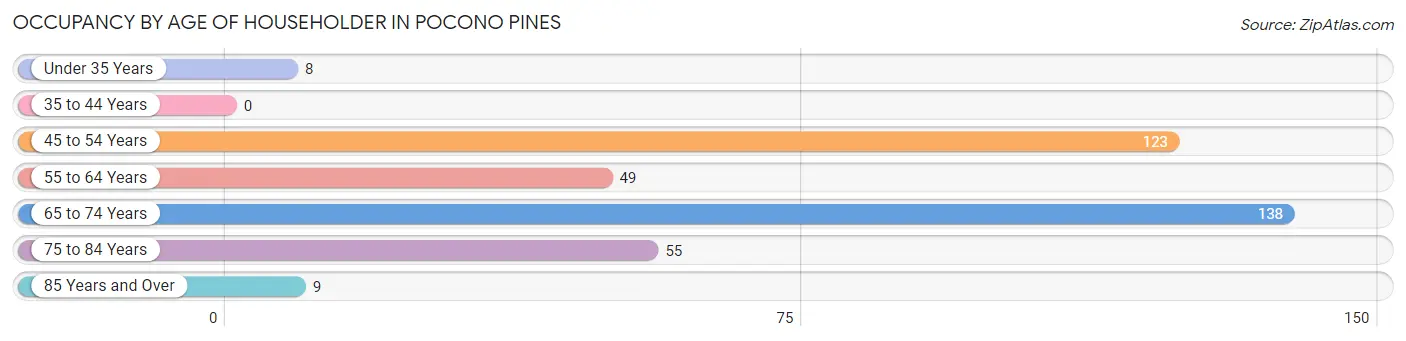
Occupancy by Age of Householder in Pocono Pines
| Age Bracket | # Households | % Households |
| Under 35 Years | 8 | 2.1% |
| 35 to 44 Years | 0 | 0.0% |
| 45 to 54 Years | 123 | 32.2% |
| 55 to 64 Years | 49 | 12.8% |
| 65 to 74 Years | 138 | 36.1% |
| 75 to 84 Years | 55 | 14.4% |
| 85 Years and Over | 9 | 2.4% |
| Total | 382 | 100.0% |
Housing Finances in Pocono Pines
Median Income by Occupancy in Pocono Pines
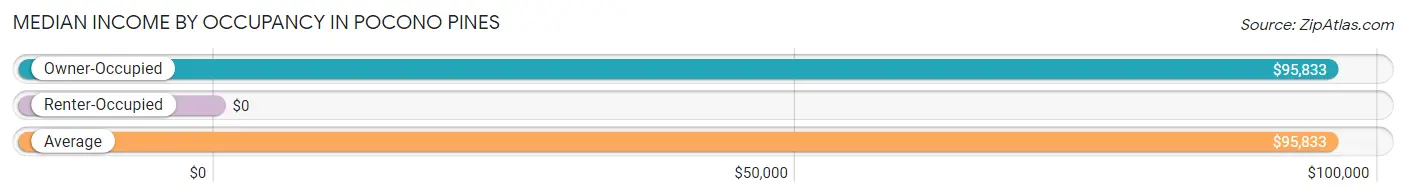
| Occupancy Type | # Households | Median Income |
| Owner-Occupied | 382 (100.0%) | $95,833 |
| Renter-Occupied | 0 (0.0%) | $0 |
| Average | 382 (100.0%) | $95,833 |
Occupancy by Householder Income Bracket in Pocono Pines
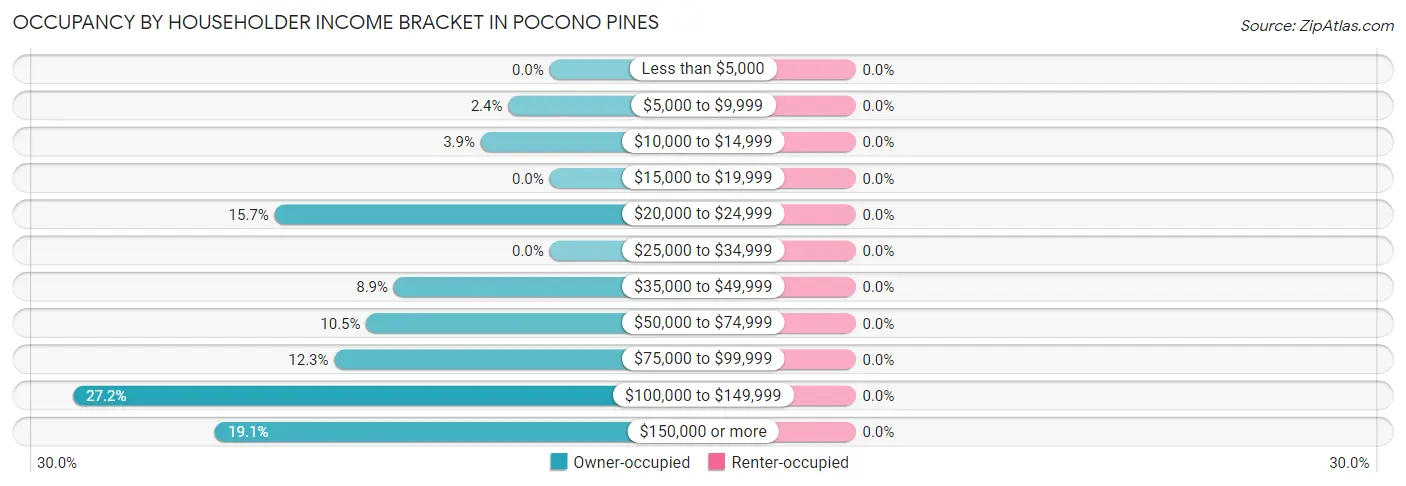
| Income Bracket | Owner-occupied | Renter-occupied |
| Less than $5,000 | 0 (0.0%) | 0 (0.0%) |
| $5,000 to $9,999 | 9 (2.4%) | 0 (0.0%) |
| $10,000 to $14,999 | 15 (3.9%) | 0 (0.0%) |
| $15,000 to $19,999 | 0 (0.0%) | 0 (0.0%) |
| $20,000 to $24,999 | 60 (15.7%) | 0 (0.0%) |
| $25,000 to $34,999 | 0 (0.0%) | 0 (0.0%) |
| $35,000 to $49,999 | 34 (8.9%) | 0 (0.0%) |
| $50,000 to $74,999 | 40 (10.5%) | 0 (0.0%) |
| $75,000 to $99,999 | 47 (12.3%) | 0 (0.0%) |
| $100,000 to $149,999 | 104 (27.2%) | 0 (0.0%) |
| $150,000 or more | 73 (19.1%) | 0 (0.0%) |
| Total | 382 (100.0%) | 0 (0.0%) |
Monthly Housing Cost Tiers in Pocono Pines
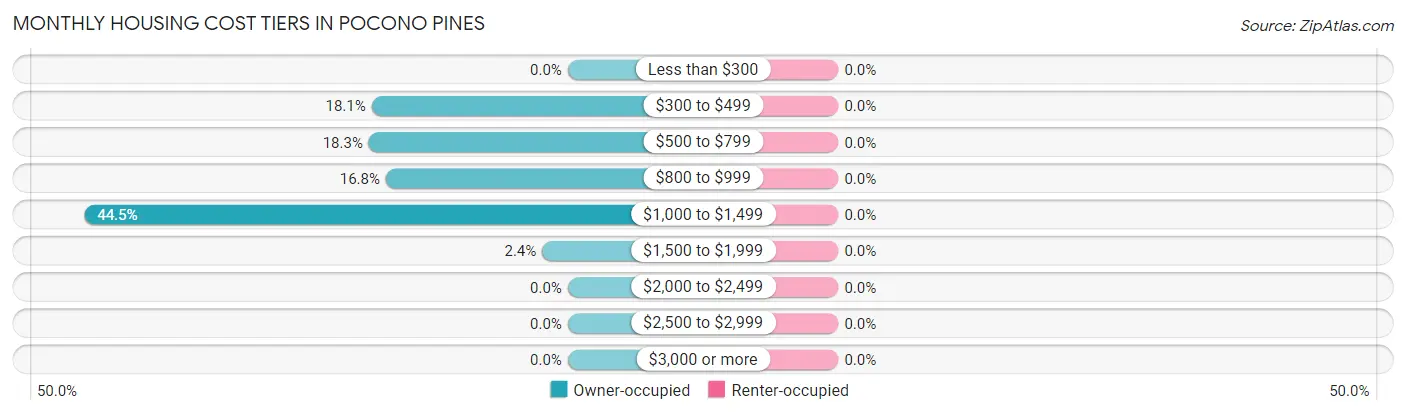
| Monthly Cost | Owner-occupied | Renter-occupied |
| Less than $300 | 0 (0.0%) | 0 (0.0%) |
| $300 to $499 | 69 (18.1%) | 0 (0.0%) |
| $500 to $799 | 70 (18.3%) | 0 (0.0%) |
| $800 to $999 | 64 (16.8%) | 0 (0.0%) |
| $1,000 to $1,499 | 170 (44.5%) | 0 (0.0%) |
| $1,500 to $1,999 | 9 (2.4%) | 0 (0.0%) |
| $2,000 to $2,499 | 0 (0.0%) | 0 (0.0%) |
| $2,500 to $2,999 | 0 (0.0%) | 0 (0.0%) |
| $3,000 or more | 0 (0.0%) | 0 (0.0%) |
| Total | 382 (100.0%) | 0 (0.0%) |
Physical Housing Characteristics in Pocono Pines
Housing Structures in Pocono Pines
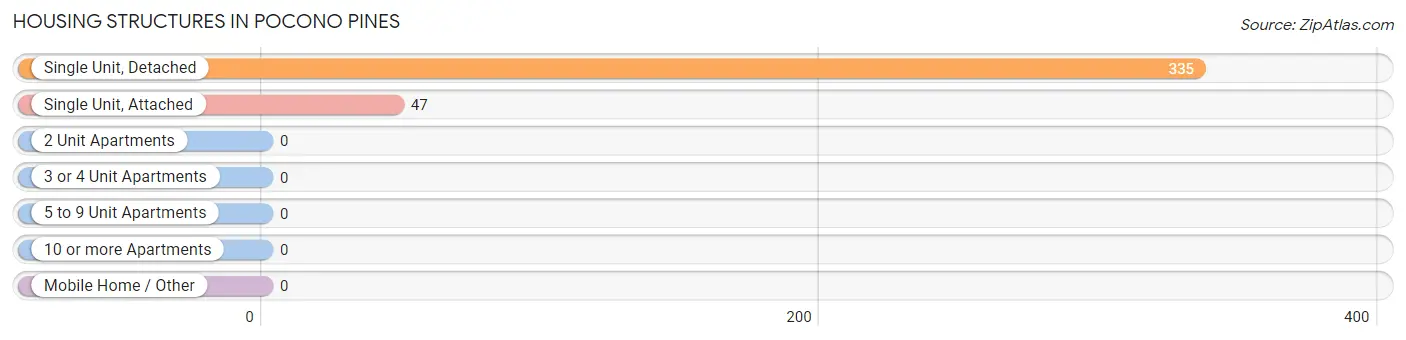
| Structure Type | # Housing Units | % Housing Units |
| Single Unit, Detached | 335 | 87.7% |
| Single Unit, Attached | 47 | 12.3% |
| 2 Unit Apartments | 0 | 0.0% |
| 3 or 4 Unit Apartments | 0 | 0.0% |
| 5 to 9 Unit Apartments | 0 | 0.0% |
| 10 or more Apartments | 0 | 0.0% |
| Mobile Home / Other | 0 | 0.0% |
| Total | 382 | 100.0% |
Housing Structures by Occupancy in Pocono Pines
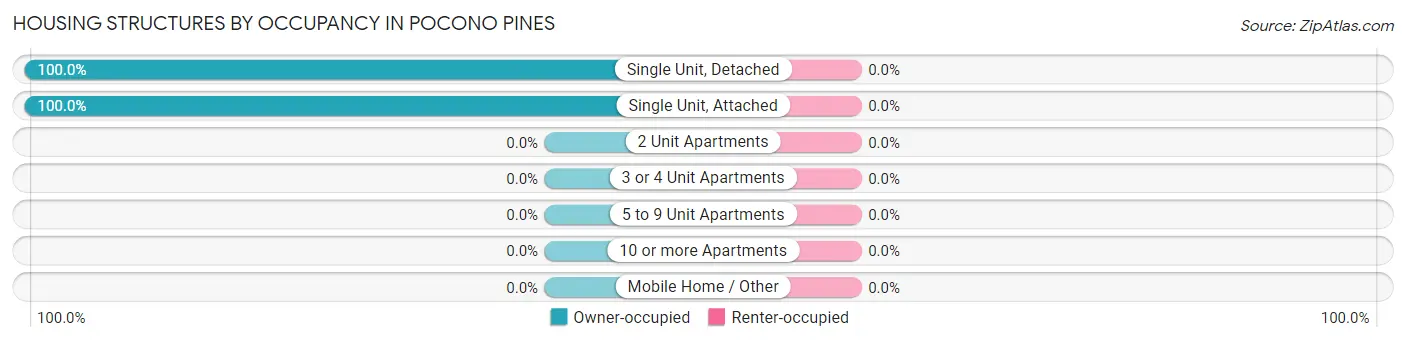
| Structure Type | Owner-occupied | Renter-occupied |
| Single Unit, Detached | 335 (100.0%) | 0 (0.0%) |
| Single Unit, Attached | 47 (100.0%) | 0 (0.0%) |
| 2 Unit Apartments | 0 (0.0%) | 0 (0.0%) |
| 3 or 4 Unit Apartments | 0 (0.0%) | 0 (0.0%) |
| 5 to 9 Unit Apartments | 0 (0.0%) | 0 (0.0%) |
| 10 or more Apartments | 0 (0.0%) | 0 (0.0%) |
| Mobile Home / Other | 0 (0.0%) | 0 (0.0%) |
| Total | 382 (100.0%) | 0 (0.0%) |
Housing Structures by Number of Rooms in Pocono Pines
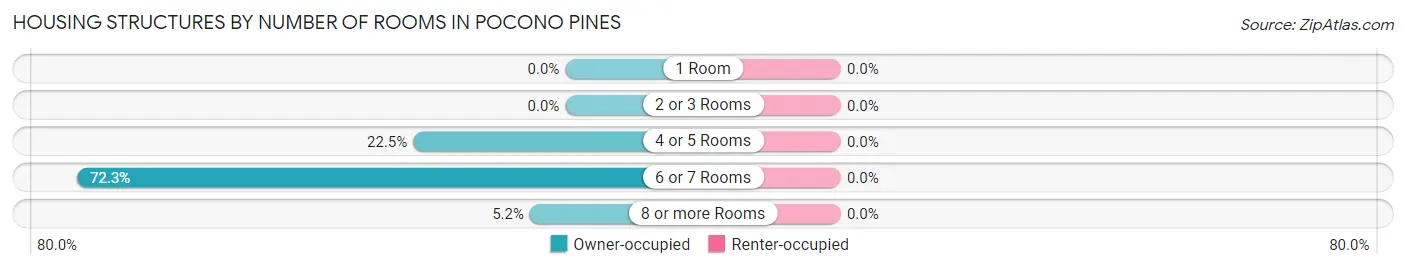
| Number of Rooms | Owner-occupied | Renter-occupied |
| 1 Room | 0 (0.0%) | 0 (0.0%) |
| 2 or 3 Rooms | 0 (0.0%) | 0 (0.0%) |
| 4 or 5 Rooms | 86 (22.5%) | 0 (0.0%) |
| 6 or 7 Rooms | 276 (72.3%) | 0 (0.0%) |
| 8 or more Rooms | 20 (5.2%) | 0 (0.0%) |
| Total | 382 (100.0%) | 0 (0.0%) |
Housing Structure by Heating Type in Pocono Pines
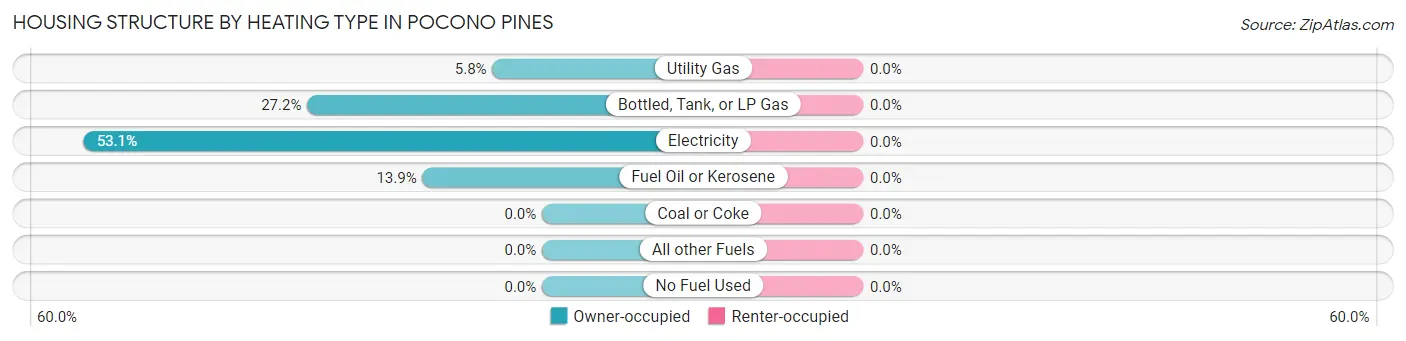
| Heating Type | Owner-occupied | Renter-occupied |
| Utility Gas | 22 (5.8%) | 0 (0.0%) |
| Bottled, Tank, or LP Gas | 104 (27.2%) | 0 (0.0%) |
| Electricity | 203 (53.1%) | 0 (0.0%) |
| Fuel Oil or Kerosene | 53 (13.9%) | 0 (0.0%) |
| Coal or Coke | 0 (0.0%) | 0 (0.0%) |
| All other Fuels | 0 (0.0%) | 0 (0.0%) |
| No Fuel Used | 0 (0.0%) | 0 (0.0%) |
| Total | 382 (100.0%) | 0 (0.0%) |
Household Vehicle Usage in Pocono Pines
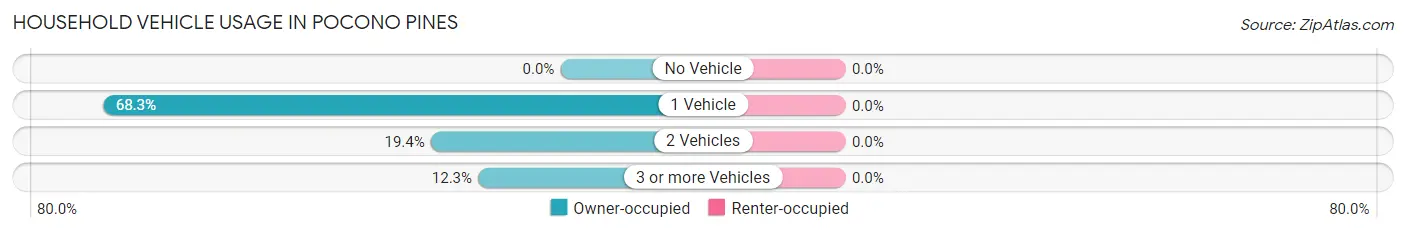
| Vehicles per Household | Owner-occupied | Renter-occupied |
| No Vehicle | 0 (0.0%) | 0 (0.0%) |
| 1 Vehicle | 261 (68.3%) | 0 (0.0%) |
| 2 Vehicles | 74 (19.4%) | 0 (0.0%) |
| 3 or more Vehicles | 47 (12.3%) | 0 (0.0%) |
| Total | 382 (100.0%) | 0 (0.0%) |
Real Estate & Mortgages in Pocono Pines
Real Estate and Mortgage Overview in Pocono Pines
| Characteristic | Without Mortgage | With Mortgage |
| Housing Units | 136 | 246 |
| Median Property Value | $234,600 | $163,200 |
| Median Household Income | $95,833 | $19 |
| Monthly Housing Costs | $992 | $0 |
| Real Estate Taxes | $4,238 | $0 |
Property Value by Mortgage Status in Pocono Pines
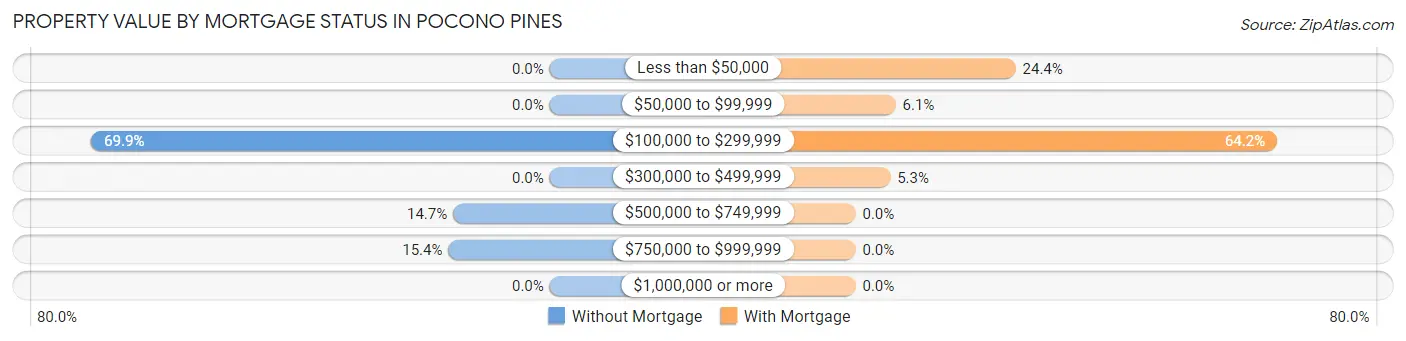
| Property Value | Without Mortgage | With Mortgage |
| Less than $50,000 | 0 (0.0%) | 60 (24.4%) |
| $50,000 to $99,999 | 0 (0.0%) | 15 (6.1%) |
| $100,000 to $299,999 | 95 (69.9%) | 158 (64.2%) |
| $300,000 to $499,999 | 0 (0.0%) | 13 (5.3%) |
| $500,000 to $749,999 | 20 (14.7%) | 0 (0.0%) |
| $750,000 to $999,999 | 21 (15.4%) | 0 (0.0%) |
| $1,000,000 or more | 0 (0.0%) | 0 (0.0%) |
| Total | 136 (100.0%) | 246 (100.0%) |
Household Income by Mortgage Status in Pocono Pines
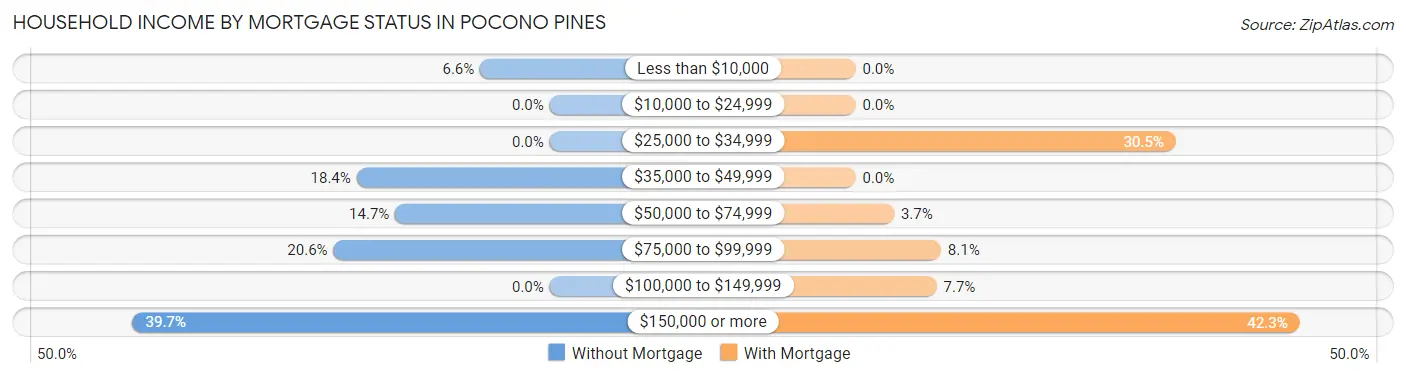
| Household Income | Without Mortgage | With Mortgage |
| Less than $10,000 | 9 (6.6%) | 0 (0.0%) |
| $10,000 to $24,999 | 0 (0.0%) | 0 (0.0%) |
| $25,000 to $34,999 | 0 (0.0%) | 75 (30.5%) |
| $35,000 to $49,999 | 25 (18.4%) | 0 (0.0%) |
| $50,000 to $74,999 | 20 (14.7%) | 9 (3.7%) |
| $75,000 to $99,999 | 28 (20.6%) | 20 (8.1%) |
| $100,000 to $149,999 | 0 (0.0%) | 19 (7.7%) |
| $150,000 or more | 54 (39.7%) | 104 (42.3%) |
| Total | 136 (100.0%) | 246 (100.0%) |
Property Value to Household Income Ratio in Pocono Pines
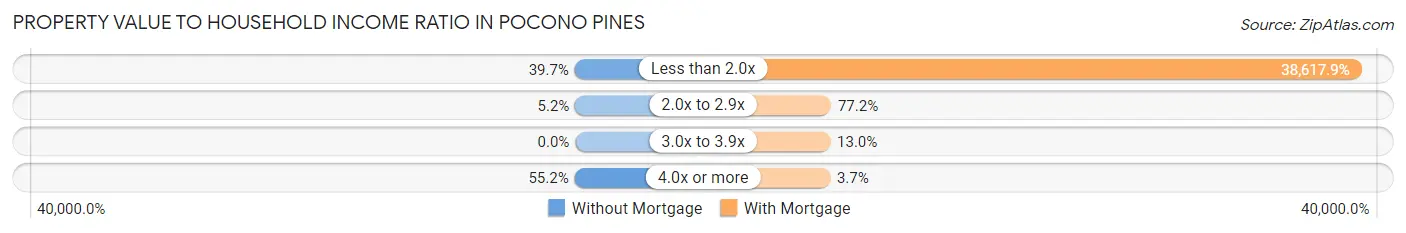
| Value-to-Income Ratio | Without Mortgage | With Mortgage |
| Less than 2.0x | 54 (39.7%) | 95,000 (38,617.9%) |
| 2.0x to 2.9x | 7 (5.1%) | 190 (77.2%) |
| 3.0x to 3.9x | 0 (0.0%) | 32 (13.0%) |
| 4.0x or more | 75 (55.1%) | 9 (3.7%) |
| Total | 136 (100.0%) | 246 (100.0%) |
Real Estate Taxes by Mortgage Status in Pocono Pines
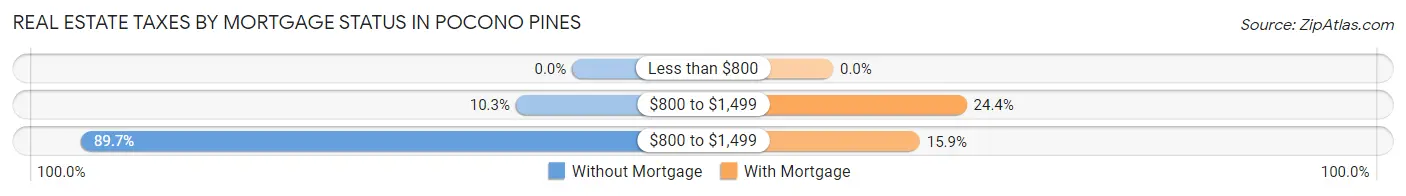
| Property Taxes | Without Mortgage | With Mortgage |
| Less than $800 | 0 (0.0%) | 0 (0.0%) |
| $800 to $1,499 | 14 (10.3%) | 60 (24.4%) |
| $800 to $1,499 | 122 (89.7%) | 39 (15.9%) |
| Total | 136 (100.0%) | 246 (100.0%) |
Health & Disability in Pocono Pines
Health Insurance Coverage by Age in Pocono Pines
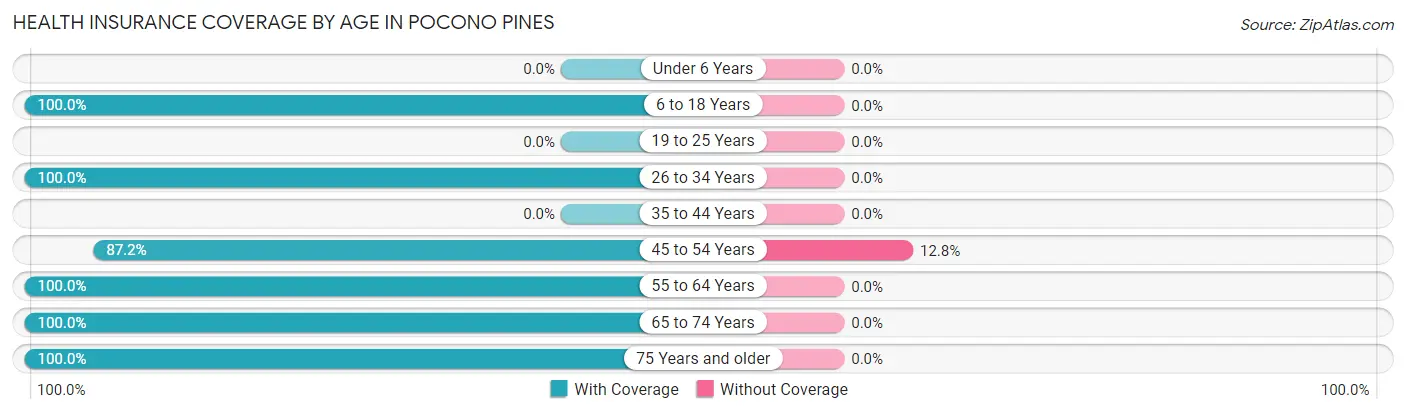
| Age Bracket | With Coverage | Without Coverage |
| Under 6 Years | 0 (0.0%) | 0 (0.0%) |
| 6 to 18 Years | 11 (100.0%) | 0 (0.0%) |
| 19 to 25 Years | 0 (0.0%) | 0 (0.0%) |
| 26 to 34 Years | 63 (100.0%) | 0 (0.0%) |
| 35 to 44 Years | 0 (0.0%) | 0 (0.0%) |
| 45 to 54 Years | 136 (87.2%) | 20 (12.8%) |
| 55 to 64 Years | 86 (100.0%) | 0 (0.0%) |
| 65 to 74 Years | 253 (100.0%) | 0 (0.0%) |
| 75 Years and older | 85 (100.0%) | 0 (0.0%) |
| Total | 634 (96.9%) | 20 (3.1%) |
Health Insurance Coverage by Citizenship Status in Pocono Pines
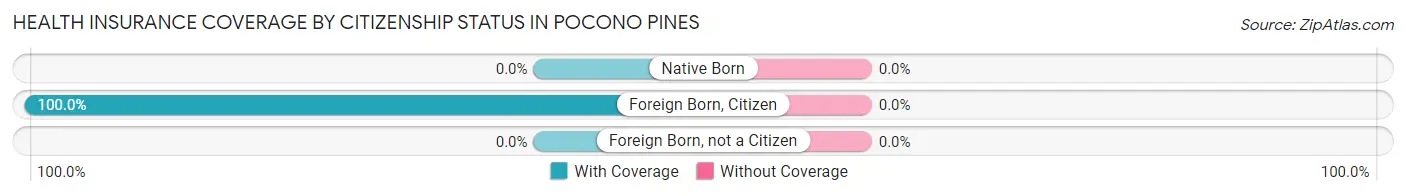
| Citizenship Status | With Coverage | Without Coverage |
| Native Born | 0 (0.0%) | 0 (0.0%) |
| Foreign Born, Citizen | 11 (100.0%) | 0 (0.0%) |
| Foreign Born, not a Citizen | 0 (0.0%) | 0 (0.0%) |
Health Insurance Coverage by Household Income in Pocono Pines
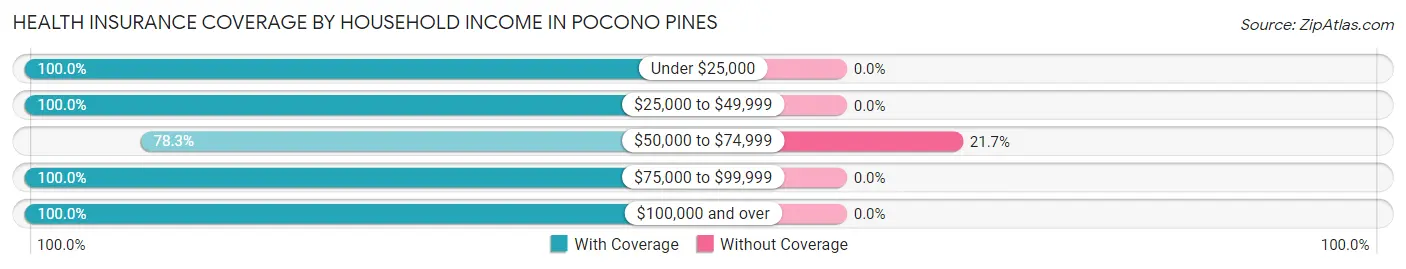
| Household Income | With Coverage | Without Coverage |
| Under $25,000 | 155 (100.0%) | 0 (0.0%) |
| $25,000 to $49,999 | 34 (100.0%) | 0 (0.0%) |
| $50,000 to $74,999 | 72 (78.3%) | 20 (21.7%) |
| $75,000 to $99,999 | 74 (100.0%) | 0 (0.0%) |
| $100,000 and over | 299 (100.0%) | 0 (0.0%) |
Public vs Private Health Insurance Coverage by Age in Pocono Pines
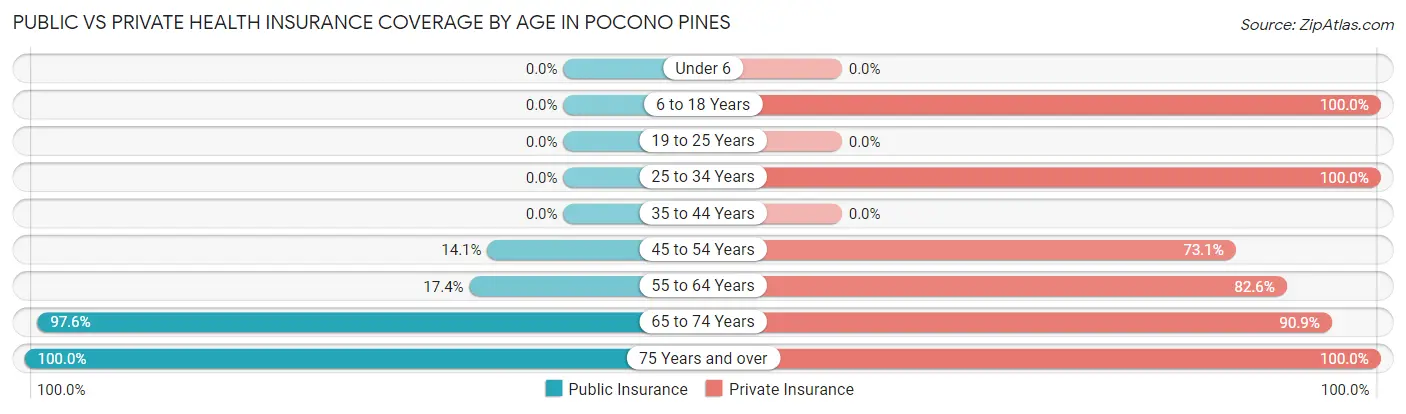
| Age Bracket | Public Insurance | Private Insurance |
| Under 6 | 0 (0.0%) | 0 (0.0%) |
| 6 to 18 Years | 0 (0.0%) | 11 (100.0%) |
| 19 to 25 Years | 0 (0.0%) | 0 (0.0%) |
| 25 to 34 Years | 0 (0.0%) | 63 (100.0%) |
| 35 to 44 Years | 0 (0.0%) | 0 (0.0%) |
| 45 to 54 Years | 22 (14.1%) | 114 (73.1%) |
| 55 to 64 Years | 15 (17.4%) | 71 (82.6%) |
| 65 to 74 Years | 247 (97.6%) | 230 (90.9%) |
| 75 Years and over | 85 (100.0%) | 85 (100.0%) |
| Total | 369 (56.4%) | 574 (87.8%) |
Disability Status by Sex by Age in Pocono Pines
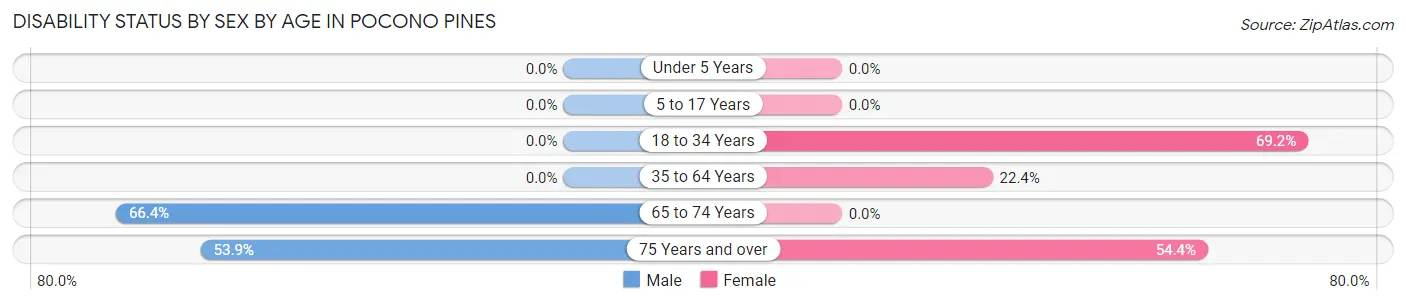
| Age Bracket | Male | Female |
| Under 5 Years | 0 (0.0%) | 0 (0.0%) |
| 5 to 17 Years | 0 (0.0%) | 0 (0.0%) |
| 18 to 34 Years | 0 (0.0%) | 18 (69.2%) |
| 35 to 64 Years | 0 (0.0%) | 15 (22.4%) |
| 65 to 74 Years | 93 (66.4%) | 0 (0.0%) |
| 75 Years and over | 21 (53.8%) | 25 (54.3%) |
Disability Class by Sex by Age in Pocono Pines
Disability Class: Hearing Difficulty
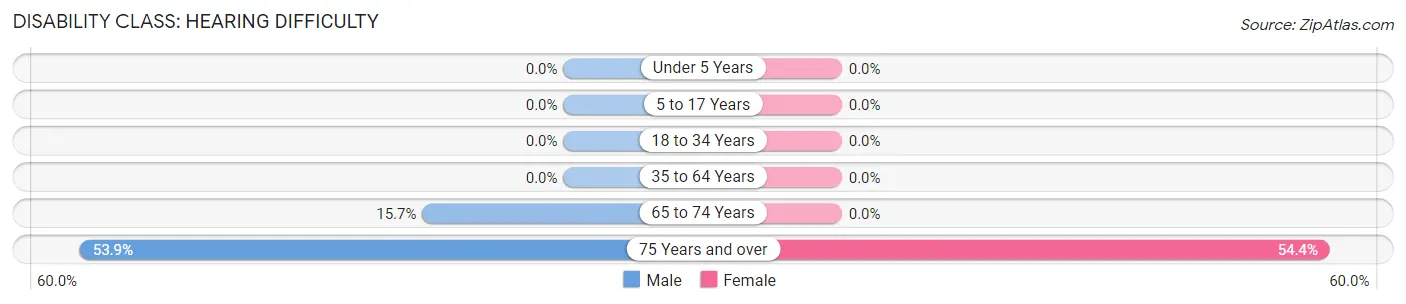
| Age Bracket | Male | Female |
| Under 5 Years | 0 (0.0%) | 0 (0.0%) |
| 5 to 17 Years | 0 (0.0%) | 0 (0.0%) |
| 18 to 34 Years | 0 (0.0%) | 0 (0.0%) |
| 35 to 64 Years | 0 (0.0%) | 0 (0.0%) |
| 65 to 74 Years | 22 (15.7%) | 0 (0.0%) |
| 75 Years and over | 21 (53.8%) | 25 (54.3%) |
Disability Class: Vision Difficulty
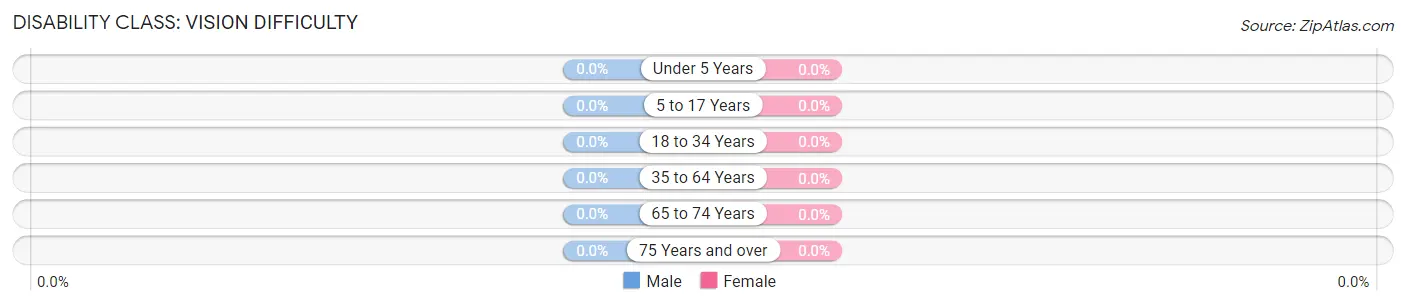
| Age Bracket | Male | Female |
| Under 5 Years | 0 (0.0%) | 0 (0.0%) |
| 5 to 17 Years | 0 (0.0%) | 0 (0.0%) |
| 18 to 34 Years | 0 (0.0%) | 0 (0.0%) |
| 35 to 64 Years | 0 (0.0%) | 0 (0.0%) |
| 65 to 74 Years | 0 (0.0%) | 0 (0.0%) |
| 75 Years and over | 0 (0.0%) | 0 (0.0%) |
Disability Class: Cognitive Difficulty

| Age Bracket | Male | Female |
| 5 to 17 Years | 0 (0.0%) | 0 (0.0%) |
| 18 to 34 Years | 0 (0.0%) | 18 (69.2%) |
| 35 to 64 Years | 0 (0.0%) | 0 (0.0%) |
| 65 to 74 Years | 0 (0.0%) | 0 (0.0%) |
| 75 Years and over | 0 (0.0%) | 0 (0.0%) |
Disability Class: Ambulatory Difficulty
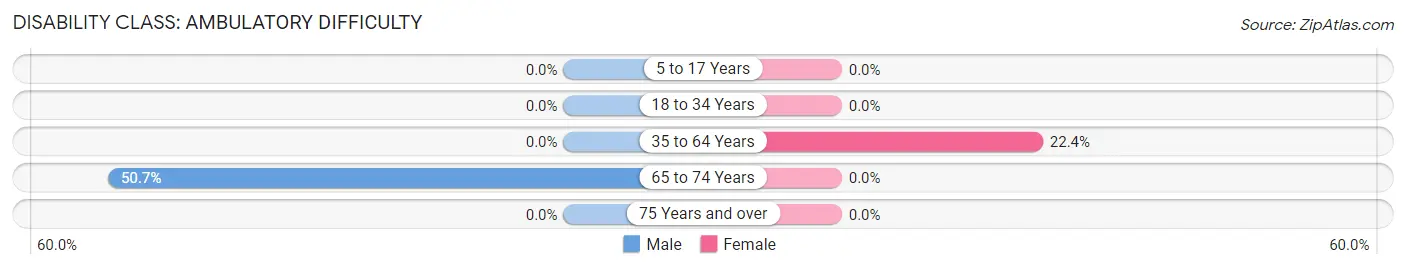
| Age Bracket | Male | Female |
| 5 to 17 Years | 0 (0.0%) | 0 (0.0%) |
| 18 to 34 Years | 0 (0.0%) | 0 (0.0%) |
| 35 to 64 Years | 0 (0.0%) | 15 (22.4%) |
| 65 to 74 Years | 71 (50.7%) | 0 (0.0%) |
| 75 Years and over | 0 (0.0%) | 0 (0.0%) |
Disability Class: Self-Care Difficulty
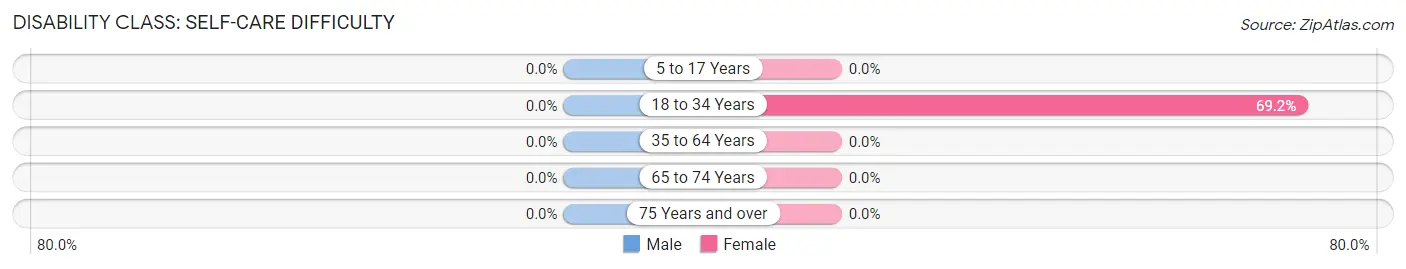
| Age Bracket | Male | Female |
| 5 to 17 Years | 0 (0.0%) | 0 (0.0%) |
| 18 to 34 Years | 0 (0.0%) | 18 (69.2%) |
| 35 to 64 Years | 0 (0.0%) | 0 (0.0%) |
| 65 to 74 Years | 0 (0.0%) | 0 (0.0%) |
| 75 Years and over | 0 (0.0%) | 0 (0.0%) |
Technology Access in Pocono Pines
Computing Device Access in Pocono Pines
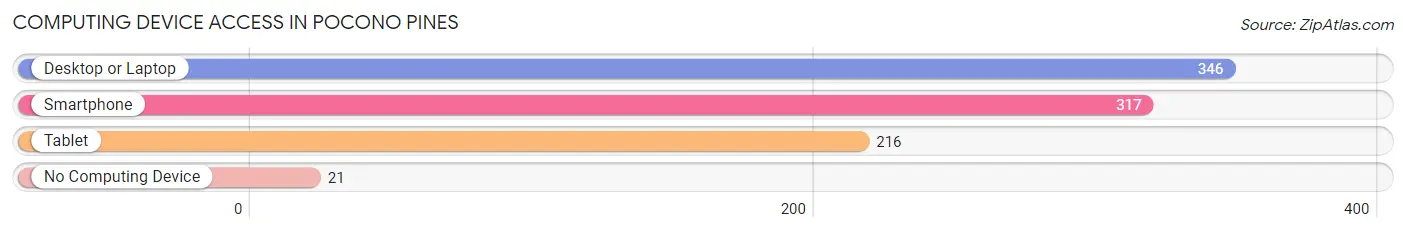
| Device Type | # Households | % Households |
| Desktop or Laptop | 346 | 90.6% |
| Smartphone | 317 | 83.0% |
| Tablet | 216 | 56.5% |
| No Computing Device | 21 | 5.5% |
| Total | 382 | 100.0% |
Internet Access in Pocono Pines
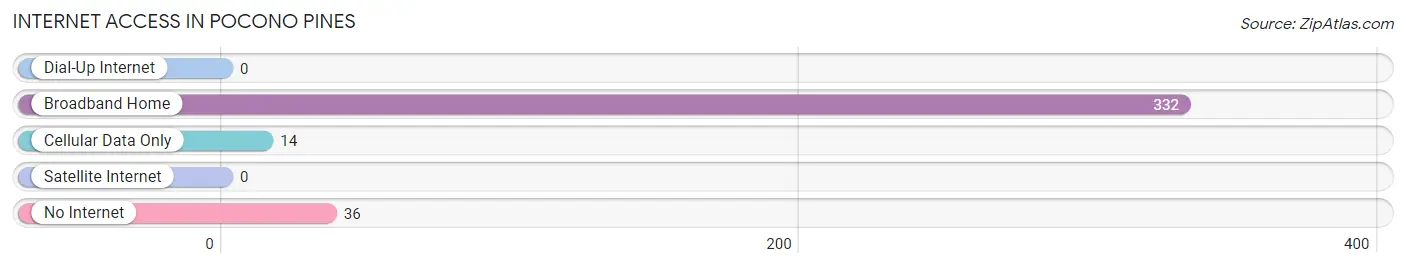
| Internet Type | # Households | % Households |
| Dial-Up Internet | 0 | 0.0% |
| Broadband Home | 332 | 86.9% |
| Cellular Data Only | 14 | 3.7% |
| Satellite Internet | 0 | 0.0% |
| No Internet | 36 | 9.4% |
| Total | 382 | 100.0% |
Pocono Pines Summary
Pocono Pines, Pennsylvania is a small borough located in Monroe County, Pennsylvania. It is situated in the Pocono Mountains region of the state, and is part of the larger Pocono Mountains region. The borough is located approximately 90 miles north of Philadelphia and 90 miles west of New York City. The population of Pocono Pines was 1,845 at the 2010 census.
History
The area that is now Pocono Pines was originally inhabited by the Lenape Native Americans. The first European settlers arrived in the area in the late 1700s, and the area was officially established as a borough in 1891. The area was originally known as “Pocono”, and the name was changed to “Pocono Pines” in 1895.
The area was originally a popular vacation destination for wealthy families from Philadelphia and New York City. The area was known for its resorts, golf courses, and ski resorts. The area was also known for its natural beauty, and was a popular destination for outdoor activities such as hiking, camping, and fishing.
In the early 1900s, the area began to develop into a residential community. The area was known for its large estates and luxurious homes. The area was also known for its many summer camps, which attracted visitors from all over the country.
Geography
Pocono Pines is located in the Pocono Mountains region of Pennsylvania. The borough is located in the northern part of Monroe County, and is bordered by Coolbaugh Township to the north, Tobyhanna Township to the east, Tunkhannock Township to the south, and Barrett Township to the west. The borough is located approximately 90 miles north of Philadelphia and 90 miles west of New York City.
The borough is located in the Pocono Mountains region of Pennsylvania, and is surrounded by forests and mountains. The area is known for its natural beauty, and is a popular destination for outdoor activities such as hiking, camping, and fishing. The area is also known for its many ski resorts, golf courses, and other recreational activities.
Economy
The economy of Pocono Pines is largely based on tourism. The area is known for its resorts, golf courses, and ski resorts. The area is also known for its natural beauty, and is a popular destination for outdoor activities such as hiking, camping, and fishing.
The area is also home to several businesses, including restaurants, retail stores, and other services. The area is also home to several manufacturing companies, including a paper mill and a plastics factory.
Demographics
As of the 2010 census, the population of Pocono Pines was 1,845. The racial makeup of the borough was 94.3% White, 2.2% African American, 0.2% Native American, 0.7% Asian, 0.1% Pacific Islander, 0.7% from other races, and 1.9% from two or more races. Hispanic or Latino of any race were 2.2% of the population.
The median income for a household in the borough was $50,938, and the median income for a family was $60,000. The per capita income for the borough was $25,938. About 5.2% of families and 7.2% of the population were below the poverty line, including 8.3% of those under age 18 and 4.2% of those age 65 or over.
Common Questions
What is Per Capita Income in Pocono Pines?
Per Capita income in Pocono Pines is $53,307.
What is the Median Family Income in Pocono Pines?
Median Family Income in Pocono Pines is $95,060.
What is the Median Household income in Pocono Pines?
Median Household Income in Pocono Pines is $95,833.
What is Inequality or Gini Index in Pocono Pines?
Inequality or Gini Index in Pocono Pines is 0.34.
What is the Total Population of Pocono Pines?
Total Population of Pocono Pines is 654.
What is the Total Male Population of Pocono Pines?
Total Male Population of Pocono Pines is 391.
What is the Total Female Population of Pocono Pines?
Total Female Population of Pocono Pines is 263.
What is the Ratio of Males per 100 Females in Pocono Pines?
There are 148.67 Males per 100 Females in Pocono Pines.
What is the Ratio of Females per 100 Males in Pocono Pines?
There are 67.26 Females per 100 Males in Pocono Pines.
What is the Median Population Age in Pocono Pines?
Median Population Age in Pocono Pines is 65.4 Years.
What is the Average Family Size in Pocono Pines
Average Family Size in Pocono Pines is 2.4 People.
What is the Average Household Size in Pocono Pines
Average Household Size in Pocono Pines is 1.7 People.
How Large is the Labor Force in Pocono Pines?
There are 287 People in the Labor Forcein in Pocono Pines.
What is the Percentage of People in the Labor Force in Pocono Pines?
44.6% of People are in the Labor Force in Pocono Pines.
What is the Unemployment Rate in Pocono Pines?
Unemployment Rate in Pocono Pines is 7.7%.