Cashtown, PA Map & Demographics
Cashtown Map
Cashtown Overview
$32,731
PER CAPITA INCOME
20.6%
WAGE / INCOME GAP [ % ]
79.4¢/ $1
WAGE / INCOME GAP [ $ ]
0.40
INEQUALITY / GINI INDEX
283
TOTAL POPULATION
170
MALE POPULATION
113
FEMALE POPULATION
150.44
MALES / 100 FEMALES
66.47
FEMALES / 100 MALES
50.1
MEDIAN AGE
2.9
AVG FAMILY SIZE
2.9
AVG HOUSEHOLD SIZE
127
LABOR FORCE [ PEOPLE ]
44.9%
PERCENT IN LABOR FORCE
Cashtown Area Codes
Income in Cashtown
Income Overview in Cashtown
| Characteristic | Number | Measure |
| Per Capita Income | 283 | $32,731 |
| Median Family Income | 82 | $0 |
| Mean Family Income | 82 | $61,771 |
| Median Household Income | 82 | $0 |
| Mean Household Income | 82 | $61,771 |
| Income Deficit | 82 | $0 |
| Wage / Income Gap (%) | 283 | 20.56% |
| Wage / Income Gap ($) | 283 | 79.44¢ per $1 |
| Gini / Inequality Index | 283 | 0.40 |
Earnings by Sex in Cashtown
Average Earnings in Cashtown are $72,871, $73,379 for men and $58,289 for women, a difference of 20.6%.
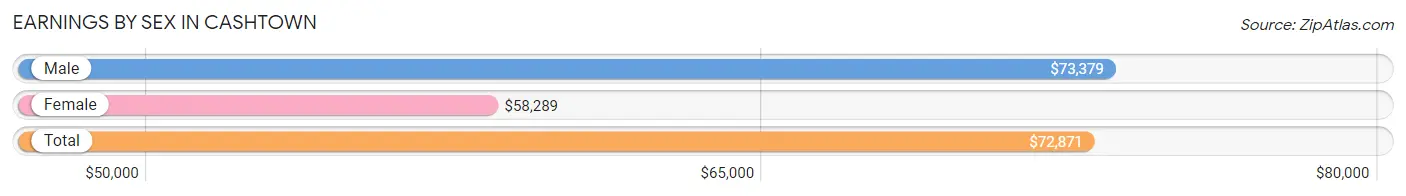
| Sex | Number | Average Earnings |
| Male | 83 (65.3%) | $73,379 |
| Female | 44 (34.6%) | $58,289 |
| Total | 127 (100.0%) | $72,871 |
Earnings by Sex by Income Bracket in Cashtown
The most common earnings brackets in Cashtown are $65,000 to $74,999 for men (64 | 77.1%) and $55,000 to $64,999 for women (19 | 43.2%).
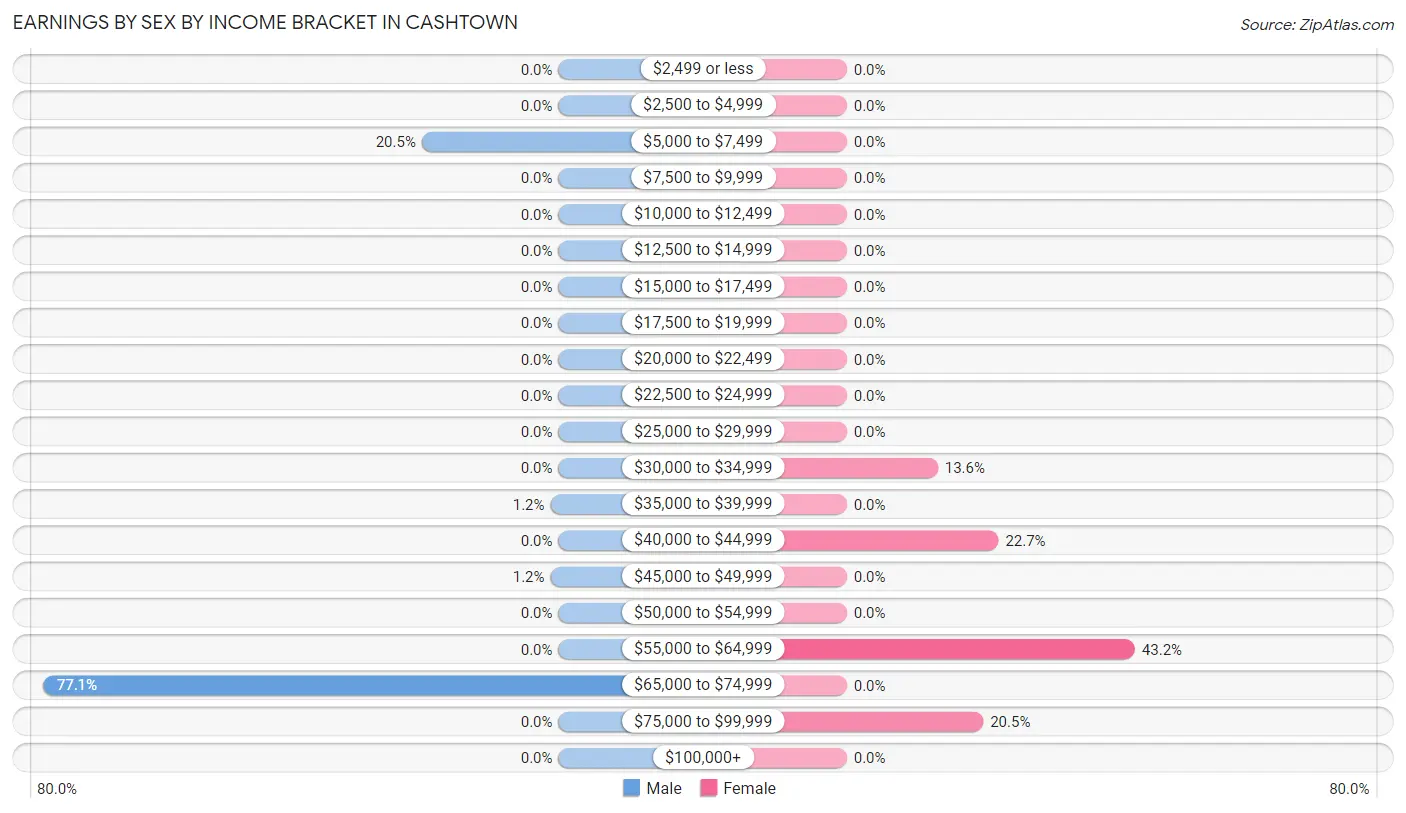
| Income | Male | Female |
| $2,499 or less | 0 (0.0%) | 0 (0.0%) |
| $2,500 to $4,999 | 0 (0.0%) | 0 (0.0%) |
| $5,000 to $7,499 | 17 (20.5%) | 0 (0.0%) |
| $7,500 to $9,999 | 0 (0.0%) | 0 (0.0%) |
| $10,000 to $12,499 | 0 (0.0%) | 0 (0.0%) |
| $12,500 to $14,999 | 0 (0.0%) | 0 (0.0%) |
| $15,000 to $17,499 | 0 (0.0%) | 0 (0.0%) |
| $17,500 to $19,999 | 0 (0.0%) | 0 (0.0%) |
| $20,000 to $22,499 | 0 (0.0%) | 0 (0.0%) |
| $22,500 to $24,999 | 0 (0.0%) | 0 (0.0%) |
| $25,000 to $29,999 | 0 (0.0%) | 0 (0.0%) |
| $30,000 to $34,999 | 0 (0.0%) | 6 (13.6%) |
| $35,000 to $39,999 | 1 (1.2%) | 0 (0.0%) |
| $40,000 to $44,999 | 0 (0.0%) | 10 (22.7%) |
| $45,000 to $49,999 | 1 (1.2%) | 0 (0.0%) |
| $50,000 to $54,999 | 0 (0.0%) | 0 (0.0%) |
| $55,000 to $64,999 | 0 (0.0%) | 19 (43.2%) |
| $65,000 to $74,999 | 64 (77.1%) | 0 (0.0%) |
| $75,000 to $99,999 | 0 (0.0%) | 9 (20.4%) |
| $100,000+ | 0 (0.0%) | 0 (0.0%) |
| Total | 83 (100.0%) | 44 (100.0%) |
Earnings by Sex by Educational Attainment in Cashtown
| Educational Attainment | Male Income | Female Income |
| Less than High School | - | - |
| High School Diploma | - | - |
| College or Associate's Degree | - | - |
| Bachelor's Degree | - | - |
| Graduate Degree | - | - |
| Total | $73,379 | $58,684 |
Family Income in Cashtown
Family Income Brackets in Cashtown
According to the Cashtown family income data, there are 21 families falling into the $15,000 to $24,999 income range, which is the most common income bracket and makes up 25.6% of all families.
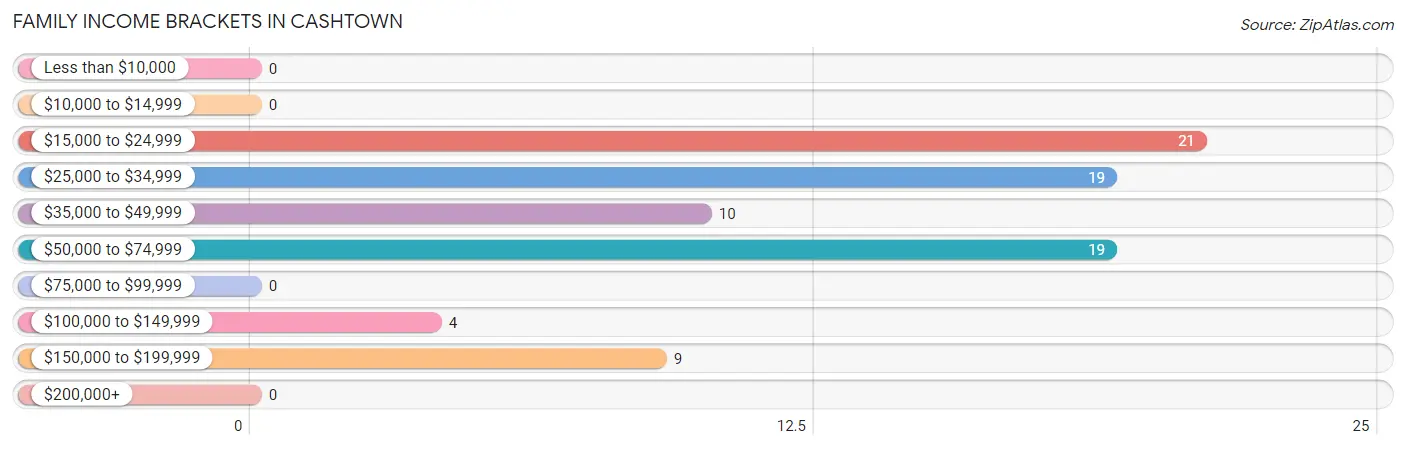
| Income Bracket | # Families | % Families |
| Less than $10,000 | 0 | 0.0% |
| $10,000 to $14,999 | 0 | 0.0% |
| $15,000 to $24,999 | 21 | 25.6% |
| $25,000 to $34,999 | 19 | 23.2% |
| $35,000 to $49,999 | 10 | 12.2% |
| $50,000 to $74,999 | 19 | 23.2% |
| $75,000 to $99,999 | 0 | 0.0% |
| $100,000 to $149,999 | 4 | 4.9% |
| $150,000 to $199,999 | 9 | 11.0% |
| $200,000+ | 0 | 0.0% |
Family Income by Famaliy Size in Cashtown
| Income Bracket | # Families | Median Income |
| 2-Person Families | 73 (89.0%) | $0 |
| 3-Person Families | 9 (11.0%) | $0 |
| 4-Person Families | 0 (0.0%) | $0 |
| 5-Person Families | 0 (0.0%) | $0 |
| 6-Person Families | 0 (0.0%) | $0 |
| 7+ Person Families | 0 (0.0%) | $0 |
| Total | 82 (100.0%) | $0 |
Family Income by Number of Earners in Cashtown
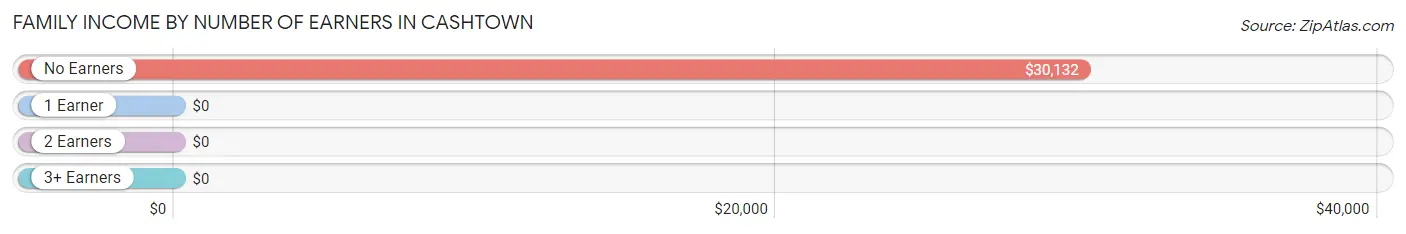
| Number of Earners | # Families | Median Income |
| No Earners | 44 (53.7%) | $30,132 |
| 1 Earner | 10 (12.2%) | $0 |
| 2 Earners | 19 (23.2%) | $0 |
| 3+ Earners | 9 (11.0%) | $0 |
| Total | 82 (100.0%) | $0 |
Household Income in Cashtown
Household Income Brackets in Cashtown
With 21 households falling in the category, the $15,000 to $24,999 income range is the most frequent in Cashtown, accounting for 25.6% of all households.
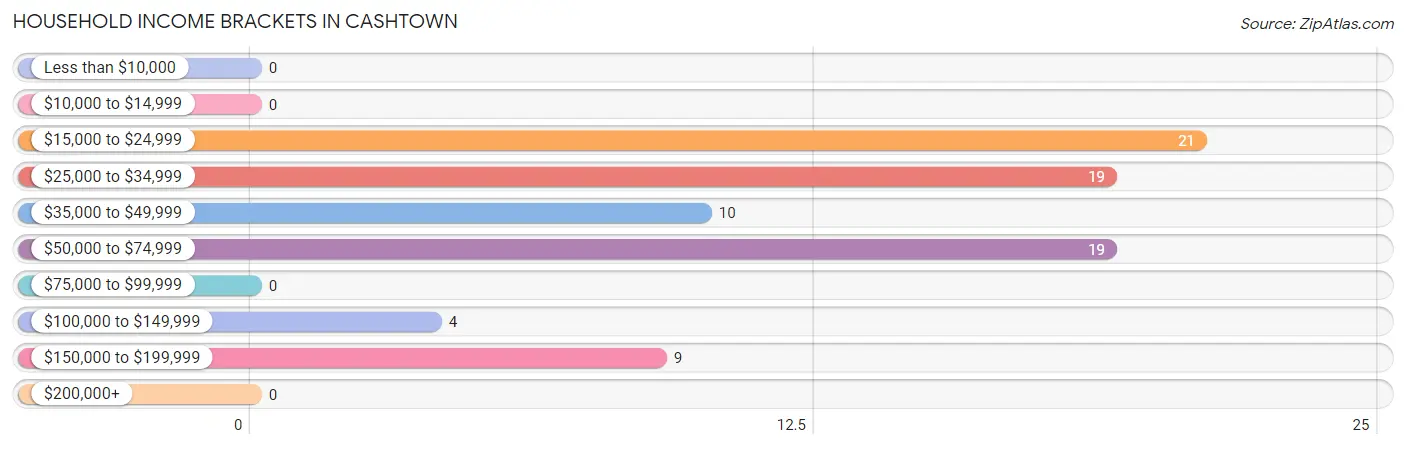
| Income Bracket | # Households | % Households |
| Less than $10,000 | 0 | 0.0% |
| $10,000 to $14,999 | 0 | 0.0% |
| $15,000 to $24,999 | 21 | 25.6% |
| $25,000 to $34,999 | 19 | 23.2% |
| $35,000 to $49,999 | 10 | 12.2% |
| $50,000 to $74,999 | 19 | 23.2% |
| $75,000 to $99,999 | 0 | 0.0% |
| $100,000 to $149,999 | 4 | 4.9% |
| $150,000 to $199,999 | 9 | 11.0% |
| $200,000+ | 0 | 0.0% |
Household Income by Householder Age in Cashtown
The median household income in Cashtown is $0, with the highest median household income of $30,132 found in the 65+ years age bracket for the primary householder. A total of 44 households (53.7%) fall into this category.
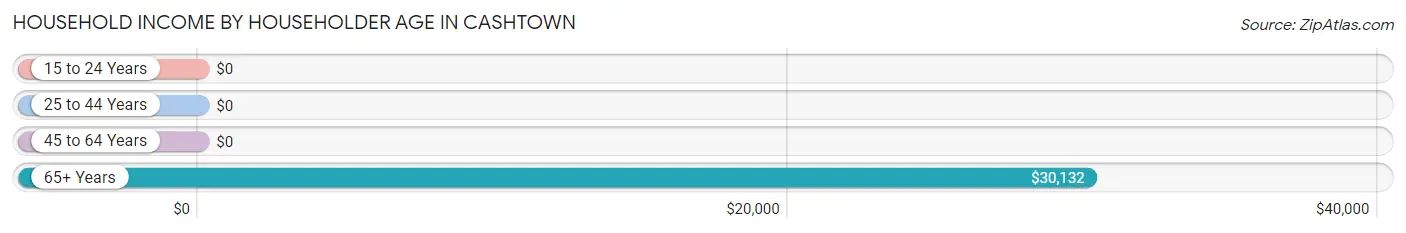
| Income Bracket | # Households | Median Income |
| 15 to 24 Years | 0 (0.0%) | $0 |
| 25 to 44 Years | 19 (23.2%) | $0 |
| 45 to 64 Years | 19 (23.2%) | $0 |
| 65+ Years | 44 (53.7%) | $30,132 |
| Total | 82 (100.0%) | $0 |
Poverty in Cashtown
Income Below Poverty by Sex and Age in Cashtown
With 13.5% poverty level for males and 20.3% for females among the residents of Cashtown, 18 to 24 year old males and 16 and 17 year old females are the most vulnerable to poverty, with 23 males (63.9%) and 23 females (100.0%) in their respective age groups living below the poverty level.
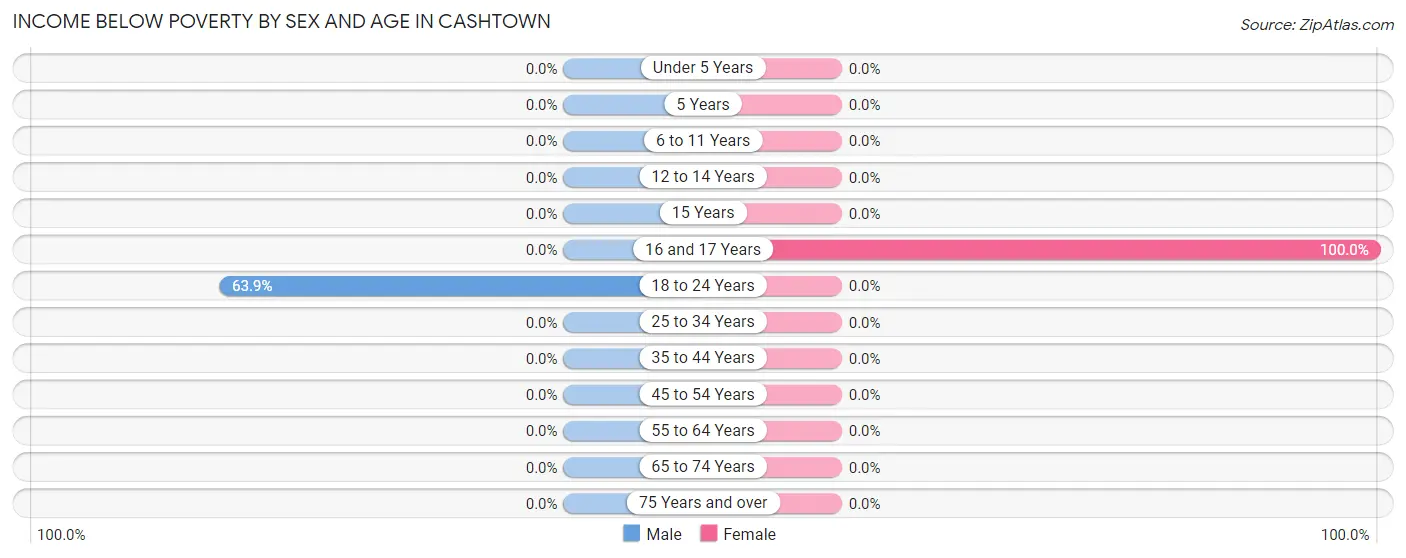
| Age Bracket | Male | Female |
| Under 5 Years | 0 (0.0%) | 0 (0.0%) |
| 5 Years | 0 (0.0%) | 0 (0.0%) |
| 6 to 11 Years | 0 (0.0%) | 0 (0.0%) |
| 12 to 14 Years | 0 (0.0%) | 0 (0.0%) |
| 15 Years | 0 (0.0%) | 0 (0.0%) |
| 16 and 17 Years | 0 (0.0%) | 23 (100.0%) |
| 18 to 24 Years | 23 (63.9%) | 0 (0.0%) |
| 25 to 34 Years | 0 (0.0%) | 0 (0.0%) |
| 35 to 44 Years | 0 (0.0%) | 0 (0.0%) |
| 45 to 54 Years | 0 (0.0%) | 0 (0.0%) |
| 55 to 64 Years | 0 (0.0%) | 0 (0.0%) |
| 65 to 74 Years | 0 (0.0%) | 0 (0.0%) |
| 75 Years and over | 0 (0.0%) | 0 (0.0%) |
| Total | 23 (13.5%) | 23 (20.3%) |
Income Above Poverty by Sex and Age in Cashtown
According to the poverty statistics in Cashtown, males aged 35 to 44 years and females aged 18 to 24 years are the age groups that are most secure financially, with 100.0% of males and 100.0% of females in these age groups living above the poverty line.
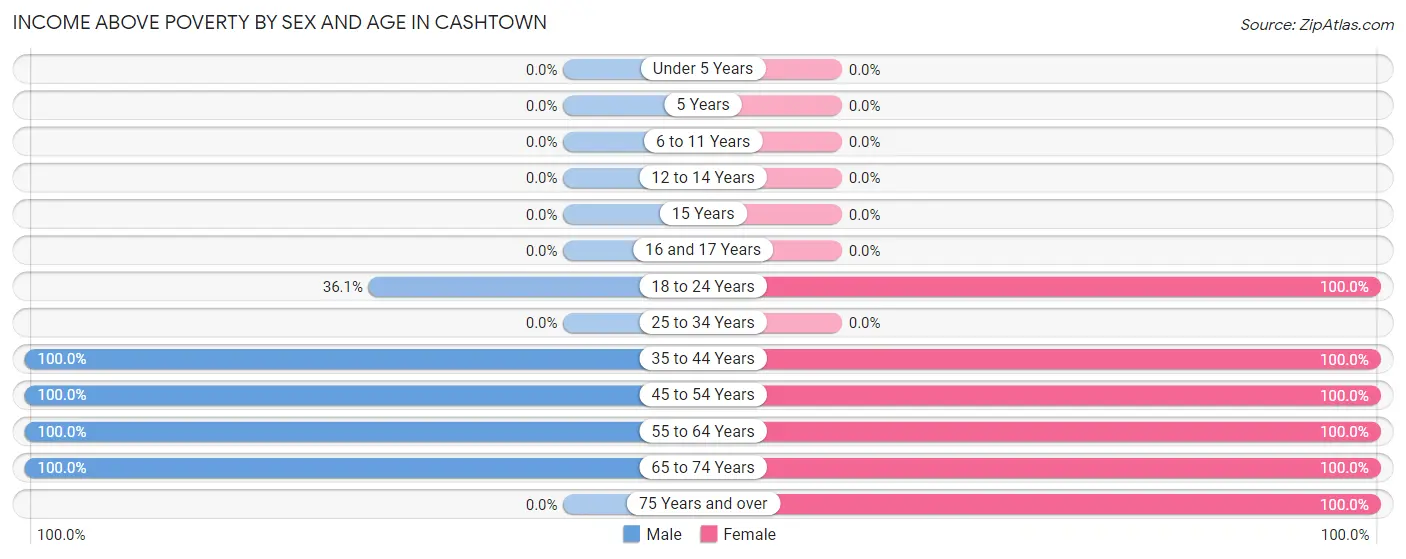
| Age Bracket | Male | Female |
| Under 5 Years | 0 (0.0%) | 0 (0.0%) |
| 5 Years | 0 (0.0%) | 0 (0.0%) |
| 6 to 11 Years | 0 (0.0%) | 0 (0.0%) |
| 12 to 14 Years | 0 (0.0%) | 0 (0.0%) |
| 15 Years | 0 (0.0%) | 0 (0.0%) |
| 16 and 17 Years | 0 (0.0%) | 0 (0.0%) |
| 18 to 24 Years | 13 (36.1%) | 6 (100.0%) |
| 25 to 34 Years | 0 (0.0%) | 0 (0.0%) |
| 35 to 44 Years | 1 (100.0%) | 19 (100.0%) |
| 45 to 54 Years | 104 (100.0%) | 9 (100.0%) |
| 55 to 64 Years | 25 (100.0%) | 10 (100.0%) |
| 65 to 74 Years | 4 (100.0%) | 27 (100.0%) |
| 75 Years and over | 0 (0.0%) | 19 (100.0%) |
| Total | 147 (86.5%) | 90 (79.6%) |
Income Below Poverty Among Married-Couple Families in Cashtown
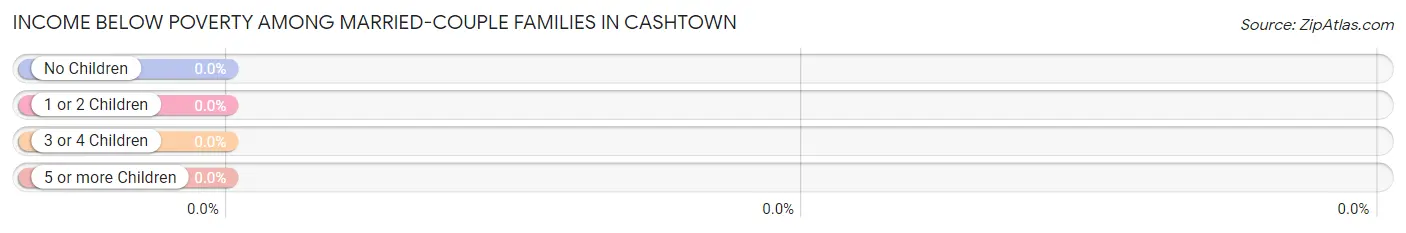
| Children | Above Poverty | Below Poverty |
| No Children | 32 (100.0%) | 0 (0.0%) |
| 1 or 2 Children | 0 (0.0%) | 0 (0.0%) |
| 3 or 4 Children | 0 (0.0%) | 0 (0.0%) |
| 5 or more Children | 0 (0.0%) | 0 (0.0%) |
| Total | 32 (100.0%) | 0 (0.0%) |
Income Below Poverty Among Single-Parent Households in Cashtown
| Children | Single Father | Single Mother |
| No Children | 0 (0.0%) | 0 (0.0%) |
| 1 or 2 Children | 0 (0.0%) | 0 (0.0%) |
| 3 or 4 Children | 0 (0.0%) | 0 (0.0%) |
| 5 or more Children | 0 (0.0%) | 0 (0.0%) |
| Total | 0 (0.0%) | 0 (0.0%) |
Income Below Poverty Among Married-Couple vs Single-Parent Households in Cashtown
| Children | Married-Couple Families | Single-Parent Households |
| No Children | 0 (0.0%) | 0 (0.0%) |
| 1 or 2 Children | 0 (0.0%) | 0 (0.0%) |
| 3 or 4 Children | 0 (0.0%) | 0 (0.0%) |
| 5 or more Children | 0 (0.0%) | 0 (0.0%) |
| Total | 0 (0.0%) | 0 (0.0%) |
Race in Cashtown
The most populous races in Cashtown are White / Caucasian (243 | 85.9%), Black / African American (23 | 8.1%), and Two or more Races (15 | 5.3%).
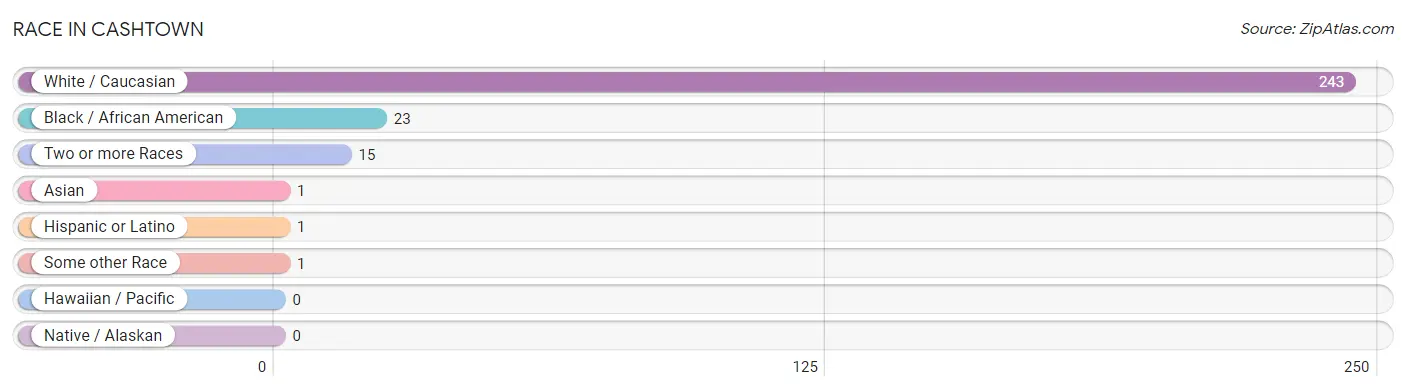
| Race | # Population | % Population |
| Asian | 1 | 0.4% |
| Black / African American | 23 | 8.1% |
| Hawaiian / Pacific | 0 | 0.0% |
| Hispanic or Latino | 1 | 0.4% |
| Native / Alaskan | 0 | 0.0% |
| White / Caucasian | 243 | 85.9% |
| Two or more Races | 15 | 5.3% |
| Some other Race | 1 | 0.4% |
| Total | 283 | 100.0% |
Ancestry in Cashtown
The most populous ancestries reported in Cashtown are American (151 | 53.4%), Irish (46 | 16.3%), German (42 | 14.8%), Scottish (6 | 2.1%), and Mexican (1 | 0.4%), together accounting for 86.9% of all Cashtown residents.
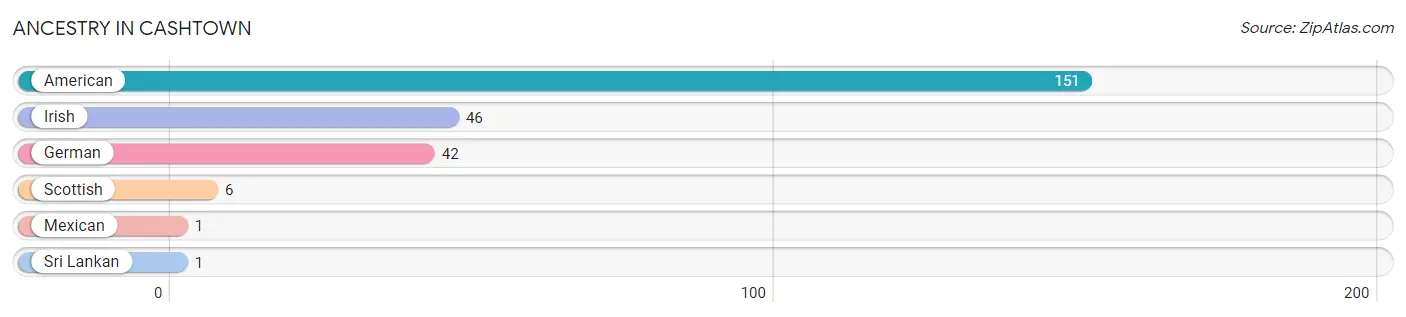
| Ancestry | # Population | % Population |
| American | 151 | 53.4% |
| German | 42 | 14.8% |
| Irish | 46 | 16.3% |
| Mexican | 1 | 0.4% |
| Scottish | 6 | 2.1% |
| Sri Lankan | 1 | 0.4% | View All 6 Rows |
Immigrants in Cashtown
The most numerous immigrant groups reported in Cashtown came from Asia (1 | 0.4%), Central America (1 | 0.4%), Latin America (1 | 0.4%), Mexico (1 | 0.4%), and South Eastern Asia (1 | 0.4%), together accounting for 1.8% of all Cashtown residents.
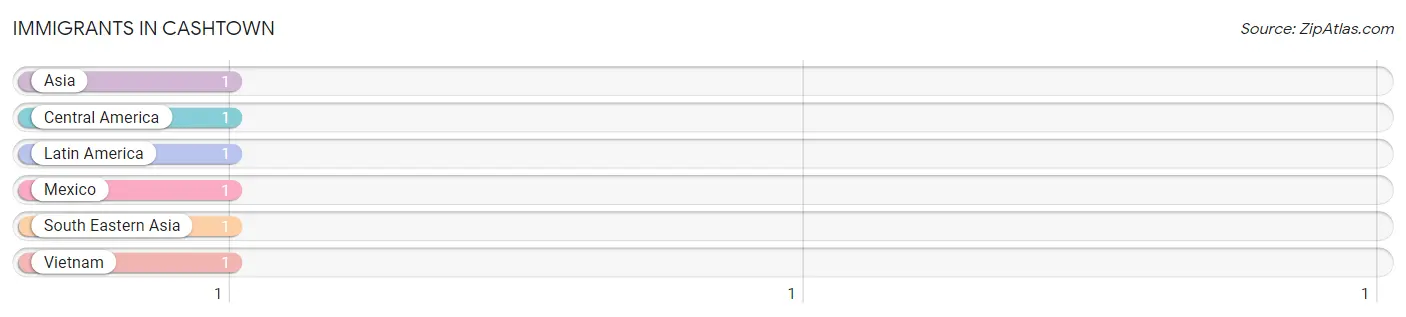
| Immigration Origin | # Population | % Population |
| Asia | 1 | 0.4% |
| Central America | 1 | 0.4% |
| Latin America | 1 | 0.4% |
| Mexico | 1 | 0.4% |
| South Eastern Asia | 1 | 0.4% |
| Vietnam | 1 | 0.4% | View All 6 Rows |
Sex and Age in Cashtown
Sex and Age in Cashtown
The most populous age groups in Cashtown are 50 to 54 Years (65 | 38.2%) for men and 15 to 19 Years (23 | 20.3%) for women.
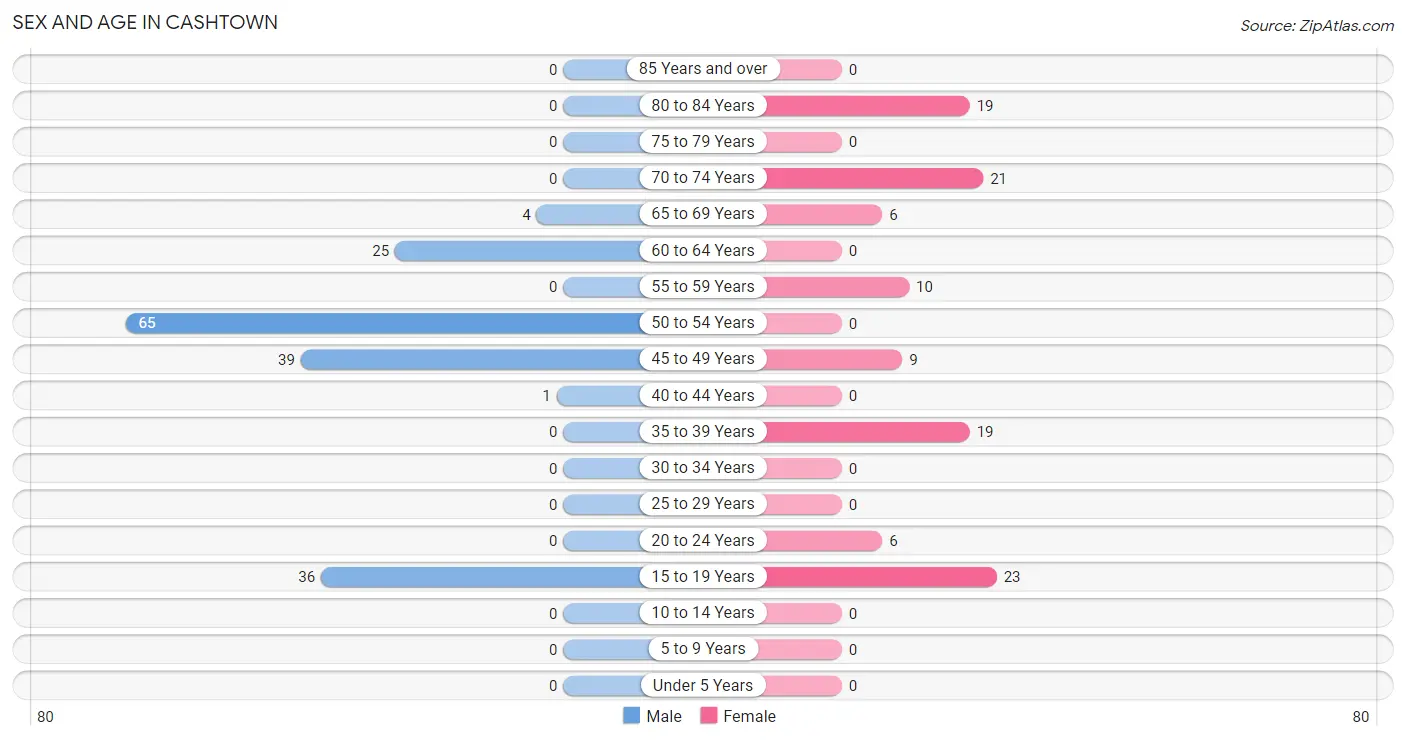
| Age Bracket | Male | Female |
| Under 5 Years | 0 (0.0%) | 0 (0.0%) |
| 5 to 9 Years | 0 (0.0%) | 0 (0.0%) |
| 10 to 14 Years | 0 (0.0%) | 0 (0.0%) |
| 15 to 19 Years | 36 (21.2%) | 23 (20.3%) |
| 20 to 24 Years | 0 (0.0%) | 6 (5.3%) |
| 25 to 29 Years | 0 (0.0%) | 0 (0.0%) |
| 30 to 34 Years | 0 (0.0%) | 0 (0.0%) |
| 35 to 39 Years | 0 (0.0%) | 19 (16.8%) |
| 40 to 44 Years | 1 (0.6%) | 0 (0.0%) |
| 45 to 49 Years | 39 (22.9%) | 9 (8.0%) |
| 50 to 54 Years | 65 (38.2%) | 0 (0.0%) |
| 55 to 59 Years | 0 (0.0%) | 10 (8.8%) |
| 60 to 64 Years | 25 (14.7%) | 0 (0.0%) |
| 65 to 69 Years | 4 (2.4%) | 6 (5.3%) |
| 70 to 74 Years | 0 (0.0%) | 21 (18.6%) |
| 75 to 79 Years | 0 (0.0%) | 0 (0.0%) |
| 80 to 84 Years | 0 (0.0%) | 19 (16.8%) |
| 85 Years and over | 0 (0.0%) | 0 (0.0%) |
| Total | 170 (100.0%) | 113 (100.0%) |
Families and Households in Cashtown
Median Family Size in Cashtown
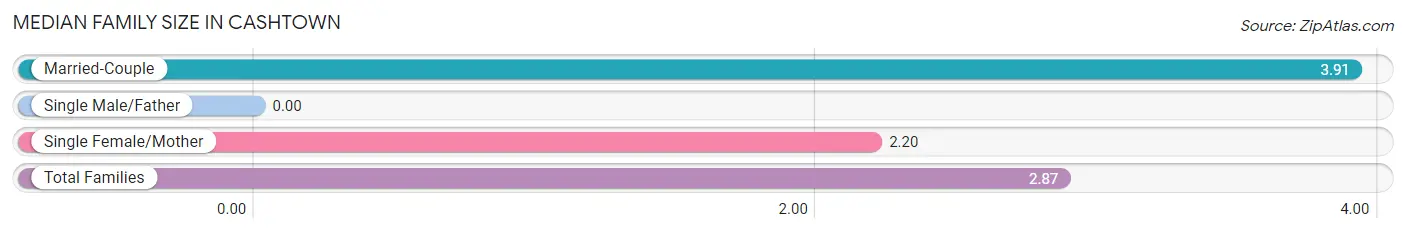
| Family Type | # Families | Family Size |
| Married-Couple | 32 (39.0%) | 3.91 |
| Single Male/Father | 0 (0.0%) | - |
| Single Female/Mother | 50 (61.0%) | 2.20 |
| Total Families | 82 (100.0%) | 2.87 |
Median Household Size in Cashtown
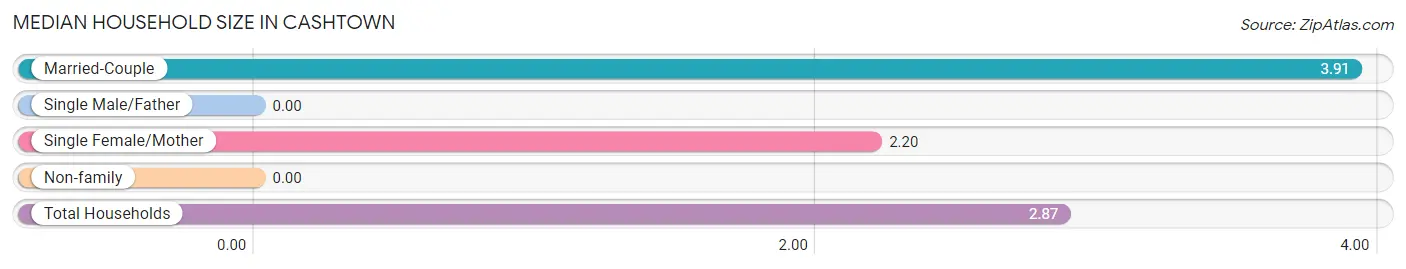
| Household Type | # Households | Household Size |
| Married-Couple | 32 (39.0%) | 3.91 |
| Single Male/Father | 0 (0.0%) | - |
| Single Female/Mother | 50 (61.0%) | 2.20 |
| Non-family | 0 (0.0%) | - |
| Total Households | 82 (100.0%) | 2.87 |
Household Size by Marriage Status in Cashtown
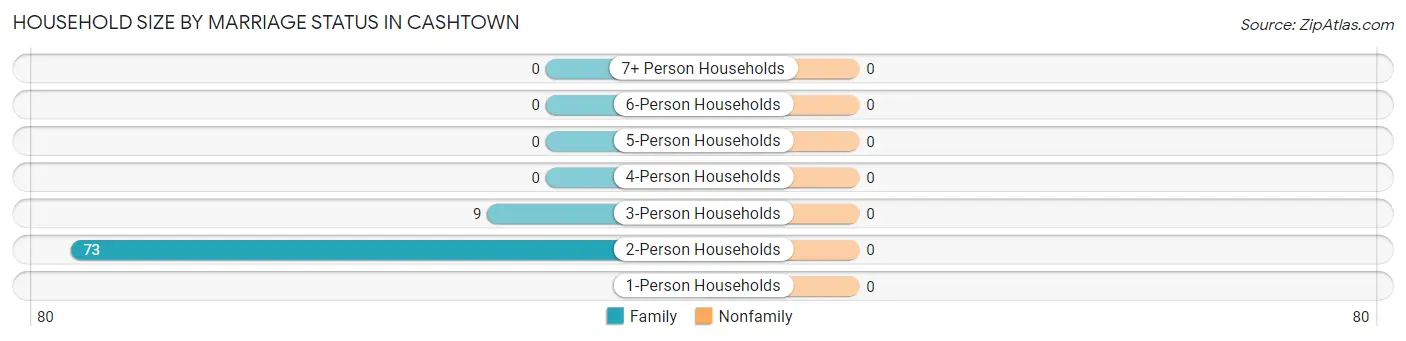
| Household Size | Family Households | Nonfamily Households |
| 1-Person Households | - | 0 (0.0%) |
| 2-Person Households | 73 (89.0%) | 0 (0.0%) |
| 3-Person Households | 9 (11.0%) | 0 (0.0%) |
| 4-Person Households | 0 (0.0%) | 0 (0.0%) |
| 5-Person Households | 0 (0.0%) | 0 (0.0%) |
| 6-Person Households | 0 (0.0%) | 0 (0.0%) |
| 7+ Person Households | 0 (0.0%) | 0 (0.0%) |
| Total | 82 (100.0%) | 0 (0.0%) |
Female Fertility in Cashtown
Fertility by Age in Cashtown
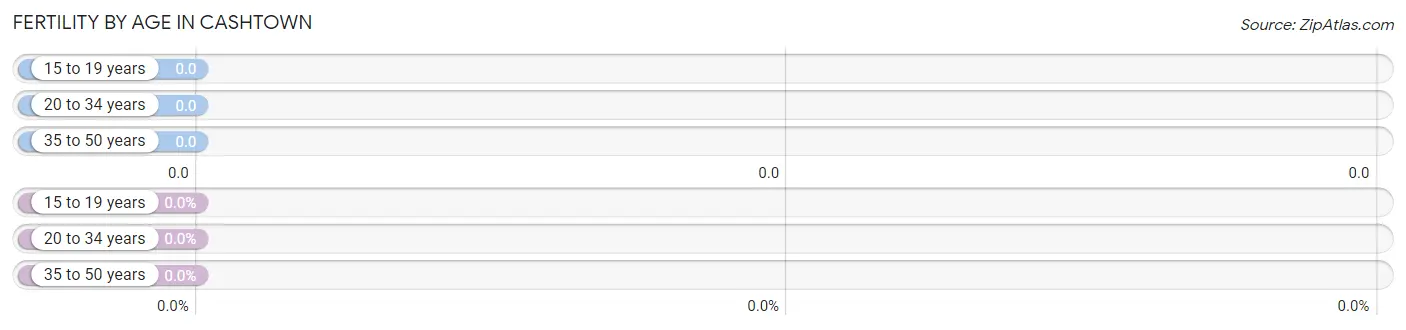
| Age Bracket | Women with Births | Births / 1,000 Women |
| 15 to 19 years | 0 (0.0%) | 0.0 |
| 20 to 34 years | 0 (0.0%) | 0.0 |
| 35 to 50 years | 0 (0.0%) | 0.0 |
| Total | 0 (0.0%) | 0.0 |
Fertility by Age by Marriage Status in Cashtown
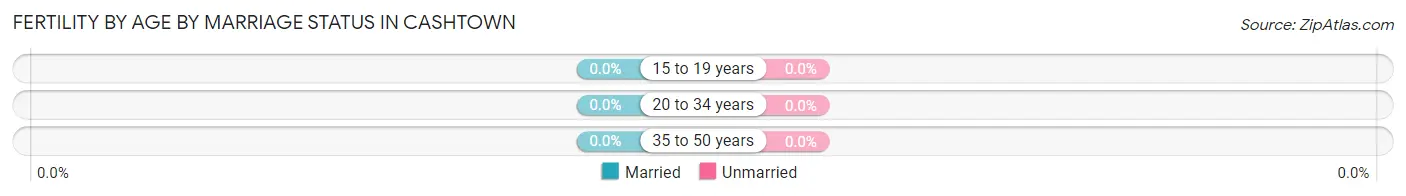
| Age Bracket | Married | Unmarried |
| 15 to 19 years | 0 (0.0%) | 0 (0.0%) |
| 20 to 34 years | 0 (0.0%) | 0 (0.0%) |
| 35 to 50 years | 0 (0.0%) | 0 (0.0%) |
| Total | 0 (0.0%) | 0 (0.0%) |
Fertility by Education in Cashtown
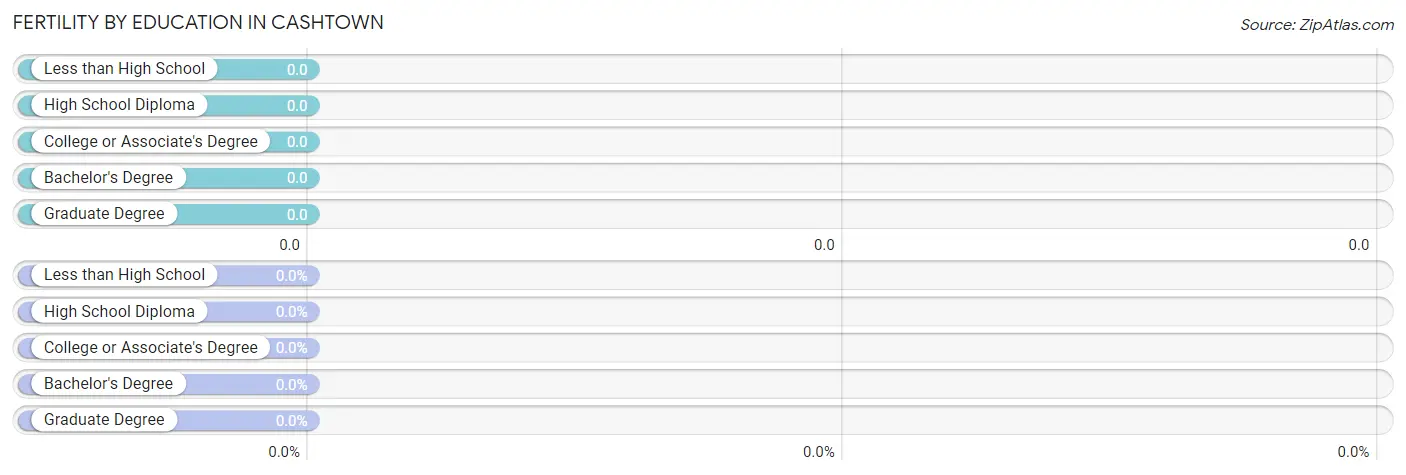
| Educational Attainment | Women with Births | Births / 1,000 Women |
| Less than High School | 0 (0.0%) | 0.0 |
| High School Diploma | 0 (0.0%) | 0.0 |
| College or Associate's Degree | 0 (0.0%) | 0.0 |
| Bachelor's Degree | 0 (0.0%) | 0.0 |
| Graduate Degree | 0 (0.0%) | 0.0 |
| Total | 0 (0.0%) | 0.0 |
Fertility by Education by Marriage Status in Cashtown
| Educational Attainment | Married | Unmarried |
| Less than High School | 0 (0.0%) | 0 (0.0%) |
| High School Diploma | 0 (0.0%) | 0 (0.0%) |
| College or Associate's Degree | 0 (0.0%) | 0 (0.0%) |
| Bachelor's Degree | 0 (0.0%) | 0 (0.0%) |
| Graduate Degree | 0 (0.0%) | 0 (0.0%) |
| Total | 0 (0.0%) | 0 (0.0%) |
Employment Characteristics in Cashtown
Employment by Class of Employer in Cashtown
Among the 127 employed individuals in Cashtown, private company employees (81 | 63.8%), local government employees (19 | 15.0%), and self-employed (incorporated) (17 | 13.4%) make up the most common classes of employment.
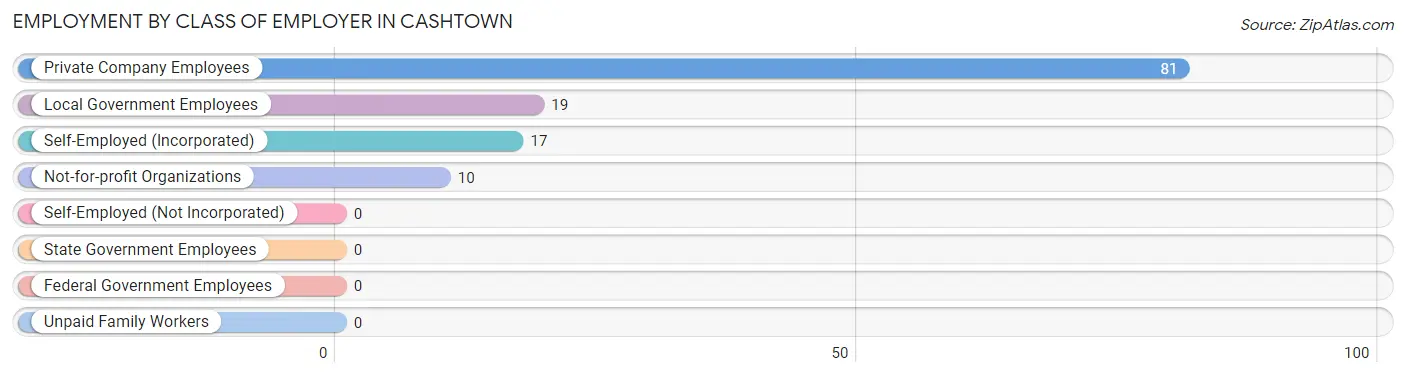
| Employer Class | # Employees | % Employees |
| Private Company Employees | 81 | 63.8% |
| Self-Employed (Incorporated) | 17 | 13.4% |
| Self-Employed (Not Incorporated) | 0 | 0.0% |
| Not-for-profit Organizations | 10 | 7.9% |
| Local Government Employees | 19 | 15.0% |
| State Government Employees | 0 | 0.0% |
| Federal Government Employees | 0 | 0.0% |
| Unpaid Family Workers | 0 | 0.0% |
| Total | 127 | 100.0% |
Employment Status by Age in Cashtown
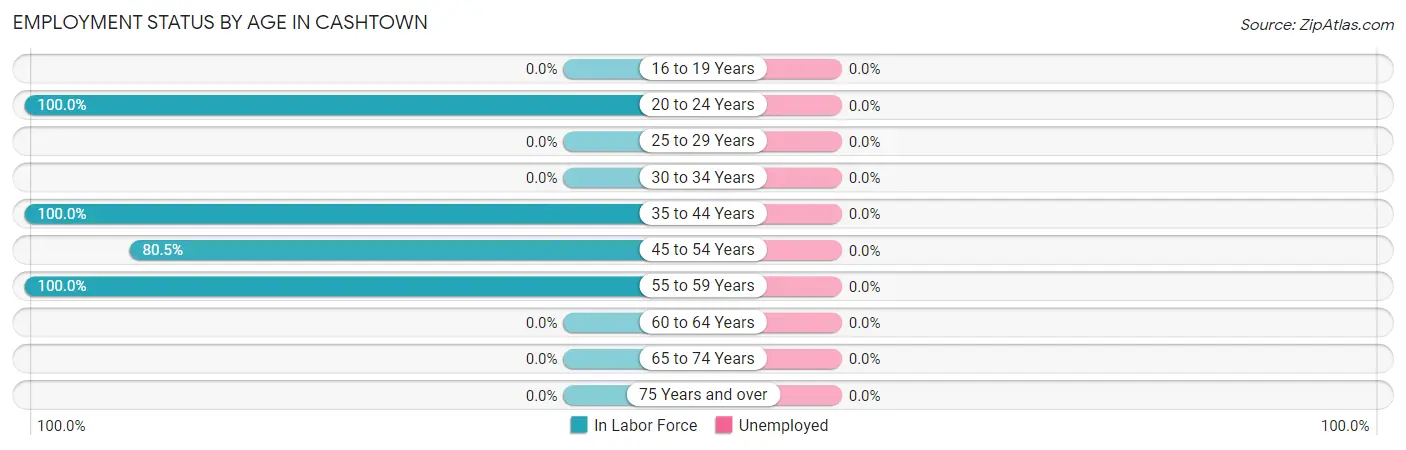
| Age Bracket | In Labor Force | Unemployed |
| 16 to 19 Years | 0 (0.0%) | 0 (0.0%) |
| 20 to 24 Years | 6 (100.0%) | 0 (0.0%) |
| 25 to 29 Years | 0 (0.0%) | 0 (0.0%) |
| 30 to 34 Years | 0 (0.0%) | 0 (0.0%) |
| 35 to 44 Years | 20 (100.0%) | 0 (0.0%) |
| 45 to 54 Years | 91 (80.5%) | 0 (0.0%) |
| 55 to 59 Years | 10 (100.0%) | 0 (0.0%) |
| 60 to 64 Years | 0 (0.0%) | 0 (0.0%) |
| 65 to 74 Years | 0 (0.0%) | 0 (0.0%) |
| 75 Years and over | 0 (0.0%) | 0 (0.0%) |
| Total | 127 (44.9%) | 0 (0.0%) |
Employment Status by Educational Attainment in Cashtown
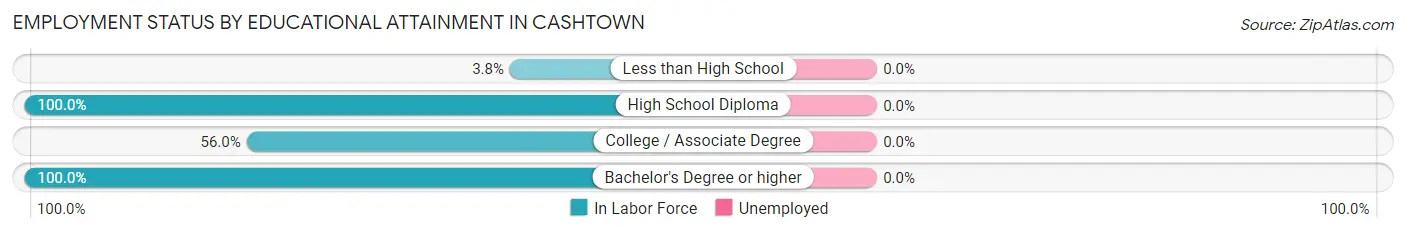
| Educational Attainment | In Labor Force | Unemployed |
| Less than High School | 1 (3.8%) | 0 (0.0%) |
| High School Diploma | 91 (100.0%) | 0 (0.0%) |
| College / Associate Degree | 28 (56.0%) | 0 (0.0%) |
| Bachelor's Degree or higher | 1 (100.0%) | 0 (0.0%) |
| Total | 121 (72.0%) | 0 (0.0%) |
Employment Occupations by Sex in Cashtown
Management, Business, Science and Arts Occupations
The most common Management, Business, Science and Arts occupations in Cashtown are Management (9 | 7.1%), Community & Social Service (1 | 0.8%), and Education, Arts & Media (1 | 0.8%).
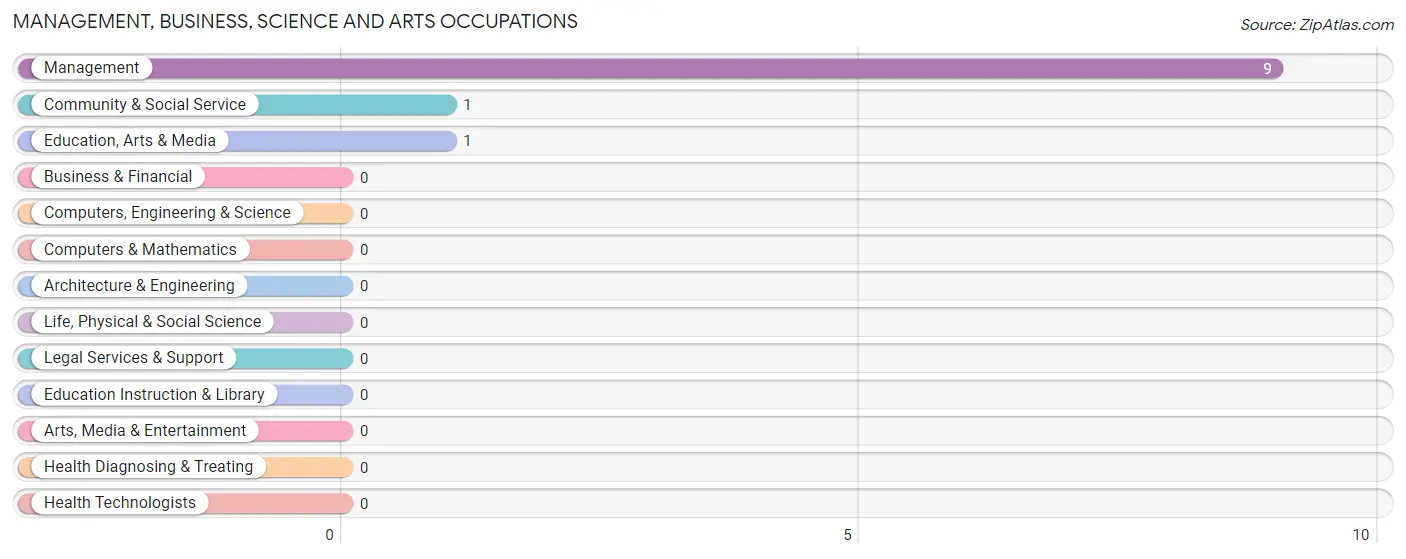
Management, Business, Science and Arts Occupations by Sex
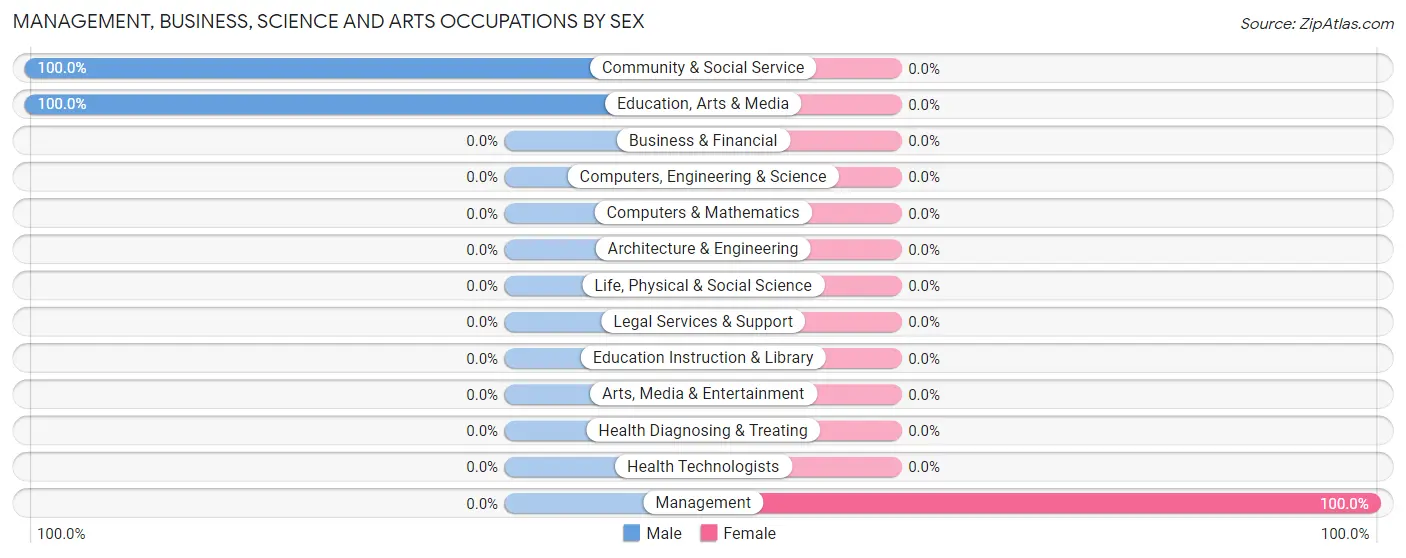
| Occupation | Male | Female |
| Management | 0 (0.0%) | 9 (100.0%) |
| Business & Financial | 0 (0.0%) | 0 (0.0%) |
| Computers, Engineering & Science | 0 (0.0%) | 0 (0.0%) |
| Computers & Mathematics | 0 (0.0%) | 0 (0.0%) |
| Architecture & Engineering | 0 (0.0%) | 0 (0.0%) |
| Life, Physical & Social Science | 0 (0.0%) | 0 (0.0%) |
| Community & Social Service | 1 (100.0%) | 0 (0.0%) |
| Education, Arts & Media | 1 (100.0%) | 0 (0.0%) |
| Legal Services & Support | 0 (0.0%) | 0 (0.0%) |
| Education Instruction & Library | 0 (0.0%) | 0 (0.0%) |
| Arts, Media & Entertainment | 0 (0.0%) | 0 (0.0%) |
| Health Diagnosing & Treating | 0 (0.0%) | 0 (0.0%) |
| Health Technologists | 0 (0.0%) | 0 (0.0%) |
| Total (Category) | 1 (10.0%) | 9 (90.0%) |
| Total (Overall) | 83 (65.3%) | 44 (34.6%) |
Services Occupations
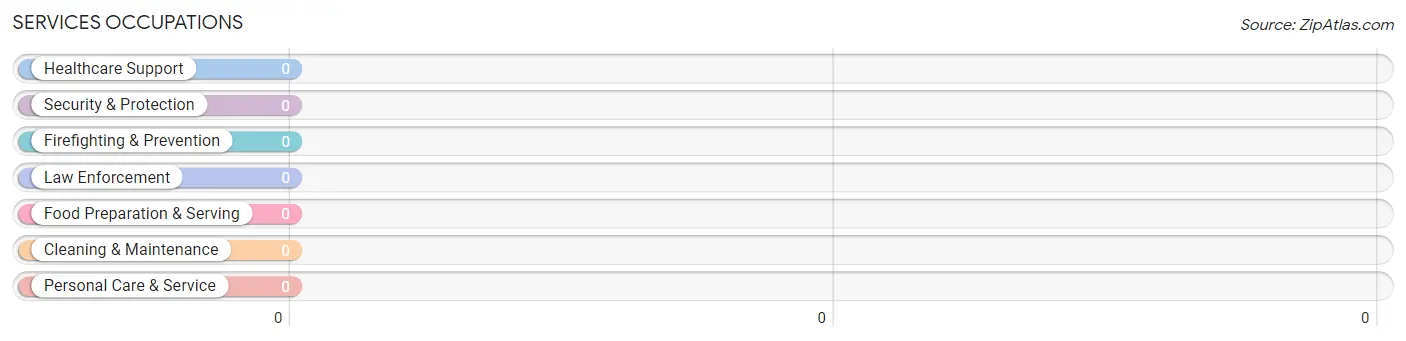
Services Occupations by Sex
| Occupation | Male | Female |
| Healthcare Support | 0 (0.0%) | 0 (0.0%) |
| Security & Protection | 0 (0.0%) | 0 (0.0%) |
| Firefighting & Prevention | 0 (0.0%) | 0 (0.0%) |
| Law Enforcement | 0 (0.0%) | 0 (0.0%) |
| Food Preparation & Serving | 0 (0.0%) | 0 (0.0%) |
| Cleaning & Maintenance | 0 (0.0%) | 0 (0.0%) |
| Personal Care & Service | 0 (0.0%) | 0 (0.0%) |
| Total (Category) | 0 (0.0%) | 0 (0.0%) |
| Total (Overall) | 83 (65.3%) | 44 (34.6%) |
Sales and Office Occupations
The most common Sales and Office occupations in Cashtown are , and Office & Administration (19 | 15.0%).
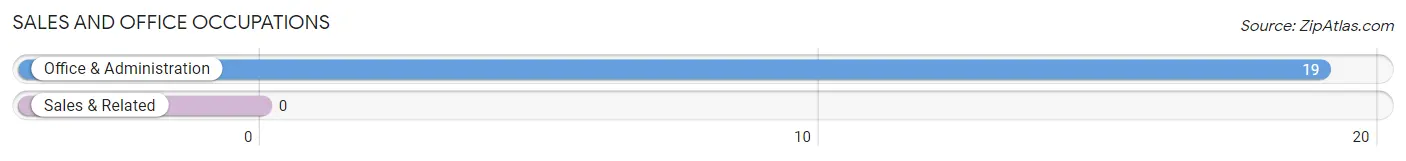
Sales and Office Occupations by Sex
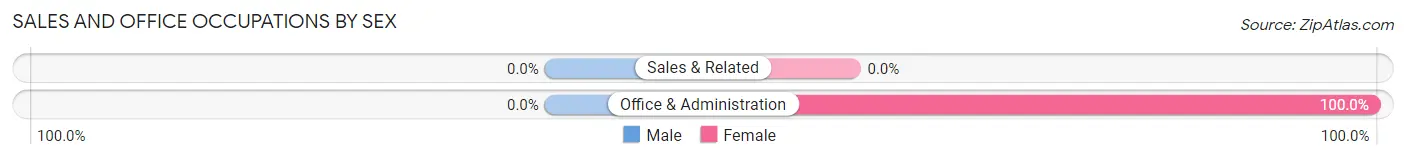
| Occupation | Male | Female |
| Sales & Related | 0 (0.0%) | 0 (0.0%) |
| Office & Administration | 0 (0.0%) | 19 (100.0%) |
| Total (Category) | 0 (0.0%) | 19 (100.0%) |
| Total (Overall) | 83 (65.3%) | 44 (34.6%) |
Natural Resources, Construction and Maintenance Occupations
The most common Natural Resources, Construction and Maintenance occupations in Cashtown are Construction & Extraction (64 | 50.4%), Installation, Maintenance & Repair (17 | 13.4%), and Farming, Fishing & Forestry (1 | 0.8%).
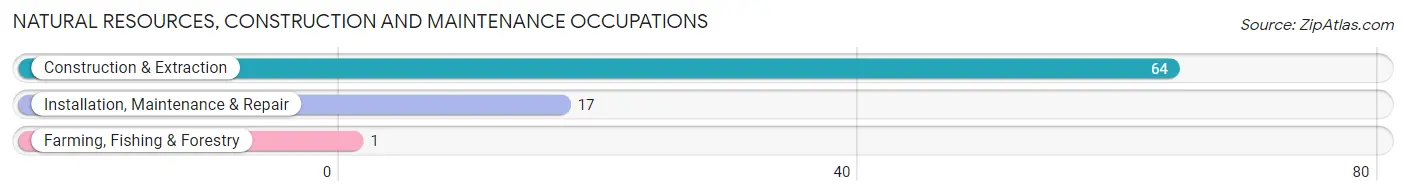
Natural Resources, Construction and Maintenance Occupations by Sex
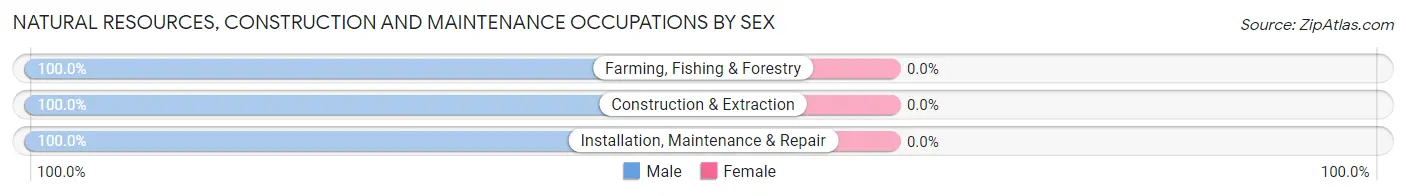
| Occupation | Male | Female |
| Farming, Fishing & Forestry | 1 (100.0%) | 0 (0.0%) |
| Construction & Extraction | 64 (100.0%) | 0 (0.0%) |
| Installation, Maintenance & Repair | 17 (100.0%) | 0 (0.0%) |
| Total (Category) | 82 (100.0%) | 0 (0.0%) |
| Total (Overall) | 83 (65.3%) | 44 (34.6%) |
Production, Transportation and Moving Occupations
The most common Production, Transportation and Moving occupations in Cashtown are Transportation (10 | 7.9%), and Production (6 | 4.7%).
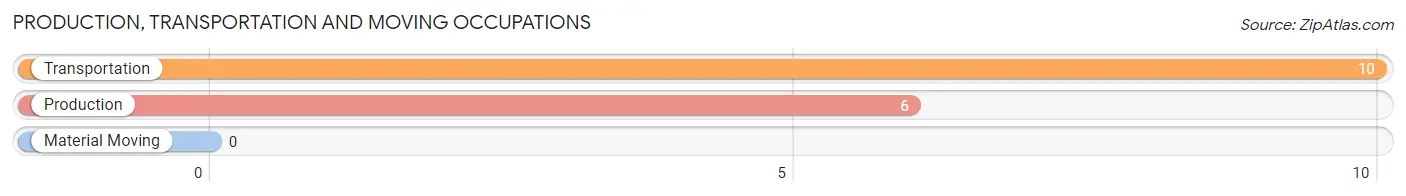
Production, Transportation and Moving Occupations by Sex
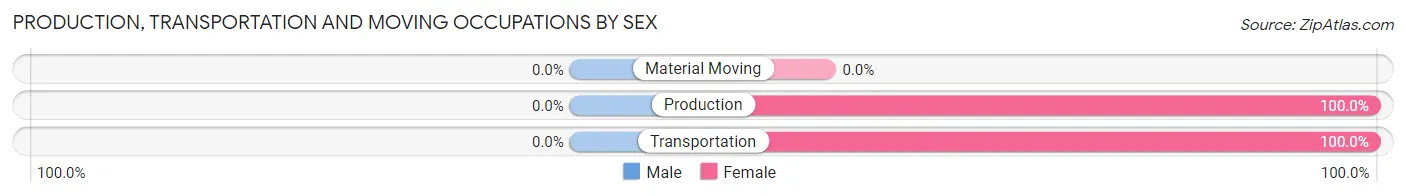
| Occupation | Male | Female |
| Production | 0 (0.0%) | 6 (100.0%) |
| Transportation | 0 (0.0%) | 10 (100.0%) |
| Material Moving | 0 (0.0%) | 0 (0.0%) |
| Total (Category) | 0 (0.0%) | 16 (100.0%) |
| Total (Overall) | 83 (65.3%) | 44 (34.6%) |
Employment Industries by Sex in Cashtown
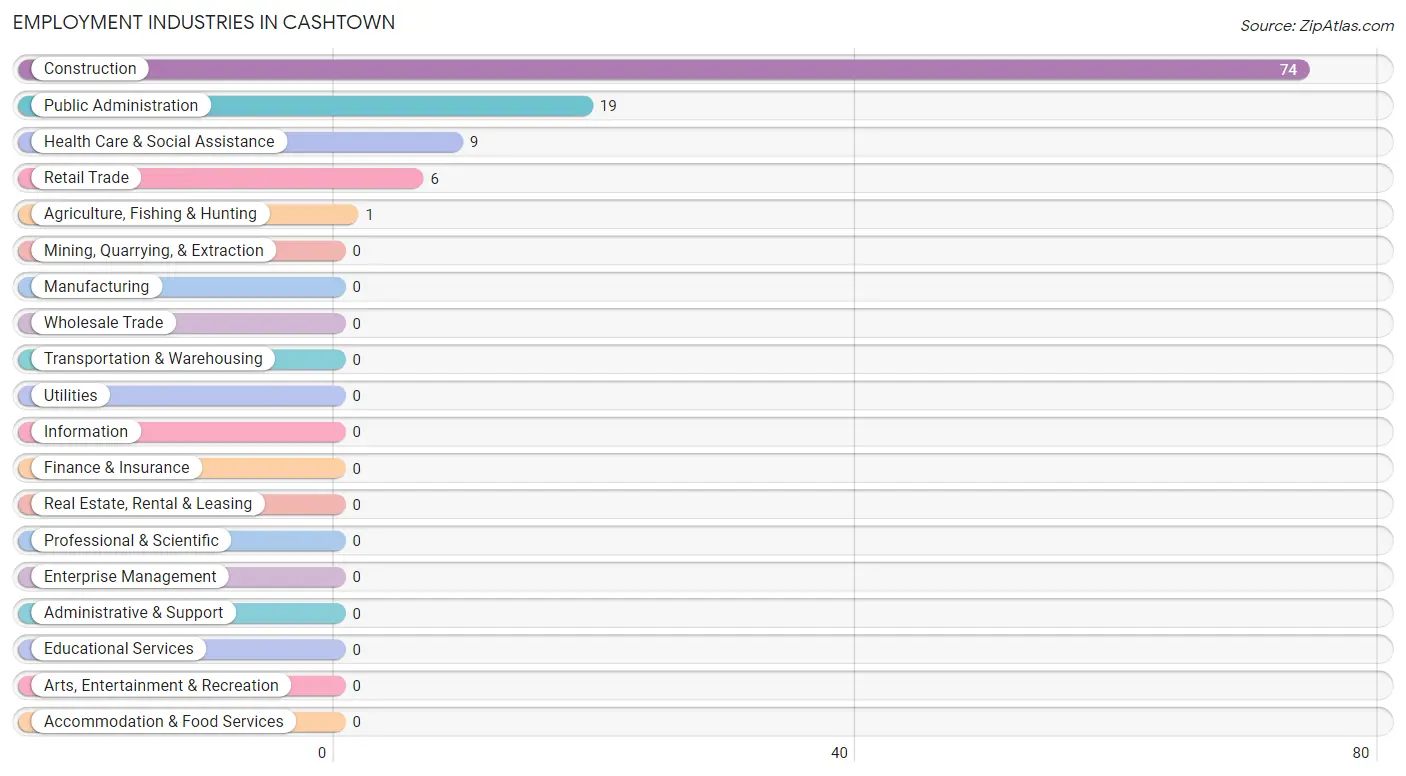
Employment Industries in Cashtown
The major employment industries in Cashtown include Construction (74 | 58.3%), Public Administration (19 | 15.0%), Health Care & Social Assistance (9 | 7.1%), Retail Trade (6 | 4.7%), and Agriculture, Fishing & Hunting (1 | 0.8%).
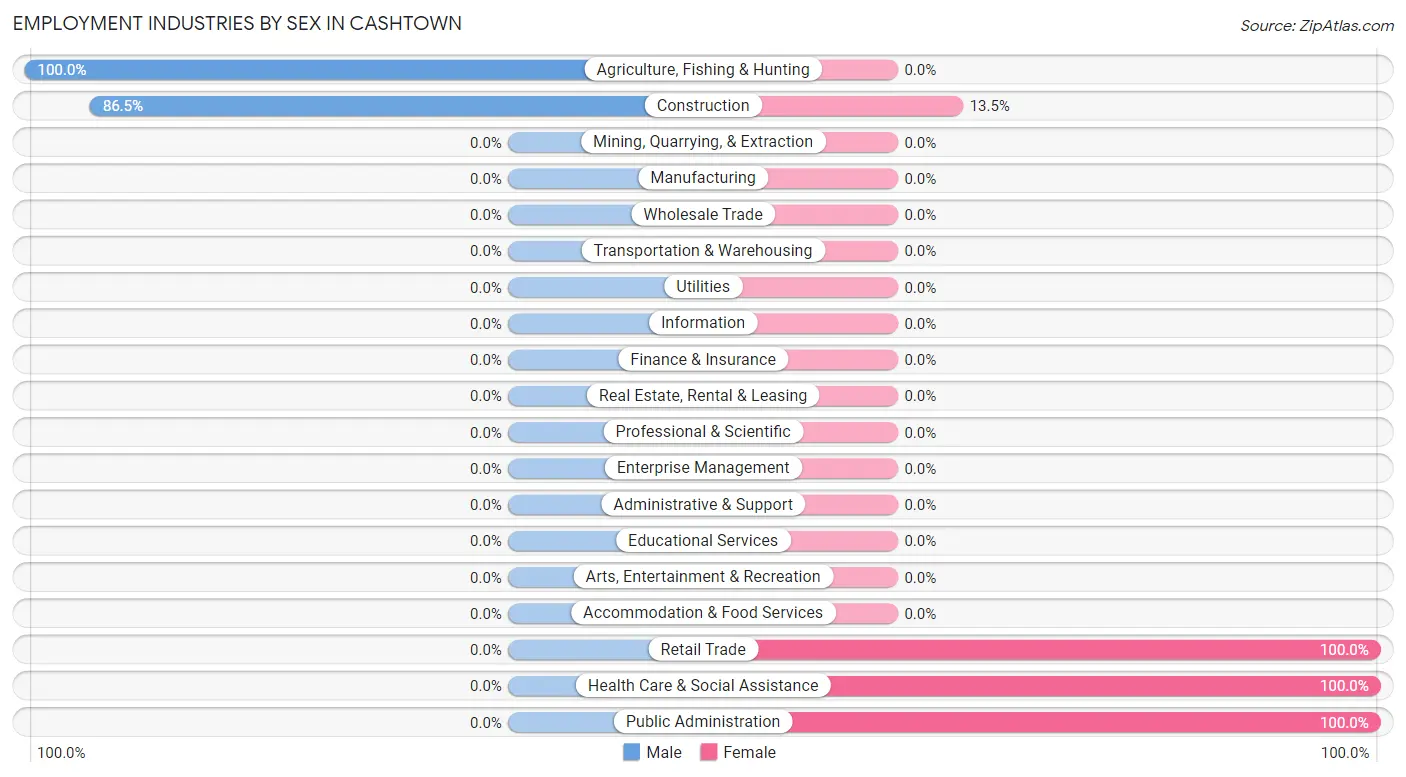
Employment Industries by Sex in Cashtown
The Cashtown industries that see more men than women are Agriculture, Fishing & Hunting (100.0%), and Construction (86.5%), whereas the industries that tend to have a higher number of women are Retail Trade (100.0%), Health Care & Social Assistance (100.0%), and Public Administration (100.0%).
| Industry | Male | Female |
| Agriculture, Fishing & Hunting | 1 (100.0%) | 0 (0.0%) |
| Mining, Quarrying, & Extraction | 0 (0.0%) | 0 (0.0%) |
| Construction | 64 (86.5%) | 10 (13.5%) |
| Manufacturing | 0 (0.0%) | 0 (0.0%) |
| Wholesale Trade | 0 (0.0%) | 0 (0.0%) |
| Retail Trade | 0 (0.0%) | 6 (100.0%) |
| Transportation & Warehousing | 0 (0.0%) | 0 (0.0%) |
| Utilities | 0 (0.0%) | 0 (0.0%) |
| Information | 0 (0.0%) | 0 (0.0%) |
| Finance & Insurance | 0 (0.0%) | 0 (0.0%) |
| Real Estate, Rental & Leasing | 0 (0.0%) | 0 (0.0%) |
| Professional & Scientific | 0 (0.0%) | 0 (0.0%) |
| Enterprise Management | 0 (0.0%) | 0 (0.0%) |
| Administrative & Support | 0 (0.0%) | 0 (0.0%) |
| Educational Services | 0 (0.0%) | 0 (0.0%) |
| Health Care & Social Assistance | 0 (0.0%) | 9 (100.0%) |
| Arts, Entertainment & Recreation | 0 (0.0%) | 0 (0.0%) |
| Accommodation & Food Services | 0 (0.0%) | 0 (0.0%) |
| Public Administration | 0 (0.0%) | 19 (100.0%) |
| Total | 83 (65.3%) | 44 (34.6%) |
Education in Cashtown
School Enrollment in Cashtown
The most common levels of schooling among the 42 students in Cashtown are high school (36 | 85.7%), and college / undergraduate (6 | 14.3%).
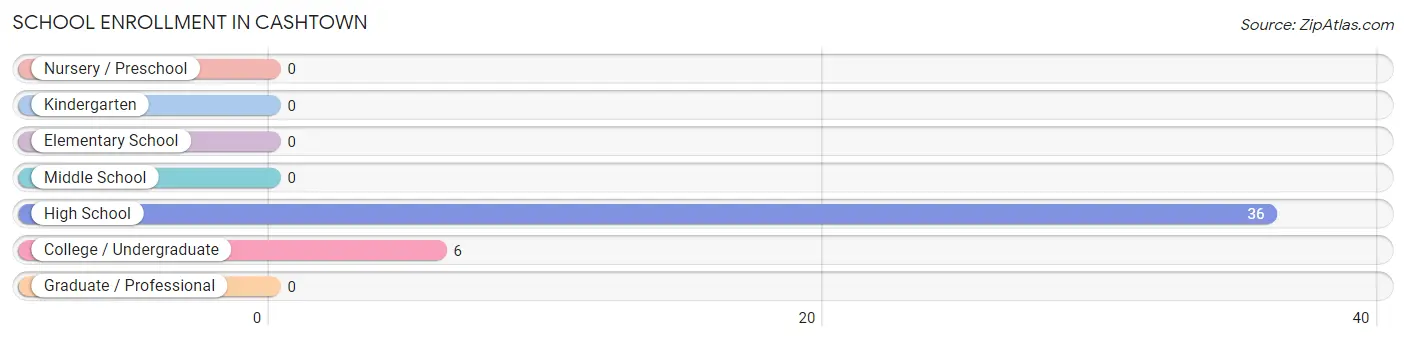
| School Level | # Students | % Students |
| Nursery / Preschool | 0 | 0.0% |
| Kindergarten | 0 | 0.0% |
| Elementary School | 0 | 0.0% |
| Middle School | 0 | 0.0% |
| High School | 36 | 85.7% |
| College / Undergraduate | 6 | 14.3% |
| Graduate / Professional | 0 | 0.0% |
| Total | 42 | 100.0% |
School Enrollment by Age by Funding Source in Cashtown
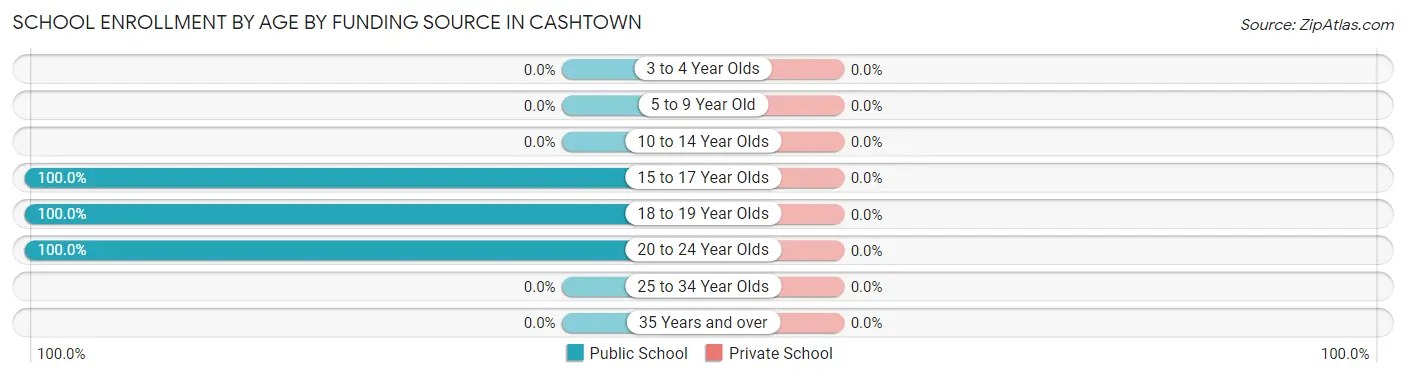
| Age Bracket | Public School | Private School |
| 3 to 4 Year Olds | 0 (0.0%) | 0 (0.0%) |
| 5 to 9 Year Old | 0 (0.0%) | 0 (0.0%) |
| 10 to 14 Year Olds | 0 (0.0%) | 0 (0.0%) |
| 15 to 17 Year Olds | 23 (100.0%) | 0 (0.0%) |
| 18 to 19 Year Olds | 13 (100.0%) | 0 (0.0%) |
| 20 to 24 Year Olds | 6 (100.0%) | 0 (0.0%) |
| 25 to 34 Year Olds | 0 (0.0%) | 0 (0.0%) |
| 35 Years and over | 0 (0.0%) | 0 (0.0%) |
| Total | 42 (100.0%) | 0 (0.0%) |
Educational Attainment by Field of Study in Cashtown
Psychology (6 | 54.5%), education (4 | 36.4%), and liberal arts & history (1 | 9.1%) are the most common fields of study among 11 individuals in Cashtown who have obtained a bachelor's degree or higher.
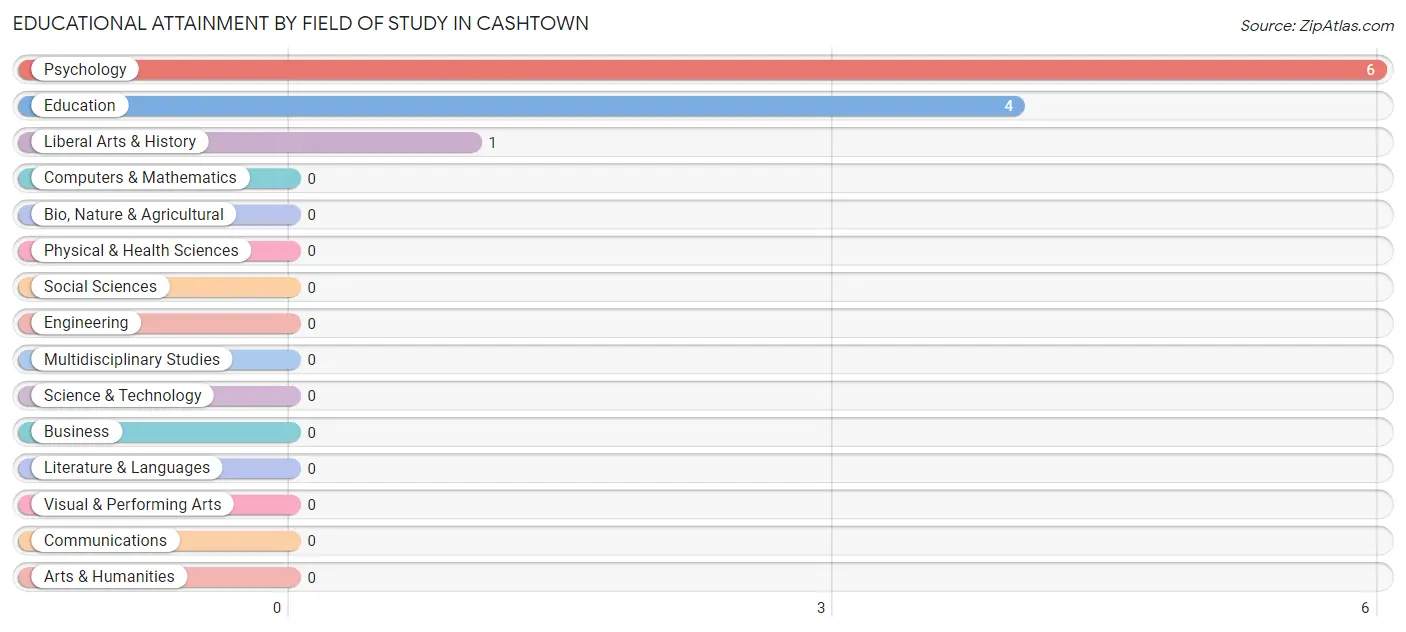
| Field of Study | # Graduates | % Graduates |
| Computers & Mathematics | 0 | 0.0% |
| Bio, Nature & Agricultural | 0 | 0.0% |
| Physical & Health Sciences | 0 | 0.0% |
| Psychology | 6 | 54.5% |
| Social Sciences | 0 | 0.0% |
| Engineering | 0 | 0.0% |
| Multidisciplinary Studies | 0 | 0.0% |
| Science & Technology | 0 | 0.0% |
| Business | 0 | 0.0% |
| Education | 4 | 36.4% |
| Literature & Languages | 0 | 0.0% |
| Liberal Arts & History | 1 | 9.1% |
| Visual & Performing Arts | 0 | 0.0% |
| Communications | 0 | 0.0% |
| Arts & Humanities | 0 | 0.0% |
| Total | 11 | 100.0% |
Transportation & Commute in Cashtown
Vehicle Availability by Sex in Cashtown
The most prevalent vehicle ownership categories in Cashtown are males with 3 vehicles (81, accounting for 100.0%) and females with 3 vehicles (34, making up 184.1%).
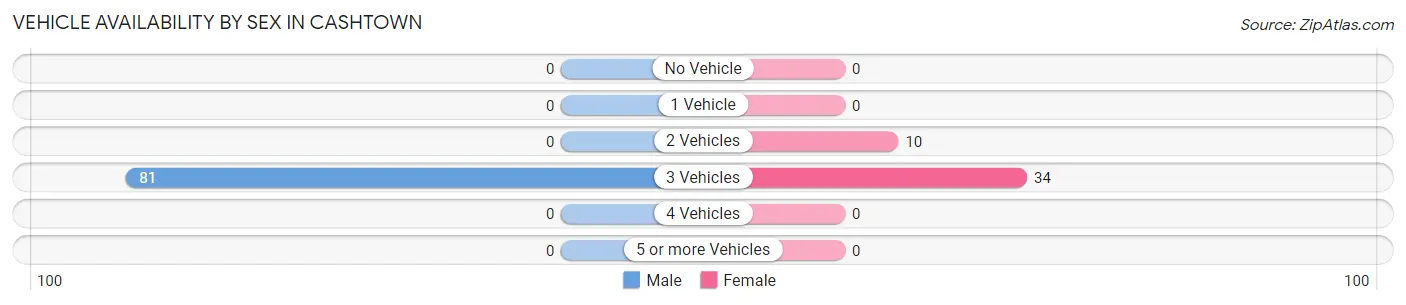
| Vehicles Available | Male | Female |
| No Vehicle | 0 (0.0%) | 0 (0.0%) |
| 1 Vehicle | 0 (0.0%) | 0 (0.0%) |
| 2 Vehicles | 0 (0.0%) | 10 (22.7%) |
| 3 Vehicles | 81 (100.0%) | 34 (77.3%) |
| 4 Vehicles | 0 (0.0%) | 0 (0.0%) |
| 5 or more Vehicles | 0 (0.0%) | 0 (0.0%) |
| Total | 81 (100.0%) | 44 (100.0%) |
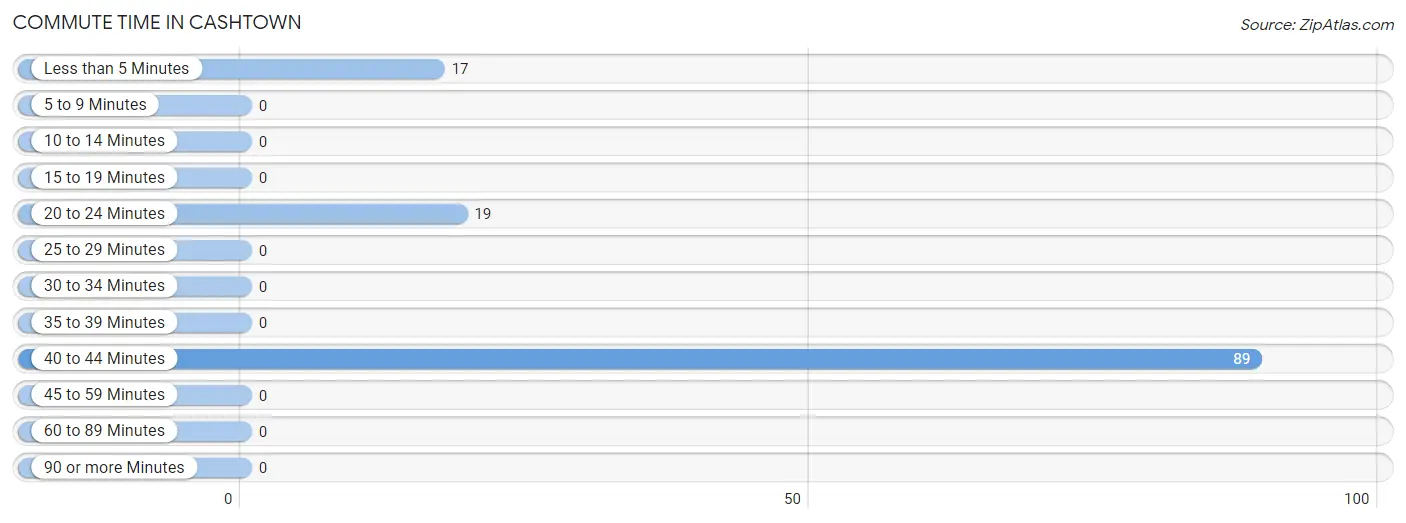
Commute Time in Cashtown
The most frequently occuring commute durations in Cashtown are 40 to 44 minutes (89 commuters, 71.2%), 20 to 24 minutes (19 commuters, 15.2%), and less than 5 minutes (17 commuters, 13.6%).
| Commute Time | # Commuters | % Commuters |
| Less than 5 Minutes | 17 | 13.6% |
| 5 to 9 Minutes | 0 | 0.0% |
| 10 to 14 Minutes | 0 | 0.0% |
| 15 to 19 Minutes | 0 | 0.0% |
| 20 to 24 Minutes | 19 | 15.2% |
| 25 to 29 Minutes | 0 | 0.0% |
| 30 to 34 Minutes | 0 | 0.0% |
| 35 to 39 Minutes | 0 | 0.0% |
| 40 to 44 Minutes | 89 | 71.2% |
| 45 to 59 Minutes | 0 | 0.0% |
| 60 to 89 Minutes | 0 | 0.0% |
| 90 or more Minutes | 0 | 0.0% |
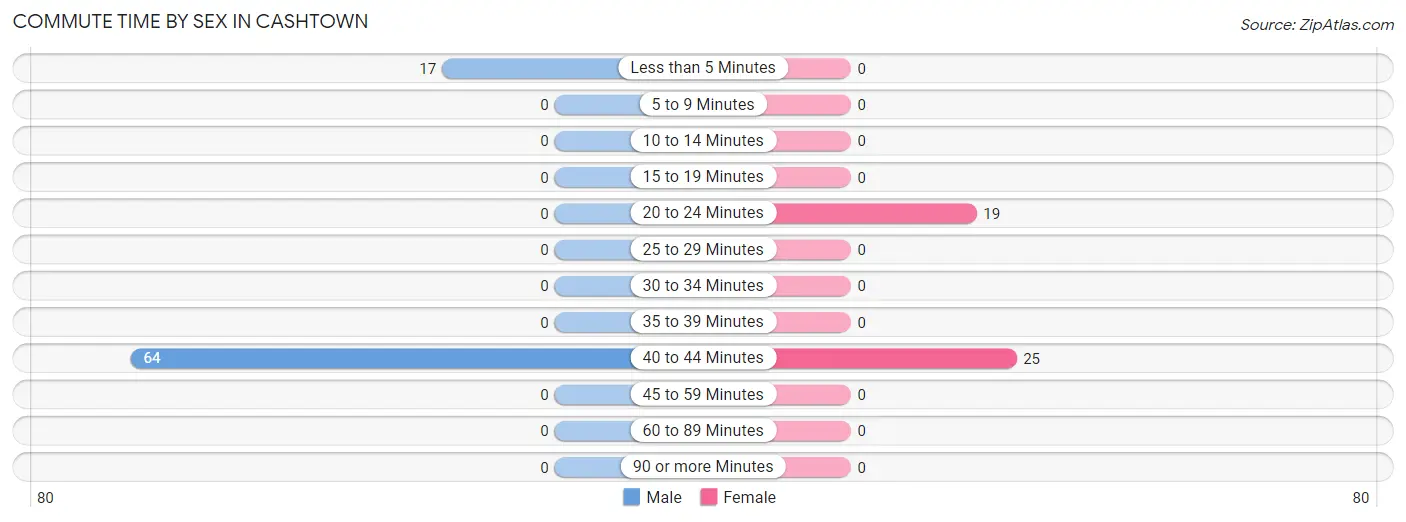
Commute Time by Sex in Cashtown
The most common commute times in Cashtown are 40 to 44 minutes (64 commuters, 79.0%) for males and 40 to 44 minutes (25 commuters, 56.8%) for females.
| Commute Time | Male | Female |
| Less than 5 Minutes | 17 (21.0%) | 0 (0.0%) |
| 5 to 9 Minutes | 0 (0.0%) | 0 (0.0%) |
| 10 to 14 Minutes | 0 (0.0%) | 0 (0.0%) |
| 15 to 19 Minutes | 0 (0.0%) | 0 (0.0%) |
| 20 to 24 Minutes | 0 (0.0%) | 19 (43.2%) |
| 25 to 29 Minutes | 0 (0.0%) | 0 (0.0%) |
| 30 to 34 Minutes | 0 (0.0%) | 0 (0.0%) |
| 35 to 39 Minutes | 0 (0.0%) | 0 (0.0%) |
| 40 to 44 Minutes | 64 (79.0%) | 25 (56.8%) |
| 45 to 59 Minutes | 0 (0.0%) | 0 (0.0%) |
| 60 to 89 Minutes | 0 (0.0%) | 0 (0.0%) |
| 90 or more Minutes | 0 (0.0%) | 0 (0.0%) |
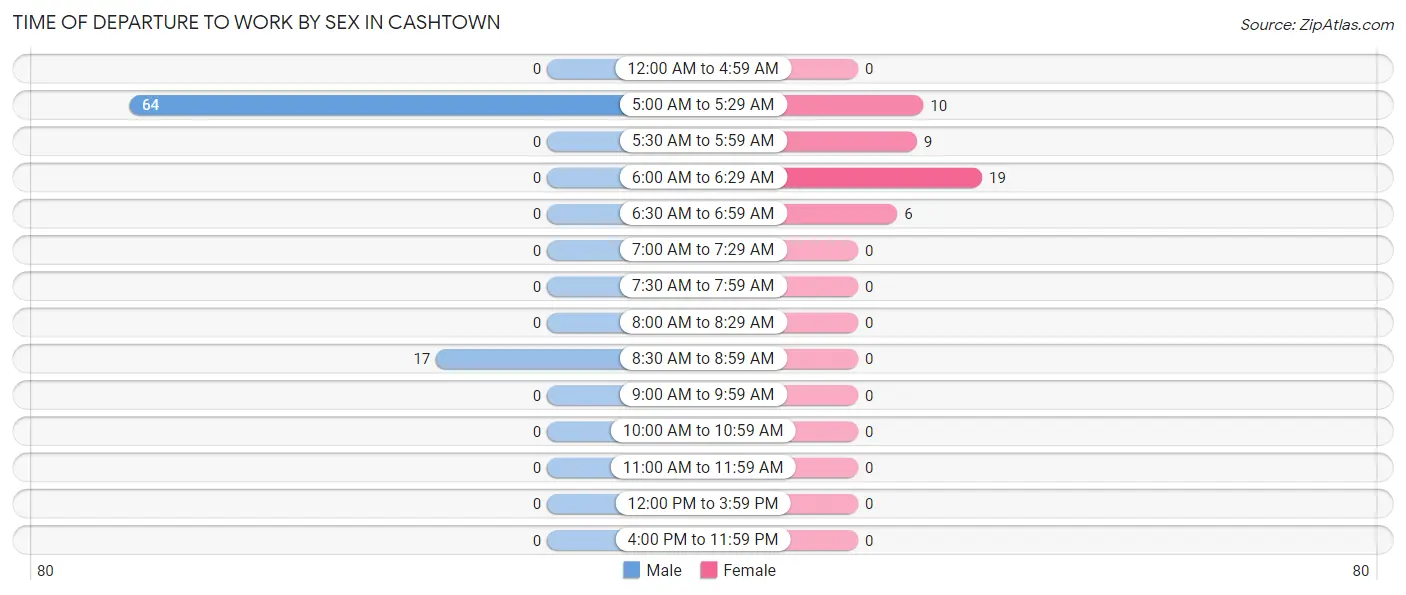
Time of Departure to Work by Sex in Cashtown
The most frequent times of departure to work in Cashtown are 5:00 AM to 5:29 AM (64, 79.0%) for males and 6:00 AM to 6:29 AM (19, 43.2%) for females.
| Time of Departure | Male | Female |
| 12:00 AM to 4:59 AM | 0 (0.0%) | 0 (0.0%) |
| 5:00 AM to 5:29 AM | 64 (79.0%) | 10 (22.7%) |
| 5:30 AM to 5:59 AM | 0 (0.0%) | 9 (20.4%) |
| 6:00 AM to 6:29 AM | 0 (0.0%) | 19 (43.2%) |
| 6:30 AM to 6:59 AM | 0 (0.0%) | 6 (13.6%) |
| 7:00 AM to 7:29 AM | 0 (0.0%) | 0 (0.0%) |
| 7:30 AM to 7:59 AM | 0 (0.0%) | 0 (0.0%) |
| 8:00 AM to 8:29 AM | 0 (0.0%) | 0 (0.0%) |
| 8:30 AM to 8:59 AM | 17 (21.0%) | 0 (0.0%) |
| 9:00 AM to 9:59 AM | 0 (0.0%) | 0 (0.0%) |
| 10:00 AM to 10:59 AM | 0 (0.0%) | 0 (0.0%) |
| 11:00 AM to 11:59 AM | 0 (0.0%) | 0 (0.0%) |
| 12:00 PM to 3:59 PM | 0 (0.0%) | 0 (0.0%) |
| 4:00 PM to 11:59 PM | 0 (0.0%) | 0 (0.0%) |
| Total | 81 (100.0%) | 44 (100.0%) |
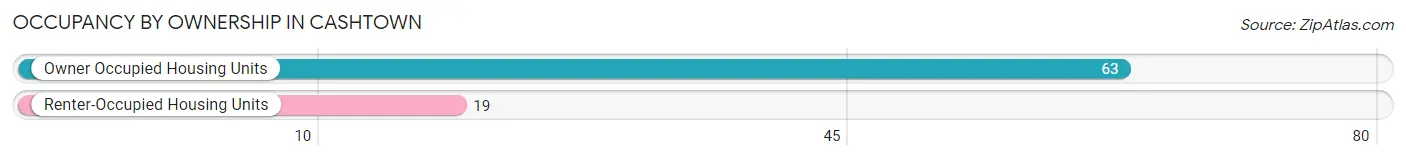
Housing Occupancy in Cashtown
Occupancy by Ownership in Cashtown
Of the total 82 dwellings in Cashtown, owner-occupied units account for 63 (76.8%), while renter-occupied units make up 19 (23.2%).
| Occupancy | # Housing Units | % Housing Units |
| Owner Occupied Housing Units | 63 | 76.8% |
| Renter-Occupied Housing Units | 19 | 23.2% |
| Total Occupied Housing Units | 82 | 100.0% |
Occupancy by Household Size in Cashtown
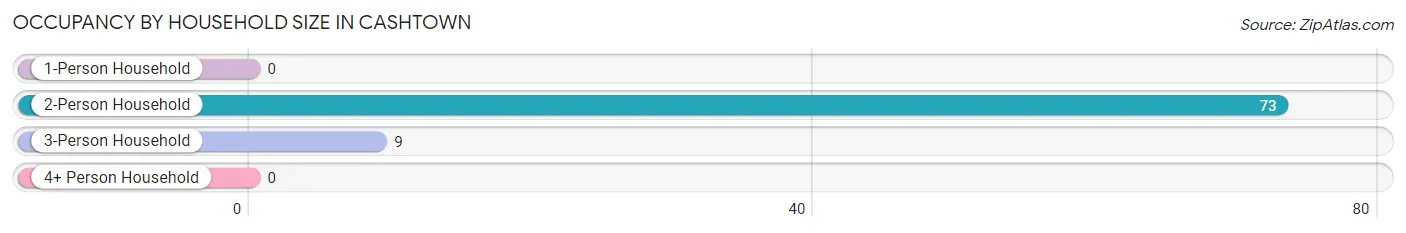
| Household Size | # Housing Units | % Housing Units |
| 1-Person Household | 0 | 0.0% |
| 2-Person Household | 73 | 89.0% |
| 3-Person Household | 9 | 11.0% |
| 4+ Person Household | 0 | 0.0% |
| Total Housing Units | 82 | 100.0% |
Occupancy by Ownership by Household Size in Cashtown
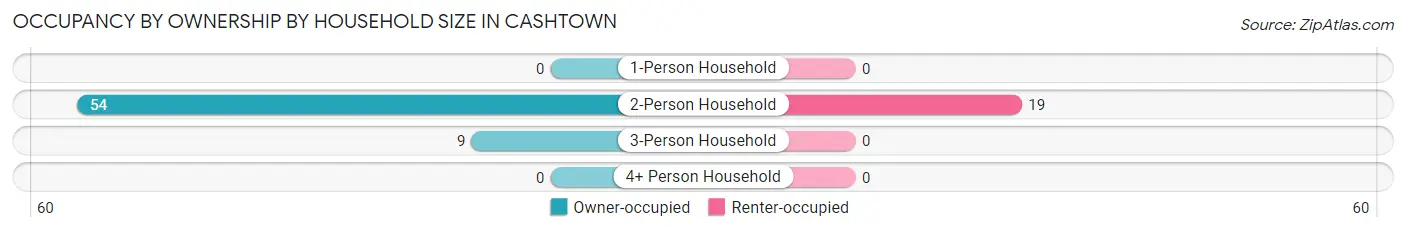
| Household Size | Owner-occupied | Renter-occupied |
| 1-Person Household | 0 (0.0%) | 0 (0.0%) |
| 2-Person Household | 54 (74.0%) | 19 (26.0%) |
| 3-Person Household | 9 (100.0%) | 0 (0.0%) |
| 4+ Person Household | 0 (0.0%) | 0 (0.0%) |
| Total Housing Units | 63 (76.8%) | 19 (23.2%) |
Occupancy by Educational Attainment in Cashtown
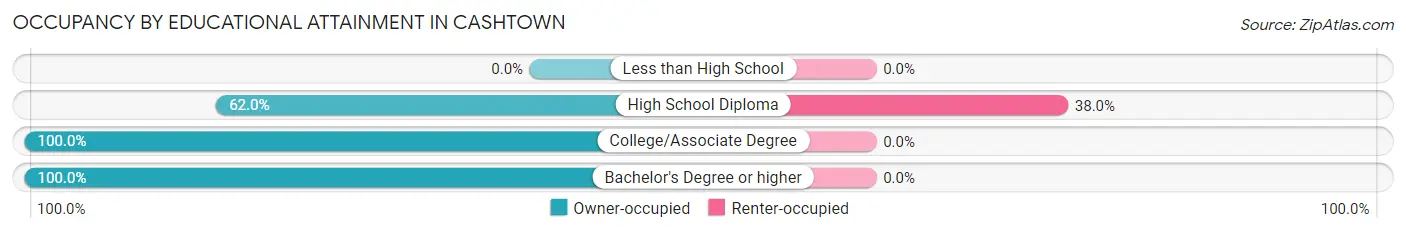
| Household Size | Owner-occupied | Renter-occupied |
| Less than High School | 0 (0.0%) | 0 (0.0%) |
| High School Diploma | 31 (62.0%) | 19 (38.0%) |
| College/Associate Degree | 28 (100.0%) | 0 (0.0%) |
| Bachelor's Degree or higher | 4 (100.0%) | 0 (0.0%) |
Occupancy by Age of Householder in Cashtown
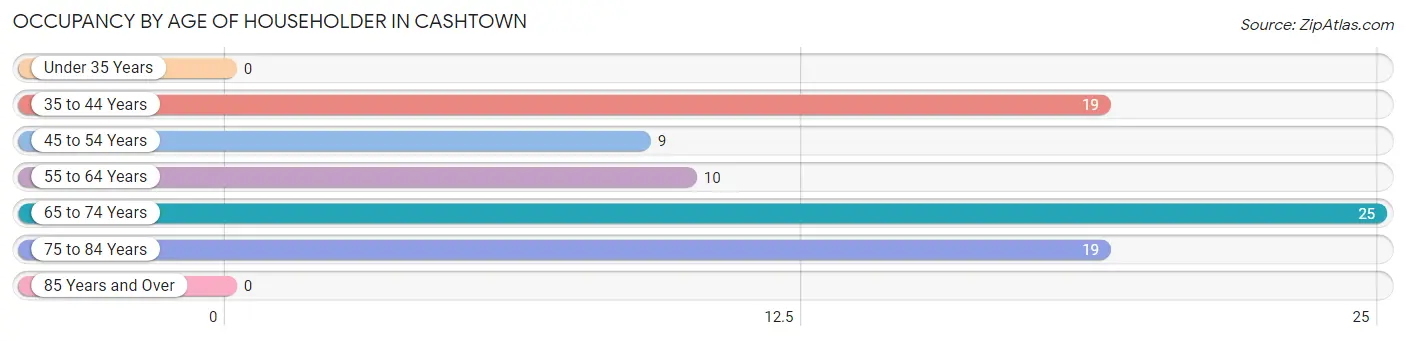
| Age Bracket | # Households | % Households |
| Under 35 Years | 0 | 0.0% |
| 35 to 44 Years | 19 | 23.2% |
| 45 to 54 Years | 9 | 11.0% |
| 55 to 64 Years | 10 | 12.2% |
| 65 to 74 Years | 25 | 30.5% |
| 75 to 84 Years | 19 | 23.2% |
| 85 Years and Over | 0 | 0.0% |
| Total | 82 | 100.0% |
Housing Finances in Cashtown
Median Income by Occupancy in Cashtown
| Occupancy Type | # Households | Median Income |
| Owner-Occupied | 63 (76.8%) | $0 |
| Renter-Occupied | 19 (23.2%) | $0 |
| Average | 82 (100.0%) | $0 |
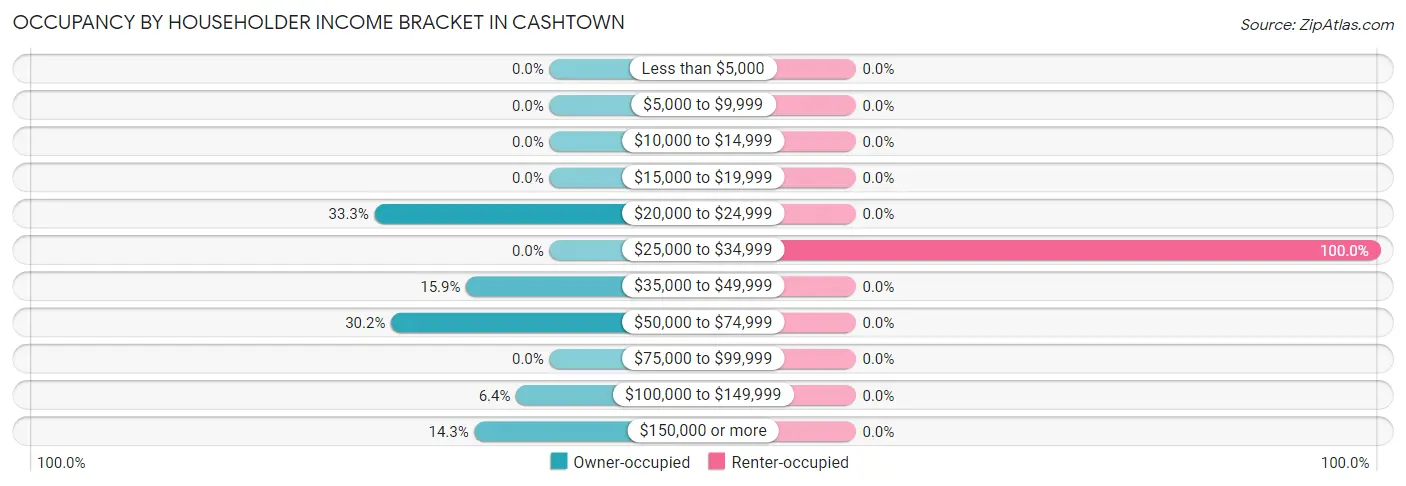
Occupancy by Householder Income Bracket in Cashtown
| Income Bracket | Owner-occupied | Renter-occupied |
| Less than $5,000 | 0 (0.0%) | 0 (0.0%) |
| $5,000 to $9,999 | 0 (0.0%) | 0 (0.0%) |
| $10,000 to $14,999 | 0 (0.0%) | 0 (0.0%) |
| $15,000 to $19,999 | 0 (0.0%) | 0 (0.0%) |
| $20,000 to $24,999 | 21 (33.3%) | 0 (0.0%) |
| $25,000 to $34,999 | 0 (0.0%) | 19 (100.0%) |
| $35,000 to $49,999 | 10 (15.9%) | 0 (0.0%) |
| $50,000 to $74,999 | 19 (30.2%) | 0 (0.0%) |
| $75,000 to $99,999 | 0 (0.0%) | 0 (0.0%) |
| $100,000 to $149,999 | 4 (6.4%) | 0 (0.0%) |
| $150,000 or more | 9 (14.3%) | 0 (0.0%) |
| Total | 63 (100.0%) | 19 (100.0%) |
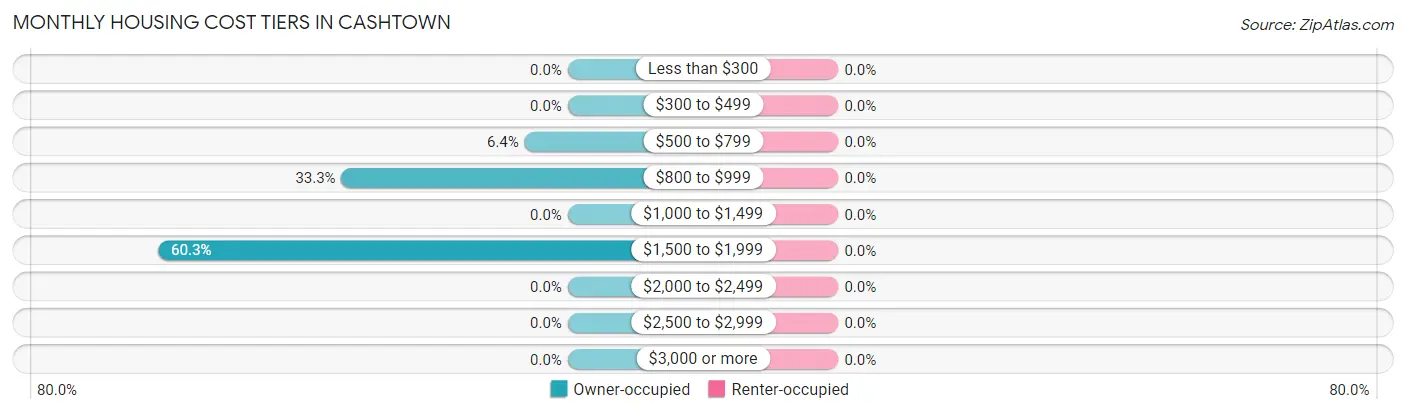
Monthly Housing Cost Tiers in Cashtown
| Monthly Cost | Owner-occupied | Renter-occupied |
| Less than $300 | 0 (0.0%) | 0 (0.0%) |
| $300 to $499 | 0 (0.0%) | 0 (0.0%) |
| $500 to $799 | 4 (6.4%) | 0 (0.0%) |
| $800 to $999 | 21 (33.3%) | 0 (0.0%) |
| $1,000 to $1,499 | 0 (0.0%) | 0 (0.0%) |
| $1,500 to $1,999 | 38 (60.3%) | 0 (0.0%) |
| $2,000 to $2,499 | 0 (0.0%) | 0 (0.0%) |
| $2,500 to $2,999 | 0 (0.0%) | 0 (0.0%) |
| $3,000 or more | 0 (0.0%) | 0 (0.0%) |
| Total | 63 (100.0%) | 19 (100.0%) |
Physical Housing Characteristics in Cashtown
Housing Structures in Cashtown
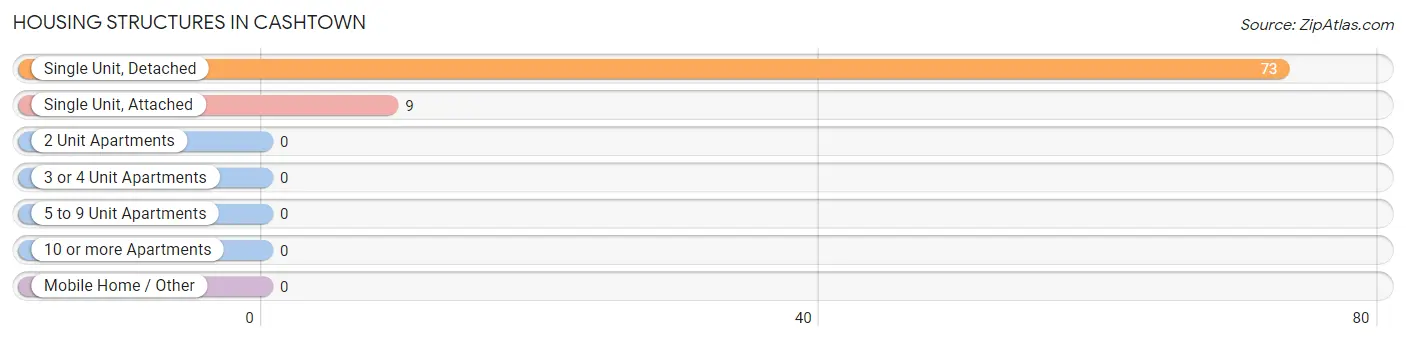
| Structure Type | # Housing Units | % Housing Units |
| Single Unit, Detached | 73 | 89.0% |
| Single Unit, Attached | 9 | 11.0% |
| 2 Unit Apartments | 0 | 0.0% |
| 3 or 4 Unit Apartments | 0 | 0.0% |
| 5 to 9 Unit Apartments | 0 | 0.0% |
| 10 or more Apartments | 0 | 0.0% |
| Mobile Home / Other | 0 | 0.0% |
| Total | 82 | 100.0% |
Housing Structures by Occupancy in Cashtown
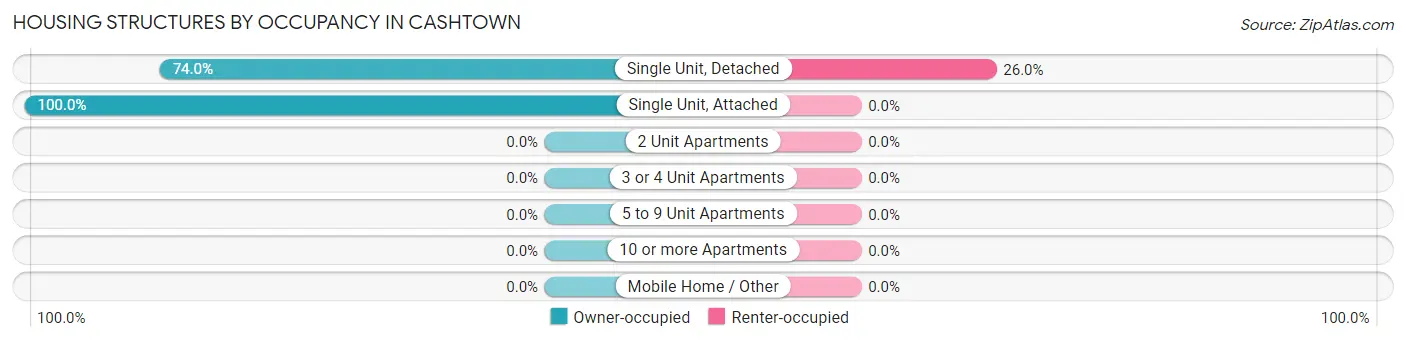
| Structure Type | Owner-occupied | Renter-occupied |
| Single Unit, Detached | 54 (74.0%) | 19 (26.0%) |
| Single Unit, Attached | 9 (100.0%) | 0 (0.0%) |
| 2 Unit Apartments | 0 (0.0%) | 0 (0.0%) |
| 3 or 4 Unit Apartments | 0 (0.0%) | 0 (0.0%) |
| 5 to 9 Unit Apartments | 0 (0.0%) | 0 (0.0%) |
| 10 or more Apartments | 0 (0.0%) | 0 (0.0%) |
| Mobile Home / Other | 0 (0.0%) | 0 (0.0%) |
| Total | 63 (76.8%) | 19 (23.2%) |
Housing Structures by Number of Rooms in Cashtown
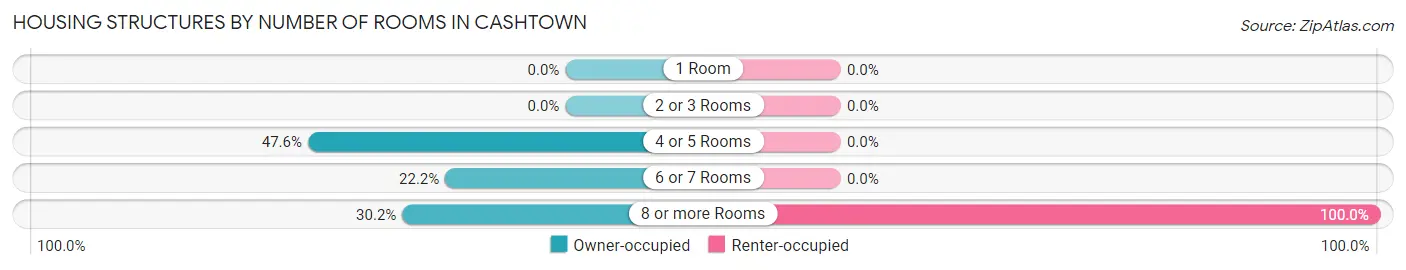
| Number of Rooms | Owner-occupied | Renter-occupied |
| 1 Room | 0 (0.0%) | 0 (0.0%) |
| 2 or 3 Rooms | 0 (0.0%) | 0 (0.0%) |
| 4 or 5 Rooms | 30 (47.6%) | 0 (0.0%) |
| 6 or 7 Rooms | 14 (22.2%) | 0 (0.0%) |
| 8 or more Rooms | 19 (30.2%) | 19 (100.0%) |
| Total | 63 (100.0%) | 19 (100.0%) |
Housing Structure by Heating Type in Cashtown
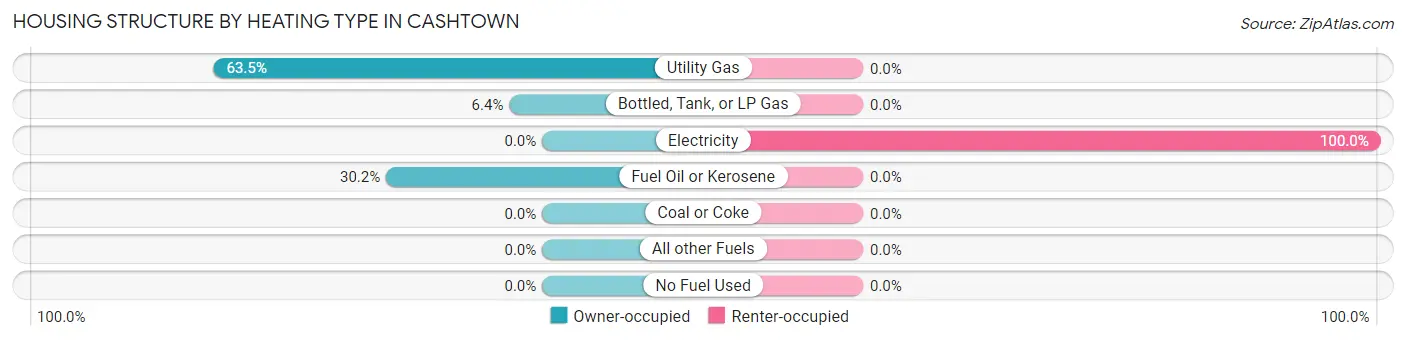
| Heating Type | Owner-occupied | Renter-occupied |
| Utility Gas | 40 (63.5%) | 0 (0.0%) |
| Bottled, Tank, or LP Gas | 4 (6.4%) | 0 (0.0%) |
| Electricity | 0 (0.0%) | 19 (100.0%) |
| Fuel Oil or Kerosene | 19 (30.2%) | 0 (0.0%) |
| Coal or Coke | 0 (0.0%) | 0 (0.0%) |
| All other Fuels | 0 (0.0%) | 0 (0.0%) |
| No Fuel Used | 0 (0.0%) | 0 (0.0%) |
| Total | 63 (100.0%) | 19 (100.0%) |
Household Vehicle Usage in Cashtown
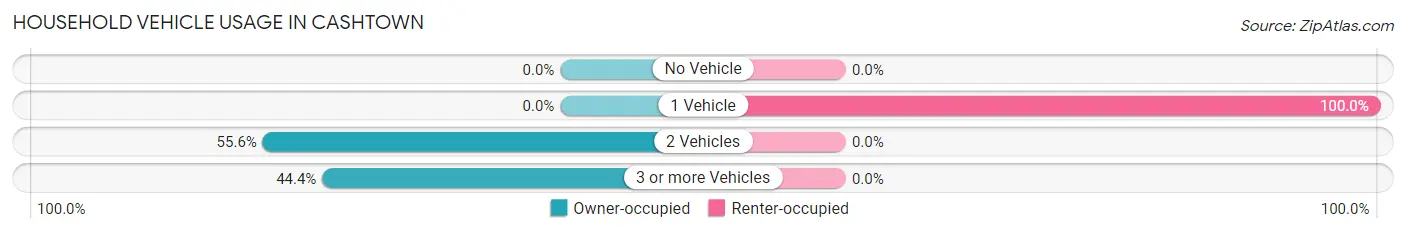
| Vehicles per Household | Owner-occupied | Renter-occupied |
| No Vehicle | 0 (0.0%) | 0 (0.0%) |
| 1 Vehicle | 0 (0.0%) | 19 (100.0%) |
| 2 Vehicles | 35 (55.6%) | 0 (0.0%) |
| 3 or more Vehicles | 28 (44.4%) | 0 (0.0%) |
| Total | 63 (100.0%) | 19 (100.0%) |
Real Estate & Mortgages in Cashtown
Real Estate and Mortgage Overview in Cashtown
| Characteristic | Without Mortgage | With Mortgage |
| Housing Units | 4 | 59 |
| Median Property Value | - | - |
| Median Household Income | - | - |
| Monthly Housing Costs | - | - |
| Real Estate Taxes | - | - |
Property Value by Mortgage Status in Cashtown
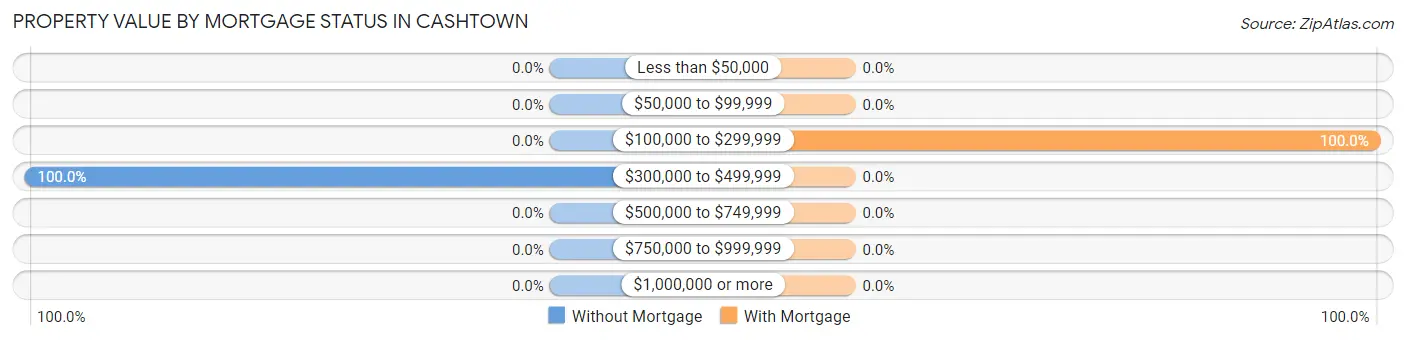
| Property Value | Without Mortgage | With Mortgage |
| Less than $50,000 | 0 (0.0%) | 0 (0.0%) |
| $50,000 to $99,999 | 0 (0.0%) | 0 (0.0%) |
| $100,000 to $299,999 | 0 (0.0%) | 59 (100.0%) |
| $300,000 to $499,999 | 4 (100.0%) | 0 (0.0%) |
| $500,000 to $749,999 | 0 (0.0%) | 0 (0.0%) |
| $750,000 to $999,999 | 0 (0.0%) | 0 (0.0%) |
| $1,000,000 or more | 0 (0.0%) | 0 (0.0%) |
| Total | 4 (100.0%) | 59 (100.0%) |
Household Income by Mortgage Status in Cashtown
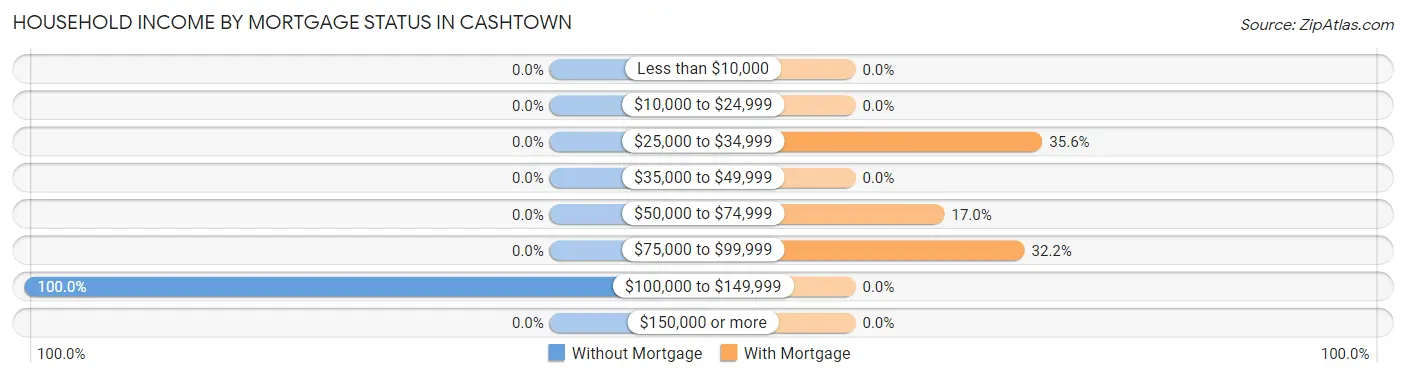
| Household Income | Without Mortgage | With Mortgage |
| Less than $10,000 | 0 (0.0%) | 0 (0.0%) |
| $10,000 to $24,999 | 0 (0.0%) | 0 (0.0%) |
| $25,000 to $34,999 | 0 (0.0%) | 21 (35.6%) |
| $35,000 to $49,999 | 0 (0.0%) | 0 (0.0%) |
| $50,000 to $74,999 | 0 (0.0%) | 10 (17.0%) |
| $75,000 to $99,999 | 0 (0.0%) | 19 (32.2%) |
| $100,000 to $149,999 | 4 (100.0%) | 0 (0.0%) |
| $150,000 or more | 0 (0.0%) | 0 (0.0%) |
| Total | 4 (100.0%) | 59 (100.0%) |
Property Value to Household Income Ratio in Cashtown

| Value-to-Income Ratio | Without Mortgage | With Mortgage |
| Less than 2.0x | 0 (0.0%) | 0 (0.0%) |
| 2.0x to 2.9x | 4 (100.0%) | 9 (15.2%) |
| 3.0x to 3.9x | 0 (0.0%) | 19 (32.2%) |
| 4.0x or more | 0 (0.0%) | 0 (0.0%) |
| Total | 4 (100.0%) | 59 (100.0%) |
Real Estate Taxes by Mortgage Status in Cashtown
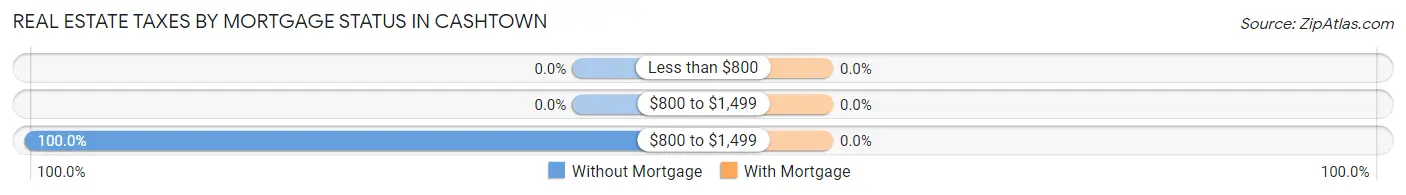
| Property Taxes | Without Mortgage | With Mortgage |
| Less than $800 | 0 (0.0%) | 0 (0.0%) |
| $800 to $1,499 | 0 (0.0%) | 0 (0.0%) |
| $800 to $1,499 | 4 (100.0%) | 0 (0.0%) |
| Total | 4 (100.0%) | 59 (100.0%) |
Health & Disability in Cashtown
Health Insurance Coverage by Age in Cashtown
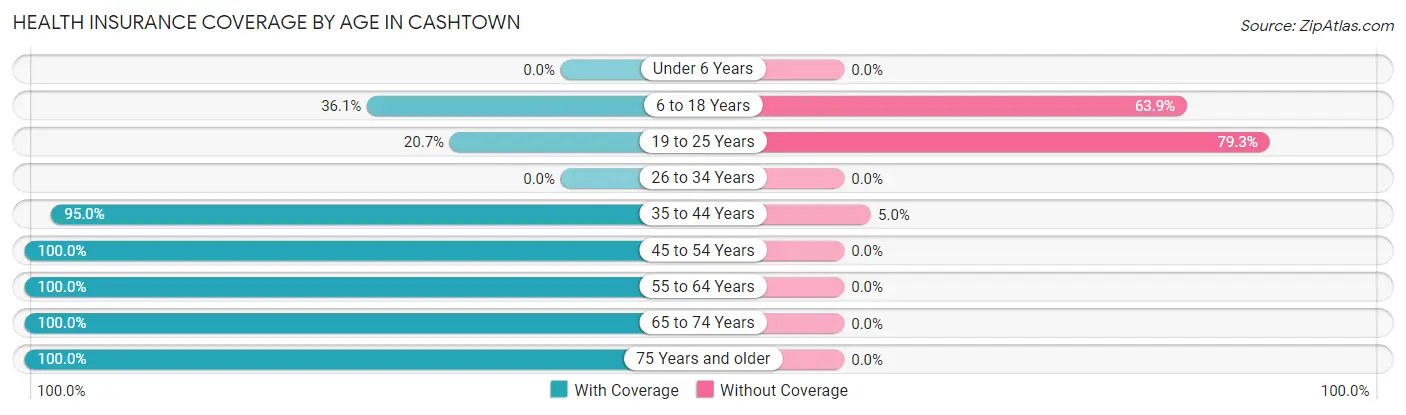
| Age Bracket | With Coverage | Without Coverage |
| Under 6 Years | 0 (0.0%) | 0 (0.0%) |
| 6 to 18 Years | 13 (36.1%) | 23 (63.9%) |
| 19 to 25 Years | 6 (20.7%) | 23 (79.3%) |
| 26 to 34 Years | 0 (0.0%) | 0 (0.0%) |
| 35 to 44 Years | 19 (95.0%) | 1 (5.0%) |
| 45 to 54 Years | 113 (100.0%) | 0 (0.0%) |
| 55 to 64 Years | 35 (100.0%) | 0 (0.0%) |
| 65 to 74 Years | 31 (100.0%) | 0 (0.0%) |
| 75 Years and older | 19 (100.0%) | 0 (0.0%) |
| Total | 236 (83.4%) | 47 (16.6%) |
Health Insurance Coverage by Citizenship Status in Cashtown
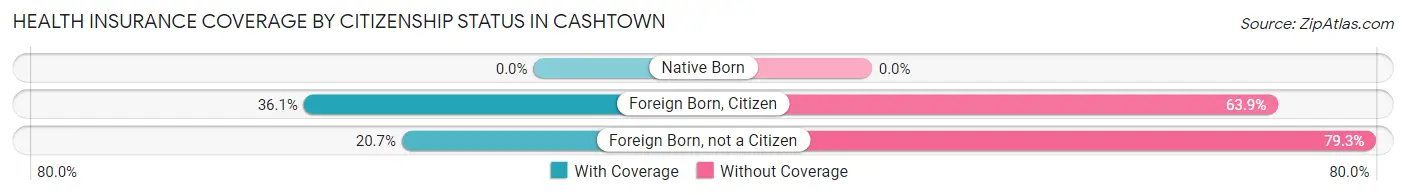
| Citizenship Status | With Coverage | Without Coverage |
| Native Born | 0 (0.0%) | 0 (0.0%) |
| Foreign Born, Citizen | 13 (36.1%) | 23 (63.9%) |
| Foreign Born, not a Citizen | 6 (20.7%) | 23 (79.3%) |
Health Insurance Coverage by Household Income in Cashtown
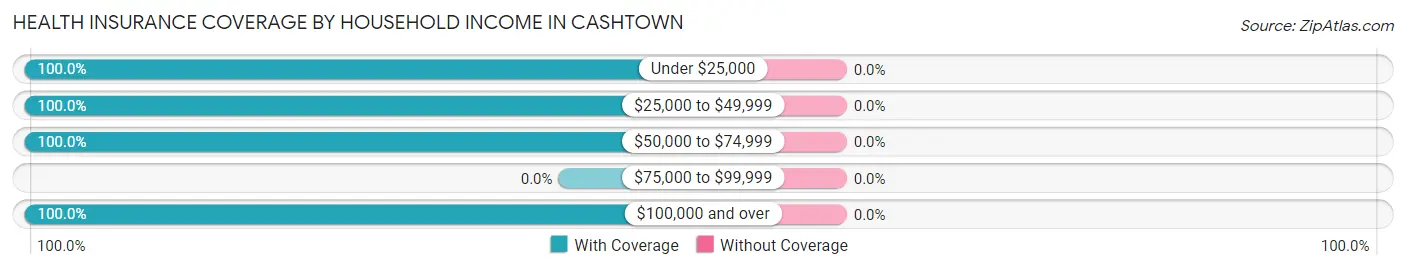
| Household Income | With Coverage | Without Coverage |
| Under $25,000 | 43 (100.0%) | 0 (0.0%) |
| $25,000 to $49,999 | 67 (100.0%) | 0 (0.0%) |
| $50,000 to $74,999 | 36 (100.0%) | 0 (0.0%) |
| $75,000 to $99,999 | 0 (0.0%) | 0 (0.0%) |
| $100,000 and over | 89 (100.0%) | 0 (0.0%) |
Public vs Private Health Insurance Coverage by Age in Cashtown
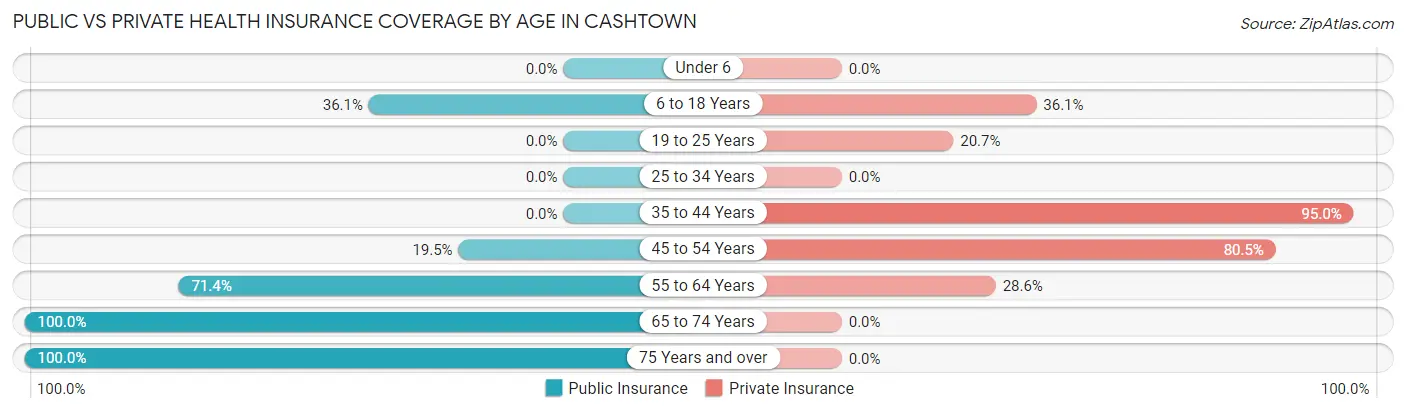
| Age Bracket | Public Insurance | Private Insurance |
| Under 6 | 0 (0.0%) | 0 (0.0%) |
| 6 to 18 Years | 13 (36.1%) | 13 (36.1%) |
| 19 to 25 Years | 0 (0.0%) | 6 (20.7%) |
| 25 to 34 Years | 0 (0.0%) | 0 (0.0%) |
| 35 to 44 Years | 0 (0.0%) | 19 (95.0%) |
| 45 to 54 Years | 22 (19.5%) | 91 (80.5%) |
| 55 to 64 Years | 25 (71.4%) | 10 (28.6%) |
| 65 to 74 Years | 31 (100.0%) | 0 (0.0%) |
| 75 Years and over | 19 (100.0%) | 0 (0.0%) |
| Total | 110 (38.9%) | 139 (49.1%) |
Disability Status by Sex by Age in Cashtown
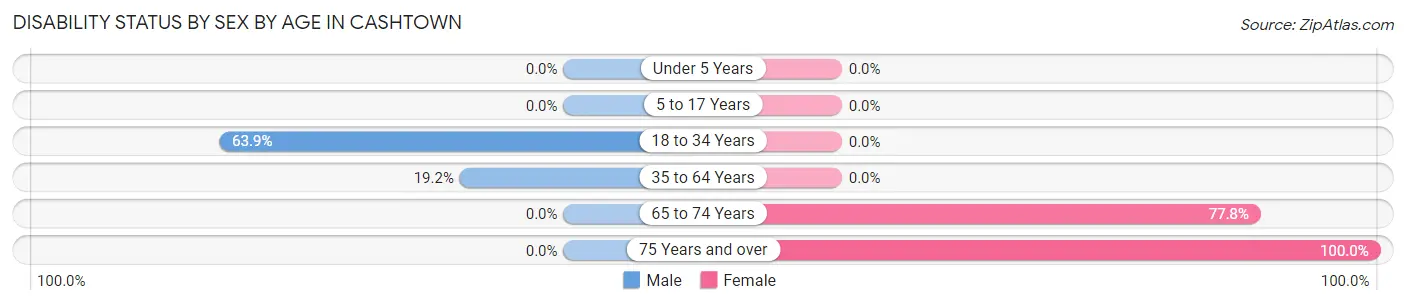
| Age Bracket | Male | Female |
| Under 5 Years | 0 (0.0%) | 0 (0.0%) |
| 5 to 17 Years | 0 (0.0%) | 0 (0.0%) |
| 18 to 34 Years | 23 (63.9%) | 0 (0.0%) |
| 35 to 64 Years | 25 (19.2%) | 0 (0.0%) |
| 65 to 74 Years | 0 (0.0%) | 21 (77.8%) |
| 75 Years and over | 0 (0.0%) | 19 (100.0%) |
Disability Class by Sex by Age in Cashtown
Disability Class: Hearing Difficulty
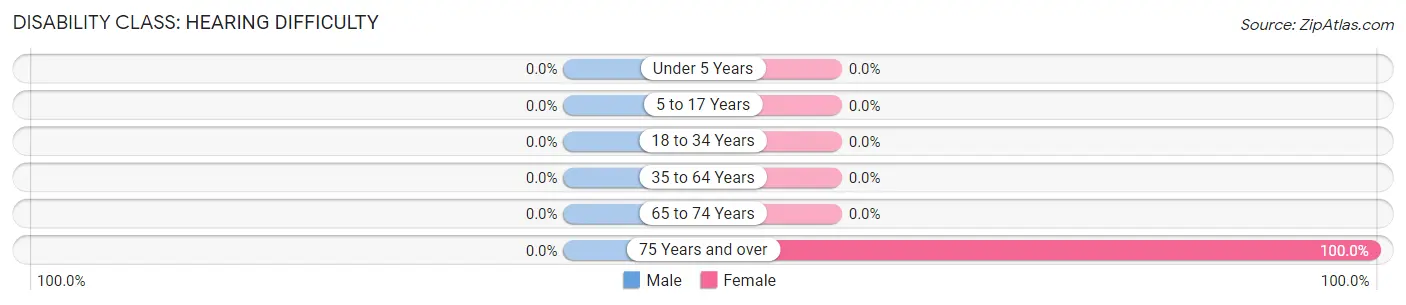
| Age Bracket | Male | Female |
| Under 5 Years | 0 (0.0%) | 0 (0.0%) |
| 5 to 17 Years | 0 (0.0%) | 0 (0.0%) |
| 18 to 34 Years | 0 (0.0%) | 0 (0.0%) |
| 35 to 64 Years | 0 (0.0%) | 0 (0.0%) |
| 65 to 74 Years | 0 (0.0%) | 0 (0.0%) |
| 75 Years and over | 0 (0.0%) | 19 (100.0%) |
Disability Class: Vision Difficulty
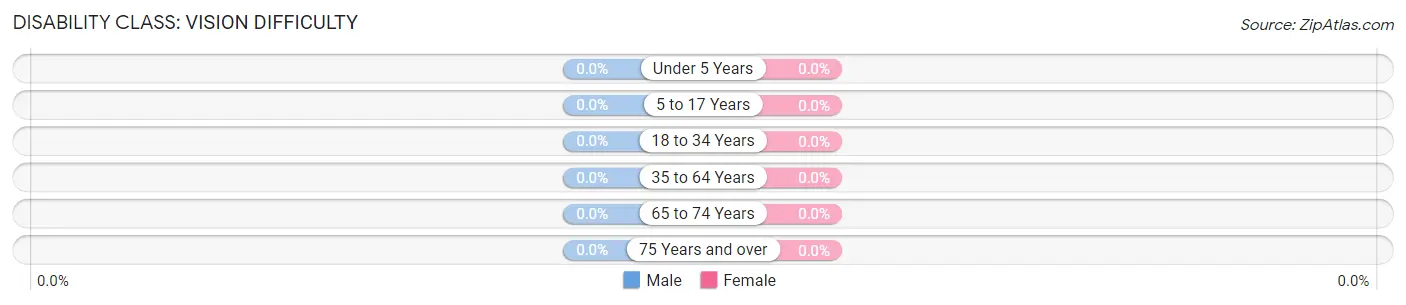
| Age Bracket | Male | Female |
| Under 5 Years | 0 (0.0%) | 0 (0.0%) |
| 5 to 17 Years | 0 (0.0%) | 0 (0.0%) |
| 18 to 34 Years | 0 (0.0%) | 0 (0.0%) |
| 35 to 64 Years | 0 (0.0%) | 0 (0.0%) |
| 65 to 74 Years | 0 (0.0%) | 0 (0.0%) |
| 75 Years and over | 0 (0.0%) | 0 (0.0%) |
Disability Class: Cognitive Difficulty
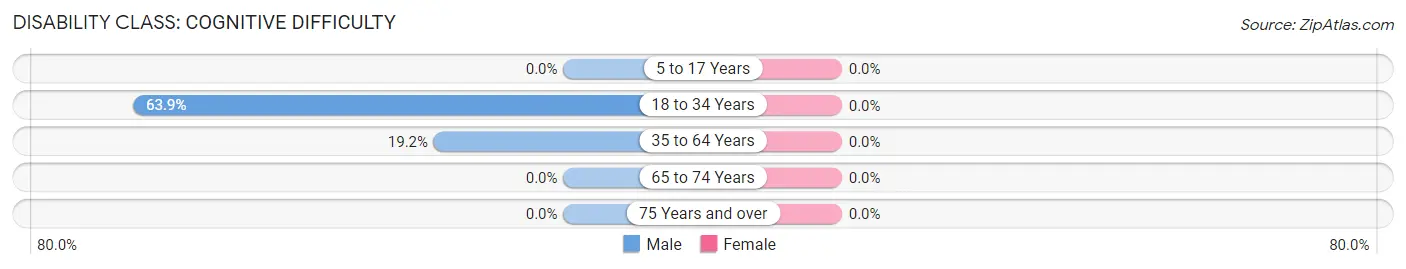
| Age Bracket | Male | Female |
| 5 to 17 Years | 0 (0.0%) | 0 (0.0%) |
| 18 to 34 Years | 23 (63.9%) | 0 (0.0%) |
| 35 to 64 Years | 25 (19.2%) | 0 (0.0%) |
| 65 to 74 Years | 0 (0.0%) | 0 (0.0%) |
| 75 Years and over | 0 (0.0%) | 0 (0.0%) |
Disability Class: Ambulatory Difficulty
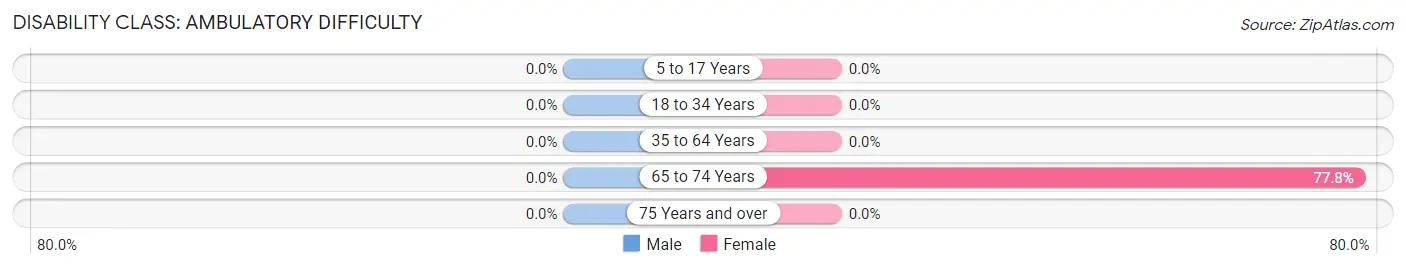
| Age Bracket | Male | Female |
| 5 to 17 Years | 0 (0.0%) | 0 (0.0%) |
| 18 to 34 Years | 0 (0.0%) | 0 (0.0%) |
| 35 to 64 Years | 0 (0.0%) | 0 (0.0%) |
| 65 to 74 Years | 0 (0.0%) | 21 (77.8%) |
| 75 Years and over | 0 (0.0%) | 0 (0.0%) |
Disability Class: Self-Care Difficulty
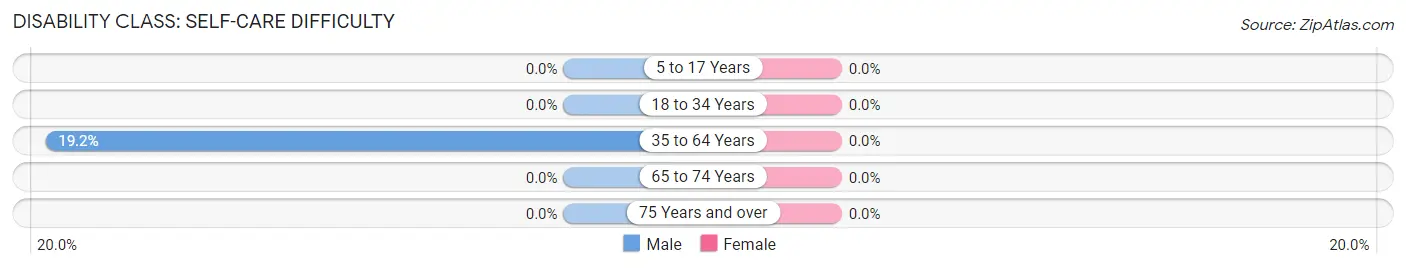
| Age Bracket | Male | Female |
| 5 to 17 Years | 0 (0.0%) | 0 (0.0%) |
| 18 to 34 Years | 0 (0.0%) | 0 (0.0%) |
| 35 to 64 Years | 25 (19.2%) | 0 (0.0%) |
| 65 to 74 Years | 0 (0.0%) | 0 (0.0%) |
| 75 Years and over | 0 (0.0%) | 0 (0.0%) |
Technology Access in Cashtown
Computing Device Access in Cashtown
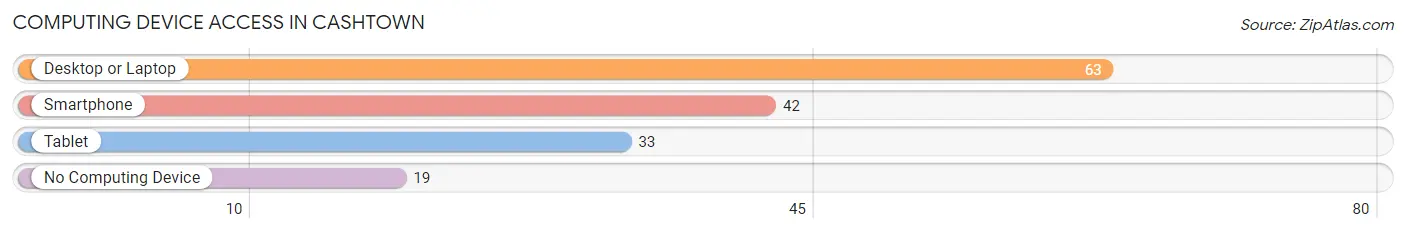
| Device Type | # Households | % Households |
| Desktop or Laptop | 63 | 76.8% |
| Smartphone | 42 | 51.2% |
| Tablet | 33 | 40.2% |
| No Computing Device | 19 | 23.2% |
| Total | 82 | 100.0% |
Internet Access in Cashtown
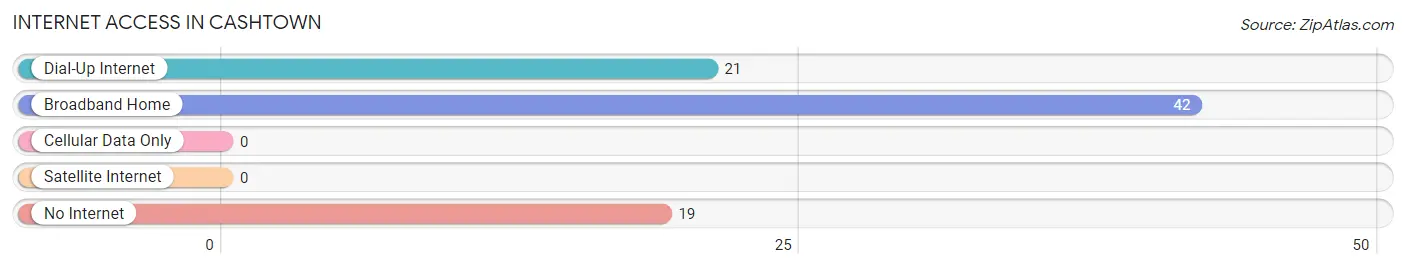
| Internet Type | # Households | % Households |
| Dial-Up Internet | 21 | 25.6% |
| Broadband Home | 42 | 51.2% |
| Cellular Data Only | 0 | 0.0% |
| Satellite Internet | 0 | 0.0% |
| No Internet | 19 | 23.2% |
| Total | 82 | 100.0% |
Cashtown Summary
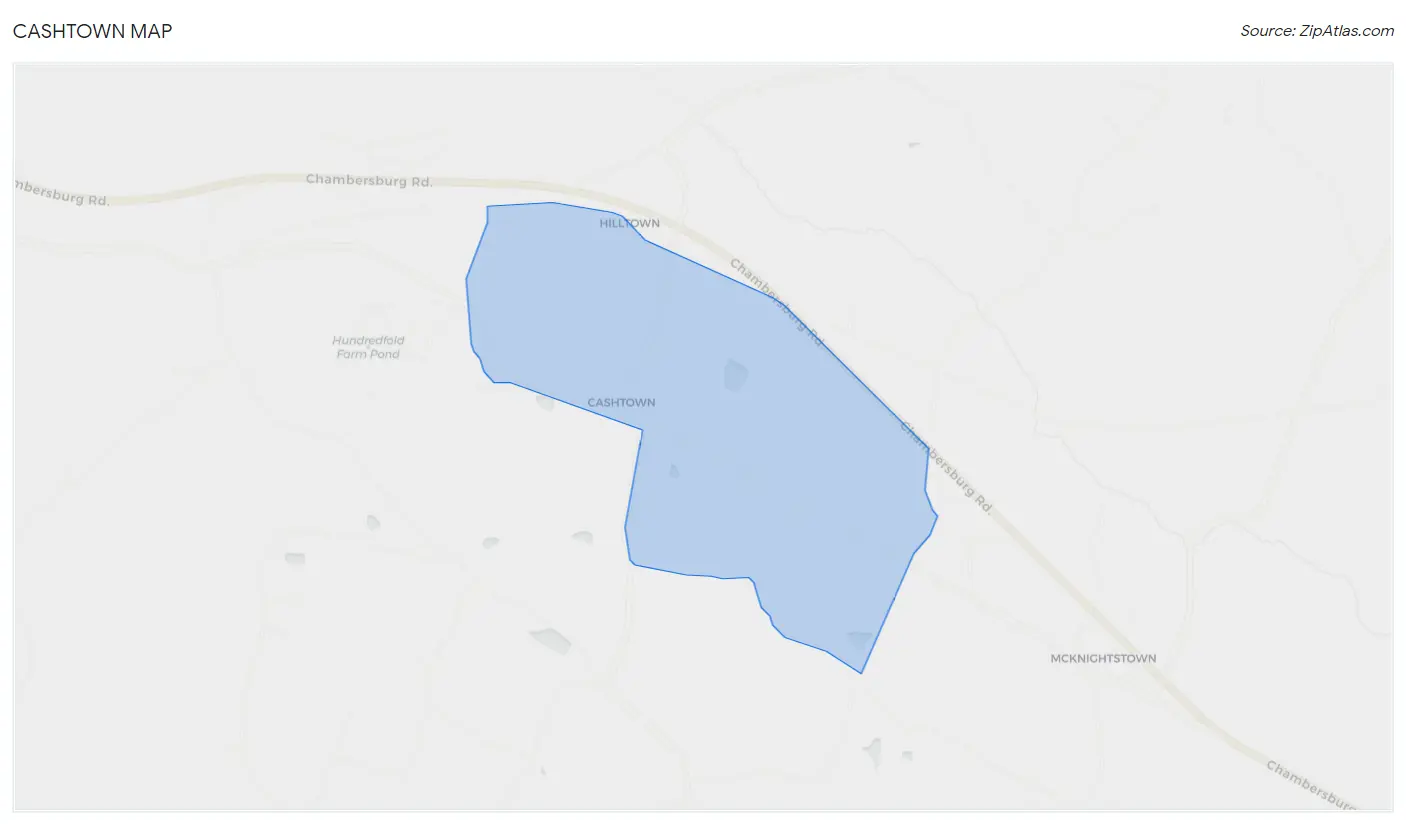
Town History
Cashtown is a small unincorporated community located in Adams County, Pennsylvania. It is situated in the Cumberland Valley, approximately five miles west of Gettysburg. The town was founded in 1797 by John Cash, a local landowner, and was originally known as Cash’s Town. The town was later renamed Cashtown in 1817.
The town was a popular stop for travelers on the Chambersburg-Gettysburg Turnpike, which was built in 1815. The turnpike was a major route for travelers and goods between the two towns. Cashtown was also a popular stop for stagecoaches and freight wagons.
During the Civil War, Cashtown was the site of a skirmish between Confederate and Union forces on June 26, 1863. The skirmish was part of the Gettysburg Campaign and resulted in a Confederate victory.
Geography
Cashtown is located in Adams County, Pennsylvania, in the Cumberland Valley. The town is situated approximately five miles west of Gettysburg and is bordered by the towns of Arendtsville to the north, Biglerville to the east, and Fairfield to the south.
The town is situated at an elevation of 590 feet above sea level and covers an area of 0.6 square miles. The town is located in a rural area and is surrounded by farmland and woodlands. The town is located near the Appalachian Trail and is a popular destination for hikers and outdoor enthusiasts.
Economy
The economy of Cashtown is largely based on agriculture and tourism. The town is home to several small businesses, including a general store, a restaurant, and a bed and breakfast. The town is also home to several farms, which produce a variety of crops, including corn, soybeans, and hay.
The town is also a popular destination for tourists, who come to visit the nearby Gettysburg National Military Park and the Appalachian Trail. The town is also home to several historic sites, including the Cashtown Inn, which was built in 1797 and is listed on the National Register of Historic Places.
Demographics
As of the 2010 census, the population of Cashtown was 545. The population is largely white (97.3%) and the median age is 43. The median household income is $50,000 and the median home value is $170,000.
The town is served by the Cashtown-McKnightstown School District, which consists of one elementary school and one middle school. The town is also home to several churches, including the Cashtown United Methodist Church, the Cashtown Presbyterian Church, and the Cashtown Baptist Church.
Conclusion
Cashtown is a small unincorporated community located in Adams County, Pennsylvania. The town was founded in 1797 and was a popular stop for travelers on the Chambersburg-Gettysburg Turnpike. During the Civil War, the town was the site of a skirmish between Confederate and Union forces. The economy of Cashtown is largely based on agriculture and tourism. The population of the town is largely white and the median age is 43. The town is served by the Cashtown-McKnightstown School District and is home to several churches.
Common Questions
What is Per Capita Income in Cashtown?
Per Capita income in Cashtown is $32,731.
What is Income or Wage Gap in Cashtown?
Income or Wage Gap in Cashtown is 20.6%.
Women in Cashtown earn 79.4 cents for every dollar earned by a man.
What is Inequality or Gini Index in Cashtown?
Inequality or Gini Index in Cashtown is 0.40.
What is the Total Population of Cashtown?
Total Population of Cashtown is 283.
What is the Total Male Population of Cashtown?
Total Male Population of Cashtown is 170.
What is the Total Female Population of Cashtown?
Total Female Population of Cashtown is 113.
What is the Ratio of Males per 100 Females in Cashtown?
There are 150.44 Males per 100 Females in Cashtown.
What is the Ratio of Females per 100 Males in Cashtown?
There are 66.47 Females per 100 Males in Cashtown.
What is the Median Population Age in Cashtown?
Median Population Age in Cashtown is 50.1 Years.
What is the Average Family Size in Cashtown
Average Family Size in Cashtown is 2.9 People.
What is the Average Household Size in Cashtown
Average Household Size in Cashtown is 2.9 People.
How Large is the Labor Force in Cashtown?
There are 127 People in the Labor Forcein in Cashtown.
What is the Percentage of People in the Labor Force in Cashtown?
44.9% of People are in the Labor Force in Cashtown.