Zip Codes with the Highest Percentage of Population Employed in Architecture & Engineering in Kent, OH
RELATED REPORTS & OPTIONS
Architecture & Engineering
Kent
Compare Zip Codes
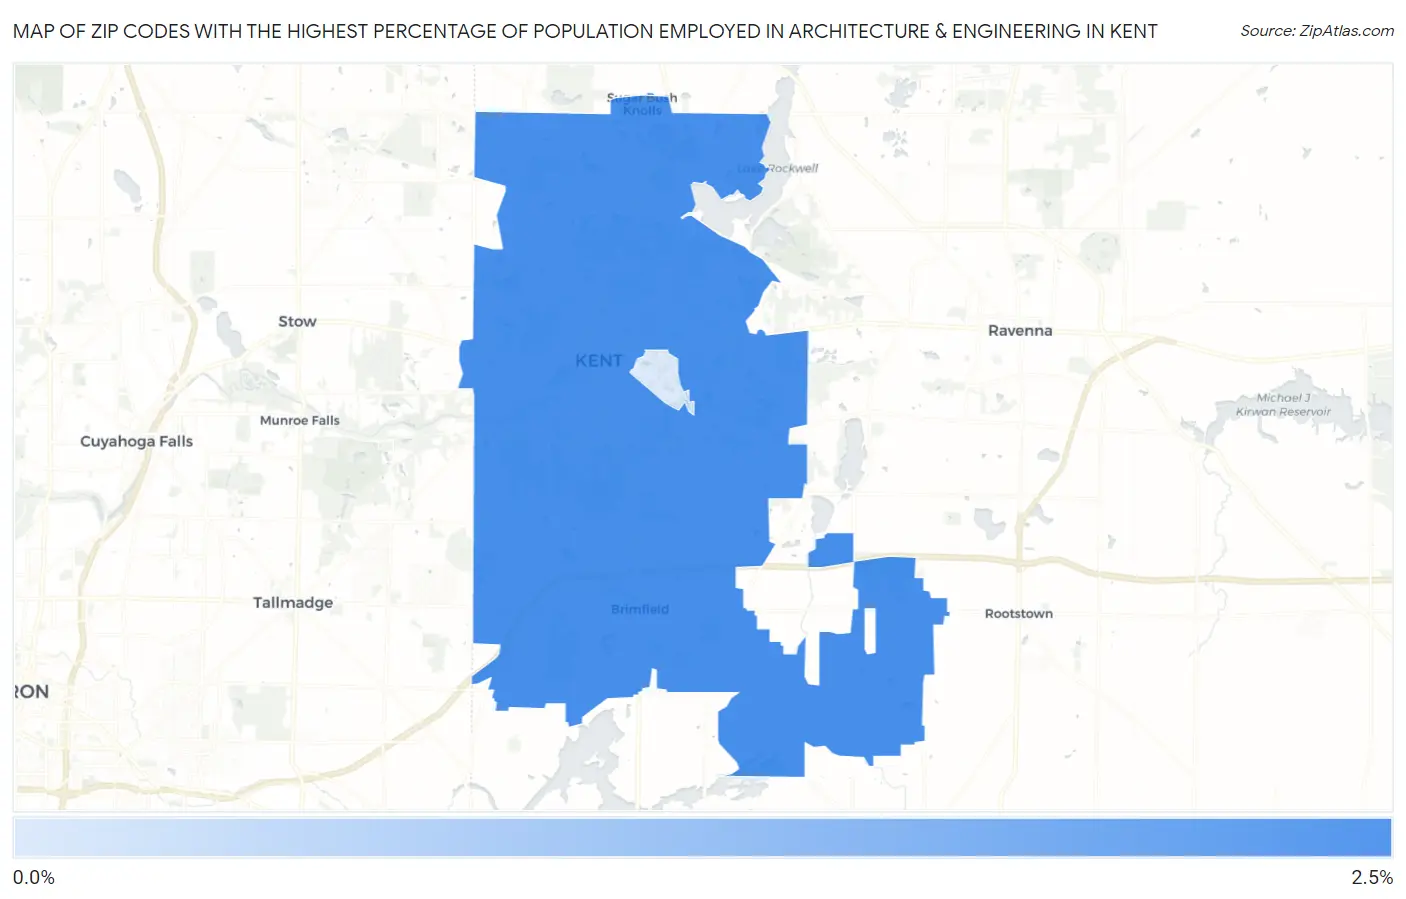
Map of Zip Codes with the Highest Percentage of Population Employed in Architecture & Engineering in Kent
0.085%
2.2%
Zip Codes with the Highest Percentage of Population Employed in Architecture & Engineering in Kent, OH
| Zip Code | % Employed | vs State | vs National | |
| 1. | 44240 | 2.2% | 2.1%(+0.086)#370 | 2.1%(+0.070)#8,379 |
| 2. | 44243 | 0.085% | 2.1%(-2.05)#929 | 2.1%(-2.06)#22,411 |
1
Common Questions
What are the Top Zip Codes with the Highest Percentage of Population Employed in Architecture & Engineering in Kent, OH?
Top Zip Codes with the Highest Percentage of Population Employed in Architecture & Engineering in Kent, OH are:
What zip code has the Highest Percentage of Population Employed in Architecture & Engineering in Kent, OH?
44240 has the Highest Percentage of Population Employed in Architecture & Engineering in Kent, OH with 2.2%.
What is the Percentage of Population Employed in Architecture & Engineering in Kent, OH?
Percentage of Population Employed in Architecture & Engineering in Kent is 1.8%.
What is the Percentage of Population Employed in Architecture & Engineering in Ohio?
Percentage of Population Employed in Architecture & Engineering in Ohio is 2.1%.
What is the Percentage of Population Employed in Architecture & Engineering in the United States?
Percentage of Population Employed in Architecture & Engineering in the United States is 2.1%.