Zip Codes with the Highest Percentage of Population Employed in Architecture & Engineering in Bowling Green, OH
RELATED REPORTS & OPTIONS
Architecture & Engineering
Bowling Green
Compare Zip Codes
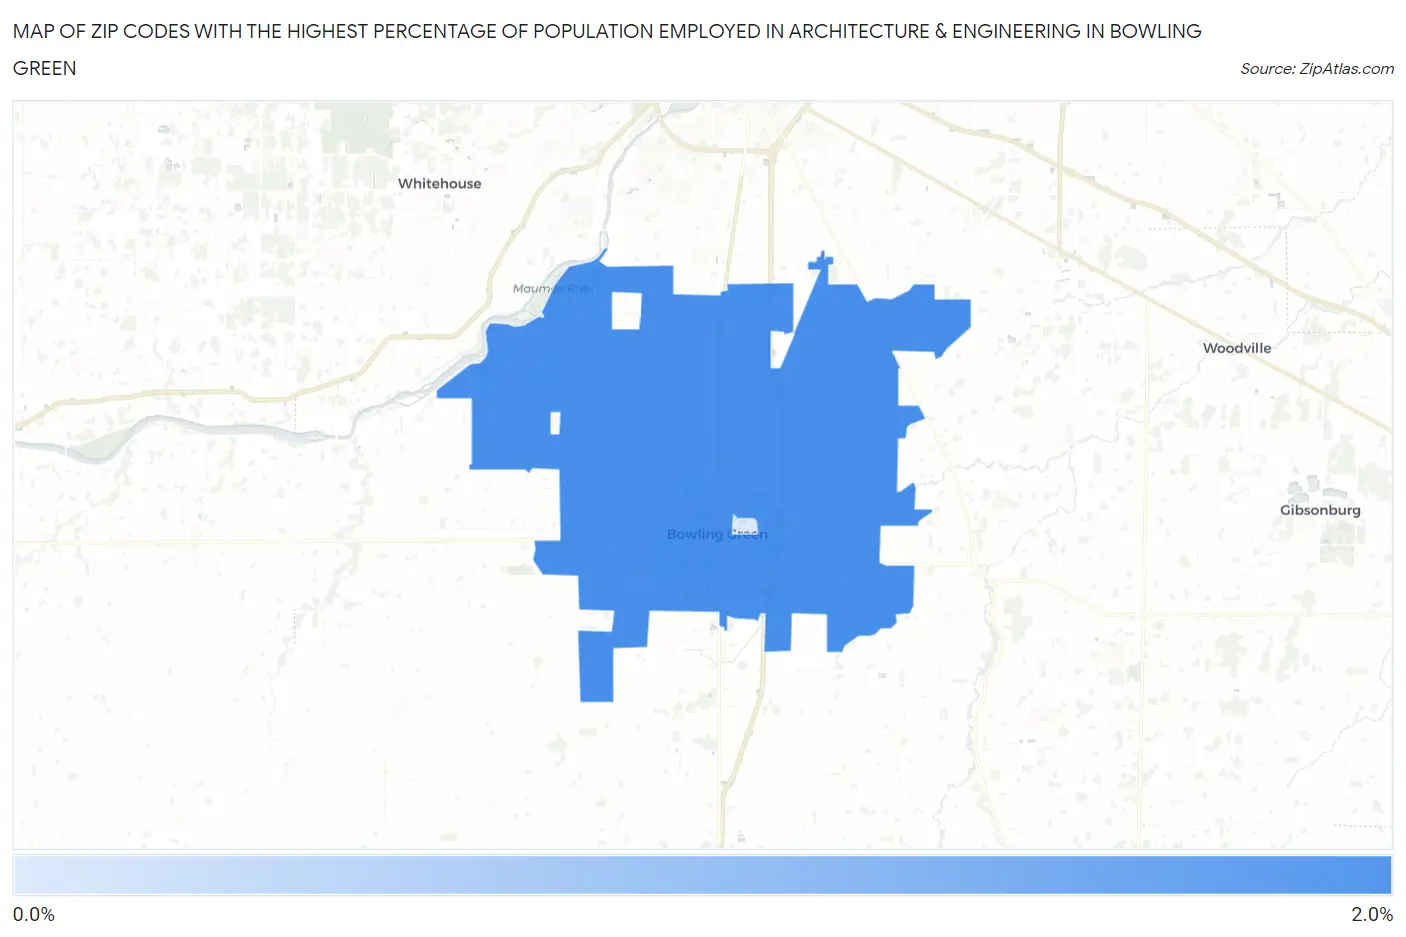
Map of Zip Codes with the Highest Percentage of Population Employed in Architecture & Engineering in Bowling Green
0.70%
1.9%
Zip Codes with the Highest Percentage of Population Employed in Architecture & Engineering in Bowling Green, OH
| Zip Code | % Employed | vs State | vs National | |
| 1. | 43402 | 1.9% | 2.1%(-0.185)#438 | 2.1%(-0.200)#9,919 |
| 2. | 43403 | 0.70% | 2.1%(-1.43)#788 | 2.1%(-1.45)#18,870 |
1
Common Questions
What are the Top Zip Codes with the Highest Percentage of Population Employed in Architecture & Engineering in Bowling Green, OH?
Top Zip Codes with the Highest Percentage of Population Employed in Architecture & Engineering in Bowling Green, OH are:
What zip code has the Highest Percentage of Population Employed in Architecture & Engineering in Bowling Green, OH?
43402 has the Highest Percentage of Population Employed in Architecture & Engineering in Bowling Green, OH with 1.9%.
What is the Percentage of Population Employed in Architecture & Engineering in Bowling Green, OH?
Percentage of Population Employed in Architecture & Engineering in Bowling Green is 1.5%.
What is the Percentage of Population Employed in Architecture & Engineering in Ohio?
Percentage of Population Employed in Architecture & Engineering in Ohio is 2.1%.
What is the Percentage of Population Employed in Architecture & Engineering in the United States?
Percentage of Population Employed in Architecture & Engineering in the United States is 2.1%.