Zip Codes with the Highest Percentage of Population Employed in Architecture & Engineering in Mansfield, OH
RELATED REPORTS & OPTIONS
Architecture & Engineering
Mansfield
Compare Zip Codes
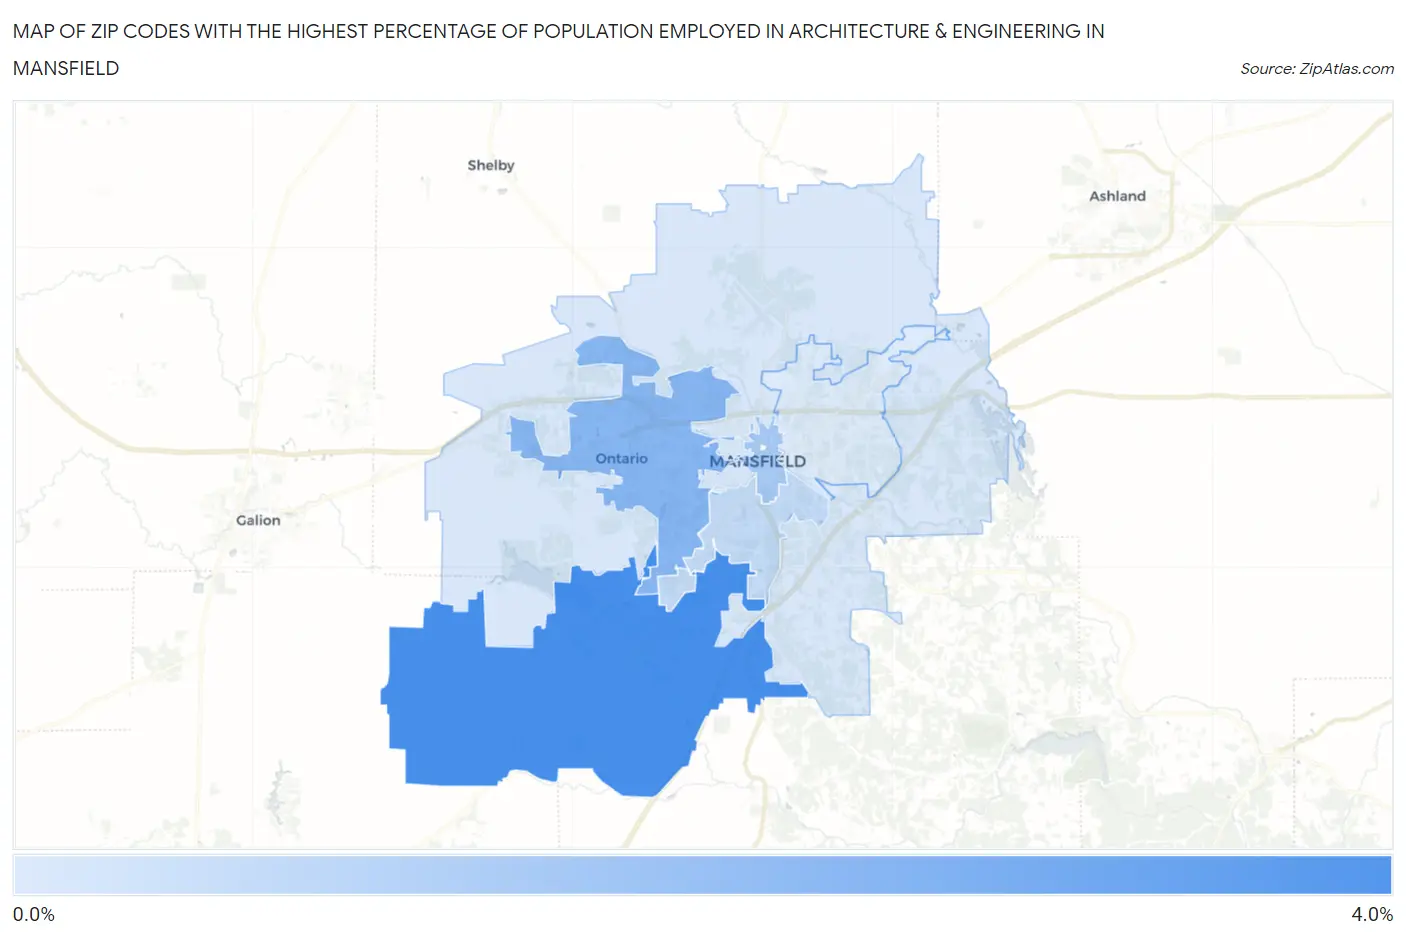
Map of Zip Codes with the Highest Percentage of Population Employed in Architecture & Engineering in Mansfield
0.76%
3.0%
Zip Codes with the Highest Percentage of Population Employed in Architecture & Engineering in Mansfield, OH
| Zip Code | % Employed | vs State | vs National | |
| 1. | 44904 | 3.0% | 2.1%(+0.916)#206 | 2.1%(+0.900)#4,891 |
| 2. | 44906 | 2.1% | 2.1%(-0.081)#409 | 2.1%(-0.097)#9,307 |
| 3. | 44902 | 1.6% | 2.1%(-0.558)#528 | 2.1%(-0.573)#12,333 |
| 4. | 44907 | 1.1% | 2.1%(-1.00)#671 | 2.1%(-1.02)#15,593 |
| 5. | 44903 | 0.82% | 2.1%(-1.31)#757 | 2.1%(-1.33)#17,995 |
| 6. | 44905 | 0.76% | 2.1%(-1.37)#772 | 2.1%(-1.39)#18,427 |
1
Common Questions
What are the Top 5 Zip Codes with the Highest Percentage of Population Employed in Architecture & Engineering in Mansfield, OH?
Top 5 Zip Codes with the Highest Percentage of Population Employed in Architecture & Engineering in Mansfield, OH are:
What zip code has the Highest Percentage of Population Employed in Architecture & Engineering in Mansfield, OH?
44904 has the Highest Percentage of Population Employed in Architecture & Engineering in Mansfield, OH with 3.0%.
What is the Percentage of Population Employed in Architecture & Engineering in Mansfield, OH?
Percentage of Population Employed in Architecture & Engineering in Mansfield is 1.2%.
What is the Percentage of Population Employed in Architecture & Engineering in Ohio?
Percentage of Population Employed in Architecture & Engineering in Ohio is 2.1%.
What is the Percentage of Population Employed in Architecture & Engineering in the United States?
Percentage of Population Employed in Architecture & Engineering in the United States is 2.1%.