Zip Codes with the Highest Percentage of Population Employed in Architecture & Engineering in Warren, OH
RELATED REPORTS & OPTIONS
Architecture & Engineering
Warren
Compare Zip Codes
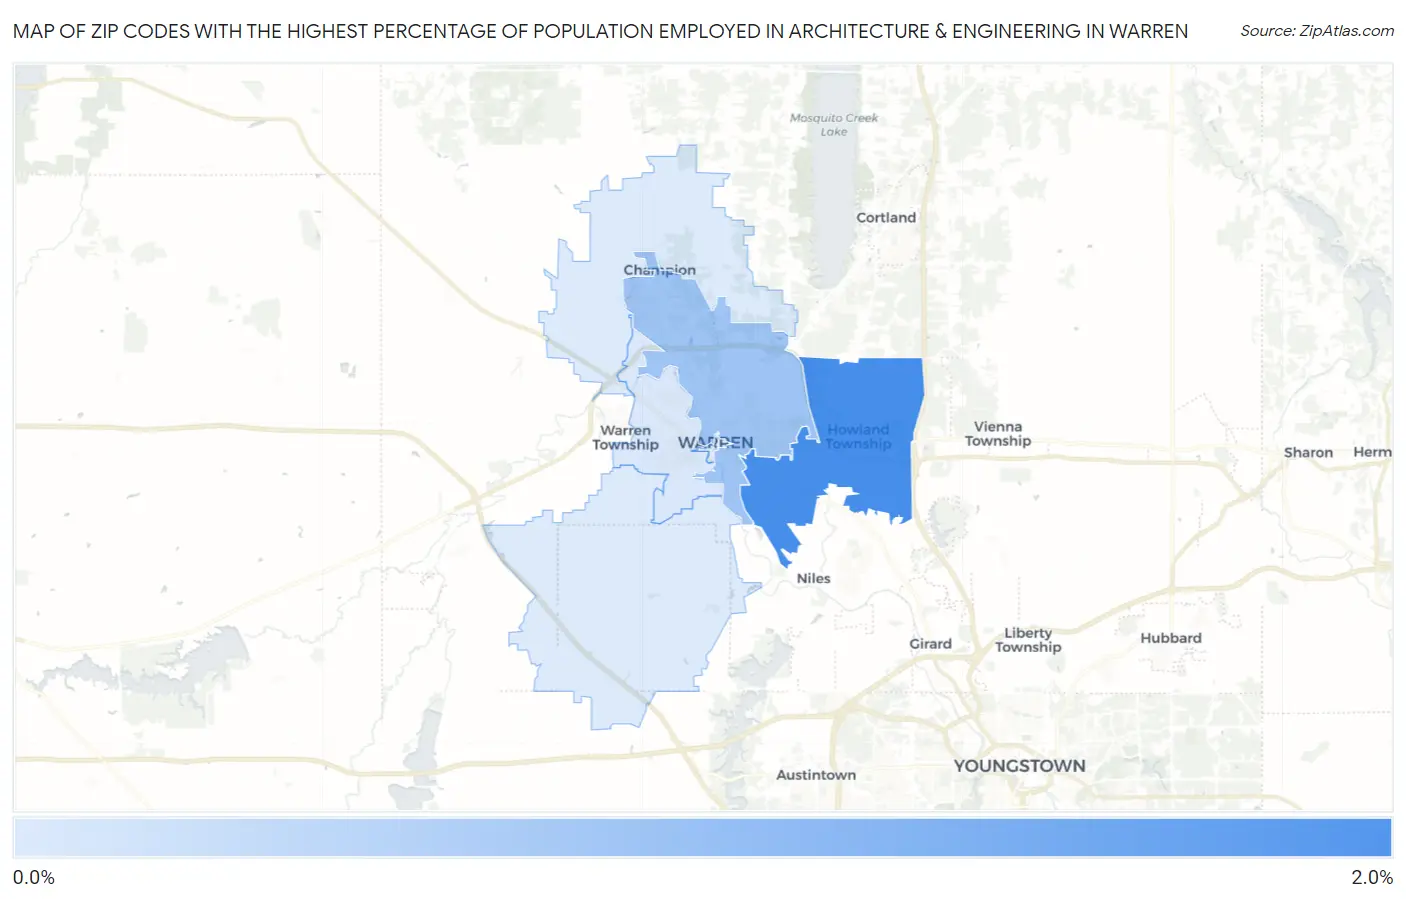
Map of Zip Codes with the Highest Percentage of Population Employed in Architecture & Engineering in Warren
0.16%
1.6%
Zip Codes with the Highest Percentage of Population Employed in Architecture & Engineering in Warren, OH
| Zip Code | % Employed | vs State | vs National | |
| 1. | 44484 | 1.6% | 2.1%(-0.526)#520 | 2.1%(-0.542)#12,142 |
| 2. | 44483 | 0.76% | 2.1%(-1.37)#774 | 2.1%(-1.39)#18,442 |
| 3. | 44485 | 0.19% | 2.1%(-1.95)#911 | 2.1%(-1.96)#22,108 |
| 4. | 44481 | 0.16% | 2.1%(-1.98)#919 | 2.1%(-1.99)#22,238 |
1
Common Questions
What are the Top 3 Zip Codes with the Highest Percentage of Population Employed in Architecture & Engineering in Warren, OH?
Top 3 Zip Codes with the Highest Percentage of Population Employed in Architecture & Engineering in Warren, OH are:
What zip code has the Highest Percentage of Population Employed in Architecture & Engineering in Warren, OH?
44484 has the Highest Percentage of Population Employed in Architecture & Engineering in Warren, OH with 1.6%.
What is the Percentage of Population Employed in Architecture & Engineering in Warren, OH?
Percentage of Population Employed in Architecture & Engineering in Warren is 0.57%.
What is the Percentage of Population Employed in Architecture & Engineering in Ohio?
Percentage of Population Employed in Architecture & Engineering in Ohio is 2.1%.
What is the Percentage of Population Employed in Architecture & Engineering in the United States?
Percentage of Population Employed in Architecture & Engineering in the United States is 2.1%.