Zip Codes with the Highest Percentage of Households with Income Below $10,000 in Rochester, NH
RELATED REPORTS & OPTIONS
Household Income | $0-10k
Rochester
Compare Zip Codes
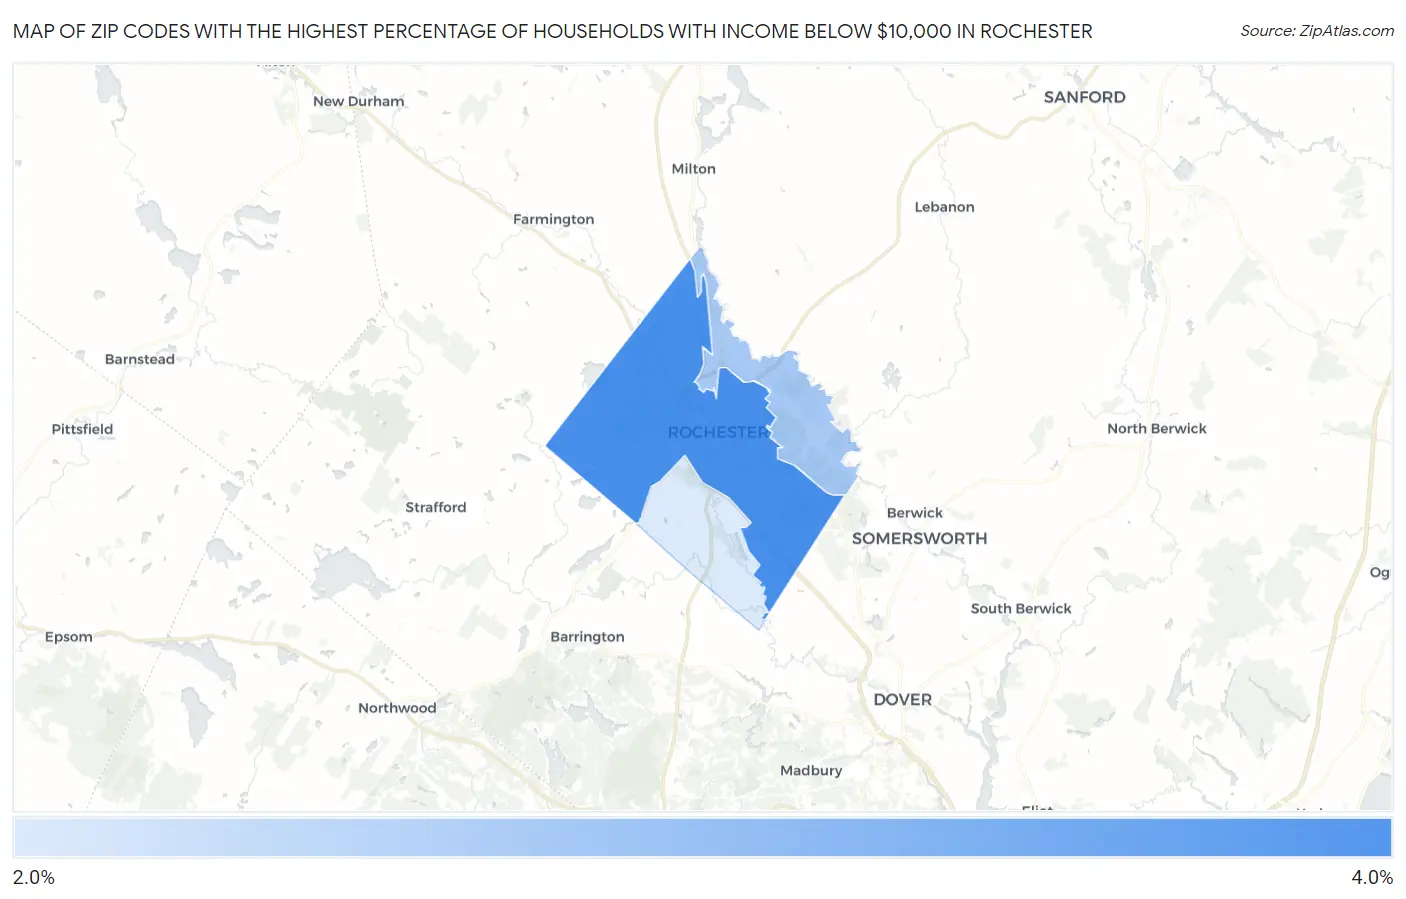
Map of Zip Codes with the Highest Percentage of Households with Income Below $10,000 in Rochester
2.3%
3.4%
Zip Codes with the Highest Percentage of Households with Income Below $10,000 in Rochester, NH
| Zip Code | Households with Income < $10k | vs State | vs National | |
| 1. | 03867 | 3.4% | 2.9%(+0.500)#78 | 4.9%(-1.50)#17,707 |
| 2. | 03868 | 2.7% | 2.9%(-0.200)#105 | 4.9%(-2.20)#20,834 |
| 3. | 03839 | 2.3% | 2.9%(-0.600)#121 | 4.9%(-2.60)#22,620 |
1
Common Questions
What are the Top Zip Codes with the Highest Percentage of Households with Income Below $10,000 in Rochester, NH?
Top Zip Codes with the Highest Percentage of Households with Income Below $10,000 in Rochester, NH are:
What zip code has the Highest Percentage of Households with Income Below $10,000 in Rochester, NH?
03867 has the Highest Percentage of Households with Income Below $10,000 in Rochester, NH with 3.4%.
What is the Percentage of Households with Income Below $10,000 in Rochester, NH?
Percentage of Households with Income Below $10,000 in Rochester is 3.2%.
What is the Percentage of Households with Income Below $10,000 in New Hampshire?
Percentage of Households with Income Below $10,000 in New Hampshire is 2.9%.
What is the Percentage of Households with Income Below $10,000 in the United States?
Percentage of Households with Income Below $10,000 in the United States is 4.9%.