Zip Codes with the Highest Percentage of Population with a Degree in Liberal Arts and History in Rochester, NH
RELATED REPORTS & OPTIONS
Liberal Arts and History
Rochester
Compare Zip Codes
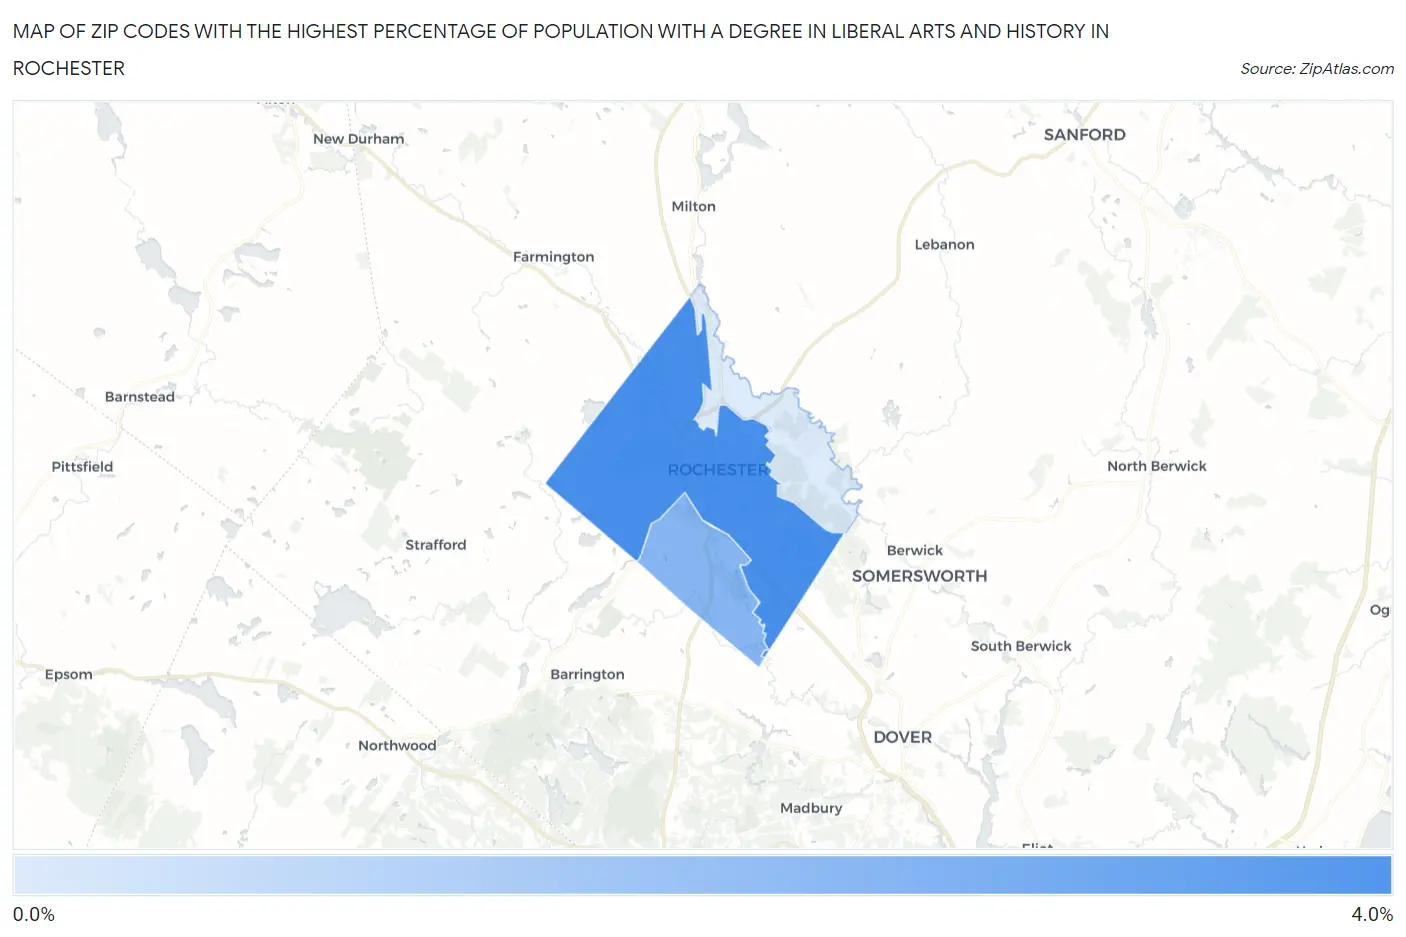
Map of Zip Codes with the Highest Percentage of Population with a Degree in Liberal Arts and History in Rochester
0.96%
3.3%
Zip Codes with the Highest Percentage of Population with a Degree in Liberal Arts and History in Rochester, NH
| Zip Code | % Graduates | vs State | vs National | |
| 1. | 03867 | 3.3% | 4.9%(-1.54)#160 | 4.9%(-1.54)#17,211 |
| 2. | 03839 | 2.3% | 4.9%(-2.52)#193 | 4.9%(-2.53)#20,422 |
| 3. | 03868 | 0.96% | 4.9%(-3.91)#217 | 4.9%(-3.91)#23,454 |
1
Common Questions
What are the Top Zip Codes with the Highest Percentage of Population with a Degree in Liberal Arts and History in Rochester, NH?
Top Zip Codes with the Highest Percentage of Population with a Degree in Liberal Arts and History in Rochester, NH are:
What zip code has the Highest Percentage of Population with a Degree in Liberal Arts and History in Rochester, NH?
03867 has the Highest Percentage of Population with a Degree in Liberal Arts and History in Rochester, NH with 3.3%.
What is the Percentage of Population with a Degree in Liberal Arts and History in Rochester, NH?
Percentage of Population with a Degree in Liberal Arts and History in Rochester is 2.6%.
What is the Percentage of Population with a Degree in Liberal Arts and History in New Hampshire?
Percentage of Population with a Degree in Liberal Arts and History in New Hampshire is 4.9%.
What is the Percentage of Population with a Degree in Liberal Arts and History in the United States?
Percentage of Population with a Degree in Liberal Arts and History in the United States is 4.9%.