Zip Codes with the Most Immigrants from Latin America in Rochester, NH
RELATED REPORTS & OPTIONS
Latin America
Rochester
Compare Zip Codes
Map of Zip Codes with the Most Immigrants from Latin America in Rochester
15
91
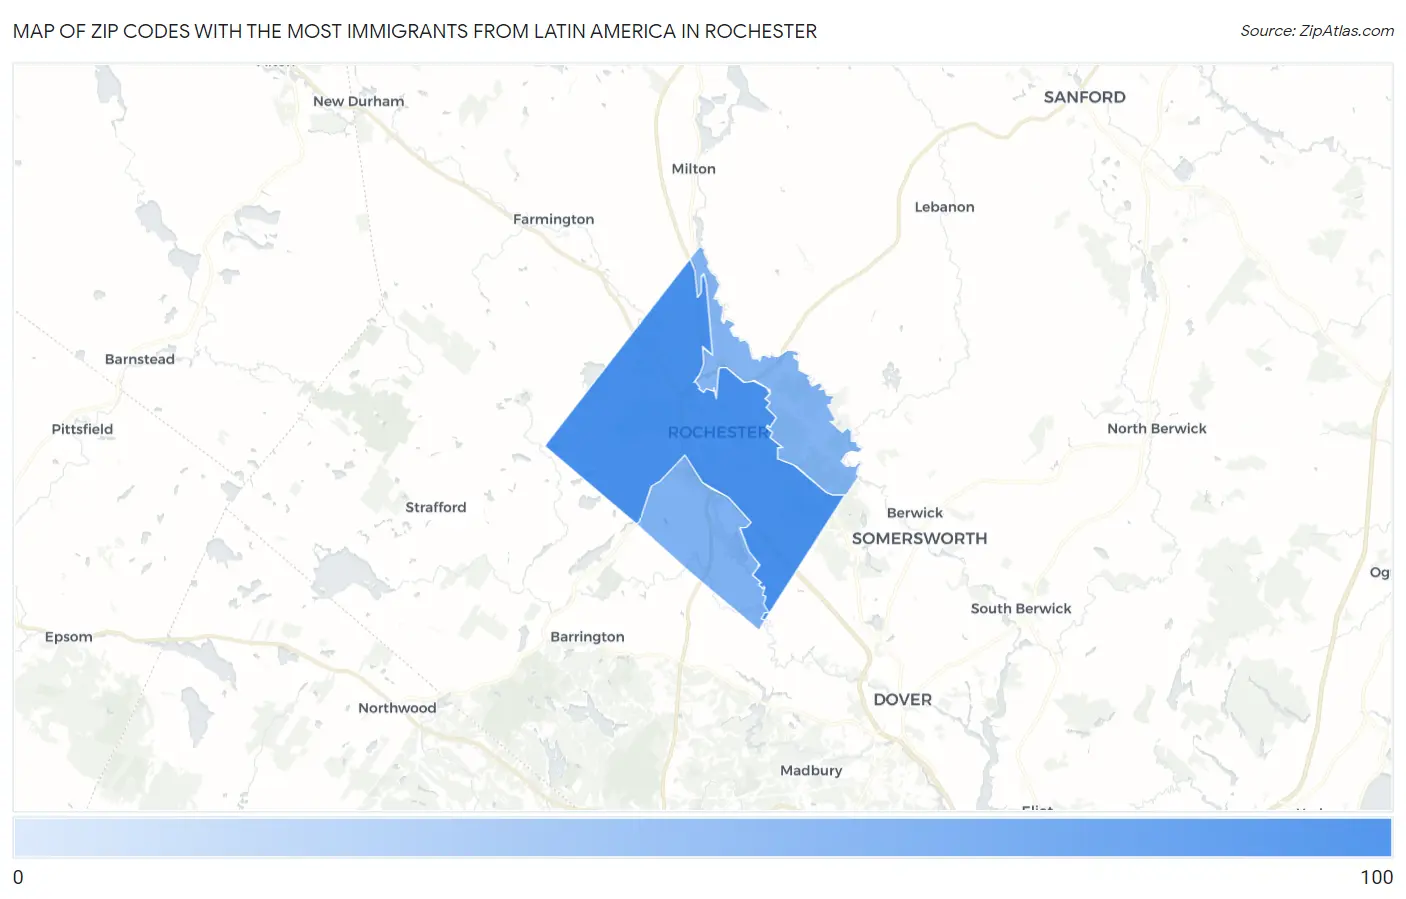
Zip Codes with the Most Immigrants from Latin America in Rochester, NH
| Zip Code | Latin America | vs State | vs National | |
| 1. | 03867 | 91 | 19,507(0.47%)#31 | 22,649,518(0.00%)#11,441 |
| 2. | 03839 | 16 | 19,507(0.08%)#86 | 22,649,518(0.00%)#16,584 |
| 3. | 03868 | 15 | 19,507(0.08%)#90 | 22,649,518(0.00%)#16,736 |
1
Common Questions
What are the Top Zip Codes with the Most Immigrants from Latin America in Rochester, NH?
Top Zip Codes with the Most Immigrants from Latin America in Rochester, NH are:
What zip code has the Most Immigrants from Latin America in Rochester, NH?
03867 has the Most Immigrants from Latin America in Rochester, NH with 91.
What is the Total Immigrants from Latin America in Rochester, NH?
Total Immigrants from Latin America in Rochester is 122.
What is the Total Immigrants from Latin America in New Hampshire?
Total Immigrants from Latin America in New Hampshire is 19,507.
What is the Total Immigrants from Latin America in the United States?
Total Immigrants from Latin America in the United States is 22,649,518.