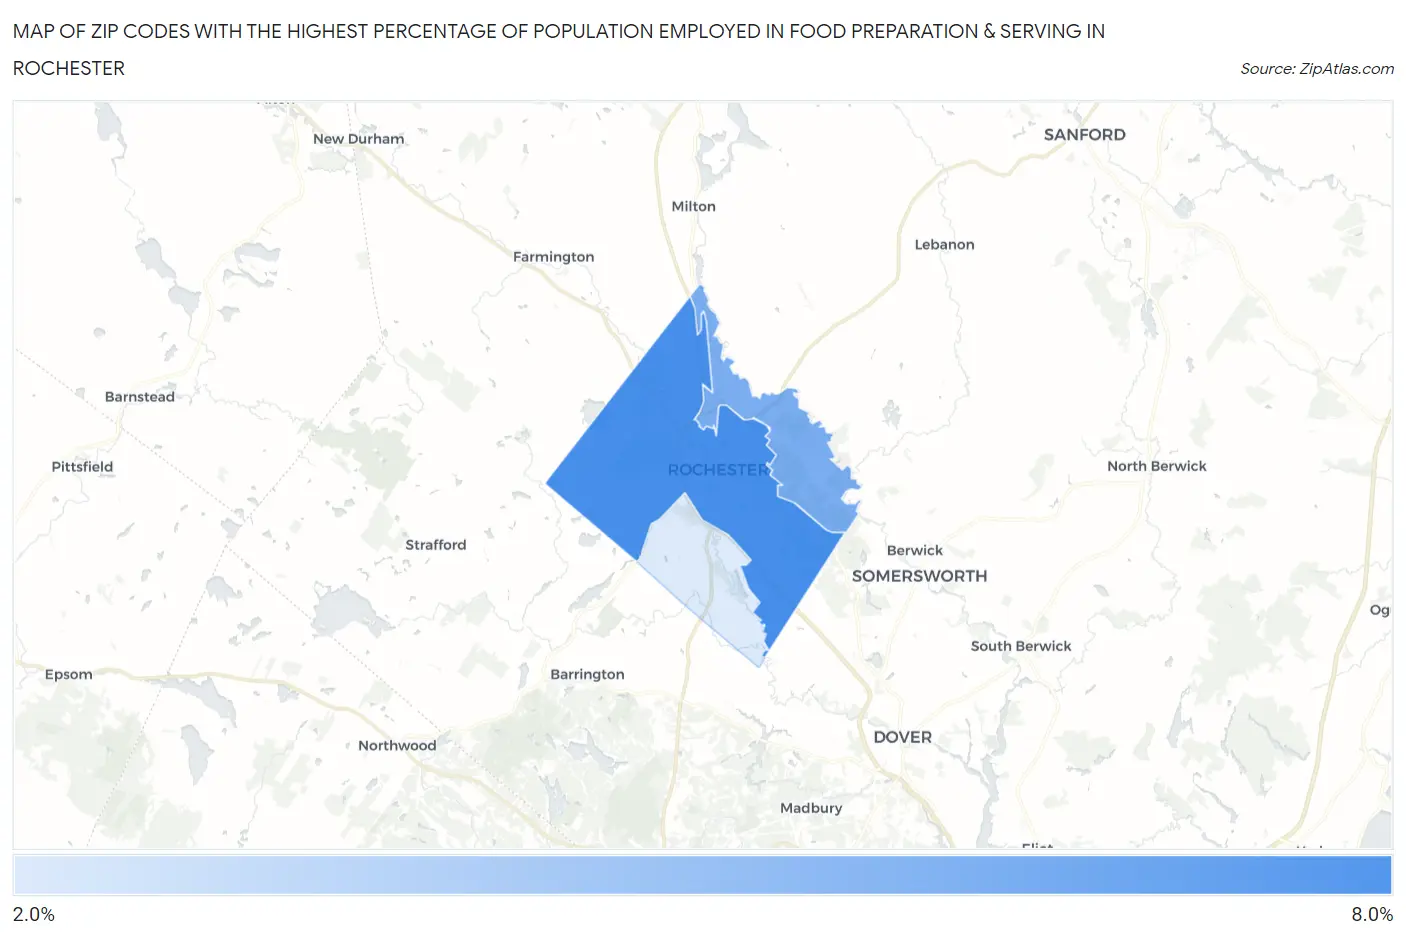
Zip Codes with the Highest Percentage of Population Employed in Food Preparation & Serving in Rochester, NH
RELATED REPORTS & OPTIONS
Food Preparation & Serving
Rochester
Compare Zip Codes
Map of Zip Codes with the Highest Percentage of Population Employed in Food Preparation & Serving in Rochester
3.0%
7.0%
Zip Codes with the Highest Percentage of Population Employed in Food Preparation & Serving in Rochester, NH
| Zip Code | % Employed | vs State | vs National | |
| 1. | 03867 | 7.0% | 5.2%(+1.84)#60 | 5.3%(+1.74)#6,484 |
| 2. | 03868 | 5.6% | 5.2%(+0.430)#85 | 5.3%(+0.337)#10,631 |
| 3. | 03839 | 3.0% | 5.2%(-2.23)#167 | 5.3%(-2.33)#21,418 |
1
Common Questions
What are the Top Zip Codes with the Highest Percentage of Population Employed in Food Preparation & Serving in Rochester, NH?
Top Zip Codes with the Highest Percentage of Population Employed in Food Preparation & Serving in Rochester, NH are:
What zip code has the Highest Percentage of Population Employed in Food Preparation & Serving in Rochester, NH?
03867 has the Highest Percentage of Population Employed in Food Preparation & Serving in Rochester, NH with 7.0%.
What is the Percentage of Population Employed in Food Preparation & Serving in Rochester, NH?
Percentage of Population Employed in Food Preparation & Serving in Rochester is 6.3%.
What is the Percentage of Population Employed in Food Preparation & Serving in New Hampshire?
Percentage of Population Employed in Food Preparation & Serving in New Hampshire is 5.2%.
What is the Percentage of Population Employed in Food Preparation & Serving in the United States?
Percentage of Population Employed in Food Preparation & Serving in the United States is 5.3%.