Zip Codes with the Highest Percentage of Households Without a Vehicle in Rochester, NH
RELATED REPORTS & OPTIONS
Households without a Cars
Rochester
Compare Zip Codes
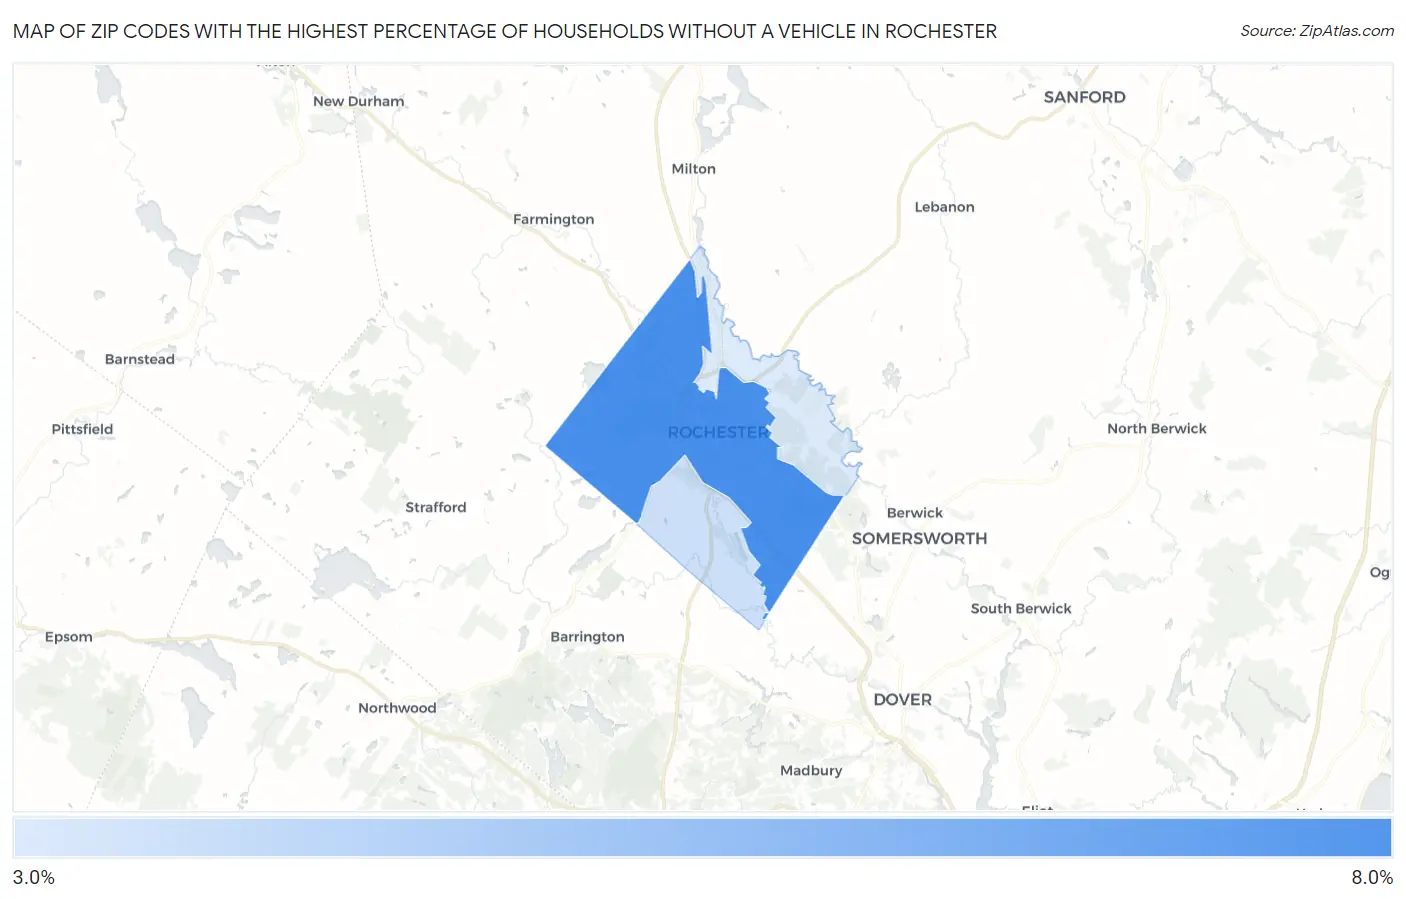
Map of Zip Codes with the Highest Percentage of Households Without a Vehicle in Rochester
3.5%
7.3%
Zip Codes with the Highest Percentage of Households Without a Vehicle in Rochester, NH
| Zip Code | Housholds Without a Car | vs State | vs National | |
| 1. | 03867 | 7.3% | 4.6%(+2.70)#31 | 8.3%(-1.00)#8,049 |
| 2. | 03839 | 3.9% | 4.6%(-0.700)#81 | 8.3%(-4.40)#16,169 |
| 3. | 03868 | 3.5% | 4.6%(-1.10)#92 | 8.3%(-4.80)#17,438 |
1
Common Questions
What are the Top Zip Codes with the Highest Percentage of Households Without a Vehicle in Rochester, NH?
Top Zip Codes with the Highest Percentage of Households Without a Vehicle in Rochester, NH are:
What zip code has the Highest Percentage of Households Without a Vehicle in Rochester, NH?
03867 has the Highest Percentage of Households Without a Vehicle in Rochester, NH with 7.3%.
What is the Percentage of Households Without a Vehicle in Rochester, NH?
Percentage of Households Without a Vehicle in Rochester is 6.1%.
What is the Percentage of Households Without a Vehicle in New Hampshire?
Percentage of Households Without a Vehicle in New Hampshire is 4.6%.
What is the Percentage of Households Without a Vehicle in the United States?
Percentage of Households Without a Vehicle in the United States is 8.3%.