Zip Codes with the Highest Percentage of Households with Income Above $200,000 in Rochester, NH
RELATED REPORTS & OPTIONS
Household Income | $200k+
Rochester
Compare Zip Codes
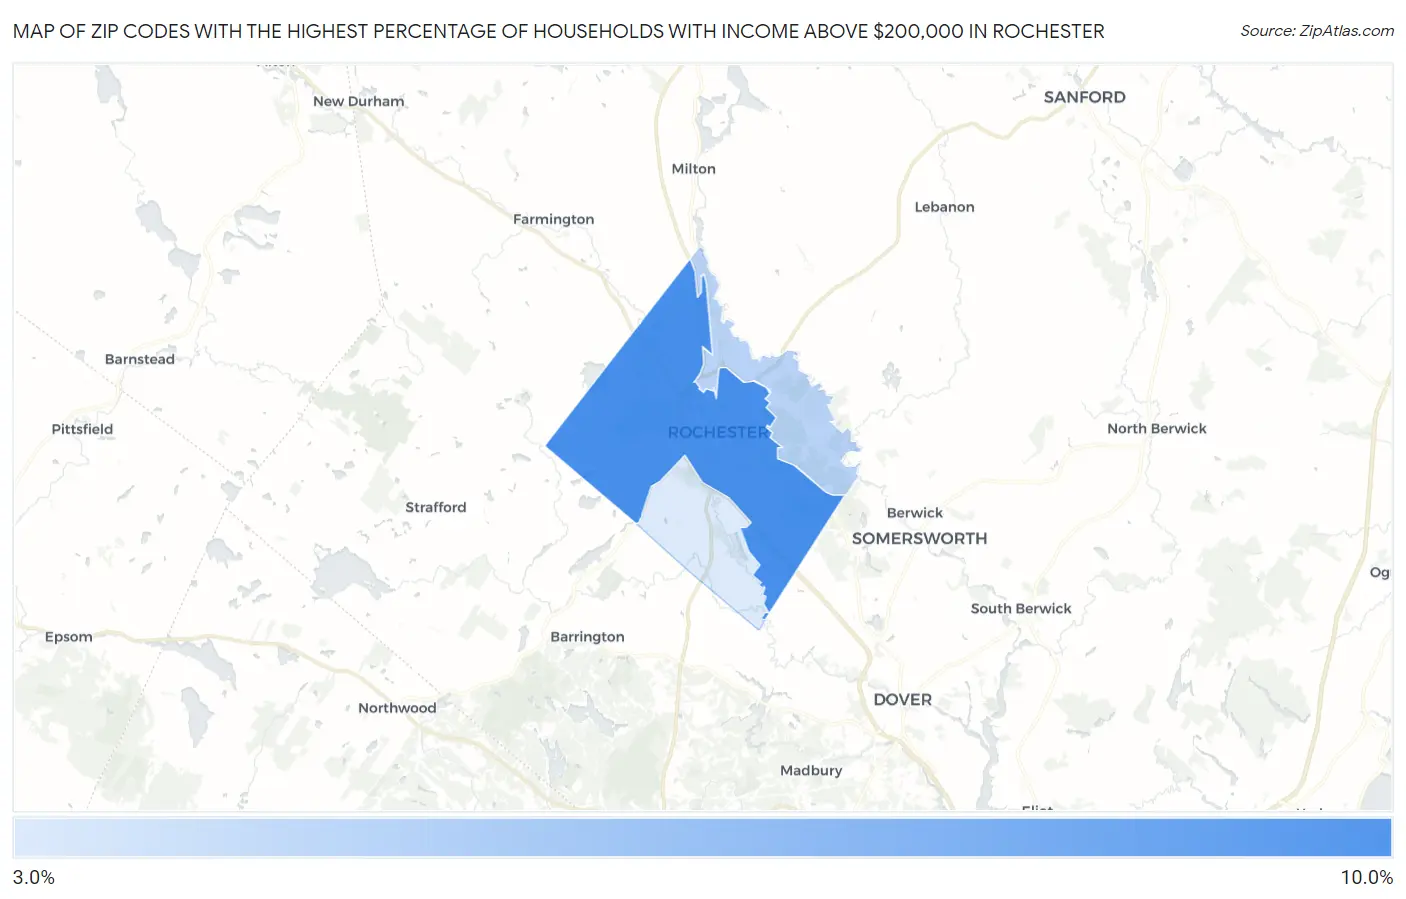
Map of Zip Codes with the Highest Percentage of Households with Income Above $200,000 in Rochester
3.3%
8.2%
Zip Codes with the Highest Percentage of Households with Income Above $200,000 in Rochester, NH
| Zip Code | Households with Income > $200k | vs State | vs National | |
| 1. | 03867 | 8.2% | 14.0%(-5.80)#155 | 11.4%(-3.20)#10,116 |
| 2. | 03868 | 4.5% | 14.0%(-9.50)#204 | 11.4%(-6.90)#16,842 |
| 3. | 03839 | 3.3% | 14.0%(-10.7)#223 | 11.4%(-8.10)#20,118 |
1
Common Questions
What are the Top Zip Codes with the Highest Percentage of Households with Income Above $200,000 in Rochester, NH?
Top Zip Codes with the Highest Percentage of Households with Income Above $200,000 in Rochester, NH are:
What zip code has the Highest Percentage of Households with Income Above $200,000 in Rochester, NH?
03867 has the Highest Percentage of Households with Income Above $200,000 in Rochester, NH with 8.2%.
What is the Percentage of Households with Income Above $200,000 in Rochester, NH?
Percentage of Households with Income Above $200,000 in Rochester is 7.0%.
What is the Percentage of Households with Income Above $200,000 in New Hampshire?
Percentage of Households with Income Above $200,000 in New Hampshire is 14.0%.
What is the Percentage of Households with Income Above $200,000 in the United States?
Percentage of Households with Income Above $200,000 in the United States is 11.4%.