Zip Codes with the Highest Percentage of Population Employed in Architecture & Engineering in Rochester, NH
RELATED REPORTS & OPTIONS
Architecture & Engineering
Rochester
Compare Zip Codes
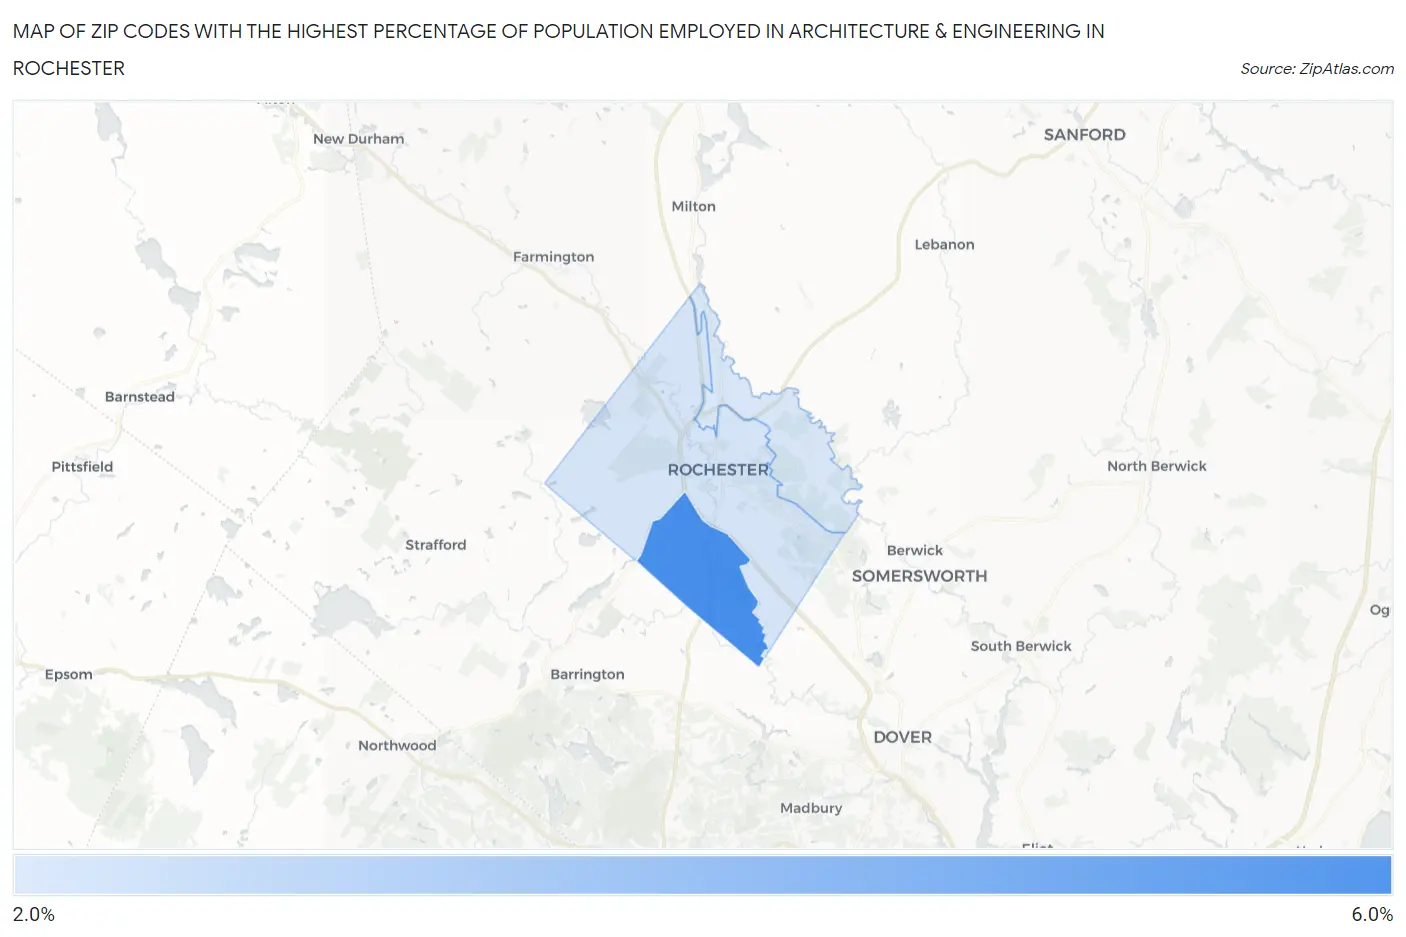
Map of Zip Codes with the Highest Percentage of Population Employed in Architecture & Engineering in Rochester
2.2%
5.3%
Zip Codes with the Highest Percentage of Population Employed in Architecture & Engineering in Rochester, NH
| Zip Code | % Employed | vs State | vs National | |
| 1. | 03839 | 5.3% | 3.1%(+2.17)#19 | 2.1%(+3.13)#1,462 |
| 2. | 03867 | 2.3% | 3.1%(-0.841)#116 | 2.1%(+0.121)#8,099 |
| 3. | 03868 | 2.2% | 3.1%(-0.938)#125 | 2.1%(+0.024)#8,648 |
1
Common Questions
What are the Top Zip Codes with the Highest Percentage of Population Employed in Architecture & Engineering in Rochester, NH?
Top Zip Codes with the Highest Percentage of Population Employed in Architecture & Engineering in Rochester, NH are:
What zip code has the Highest Percentage of Population Employed in Architecture & Engineering in Rochester, NH?
03839 has the Highest Percentage of Population Employed in Architecture & Engineering in Rochester, NH with 5.3%.
What is the Percentage of Population Employed in Architecture & Engineering in Rochester, NH?
Percentage of Population Employed in Architecture & Engineering in Rochester is 2.6%.
What is the Percentage of Population Employed in Architecture & Engineering in New Hampshire?
Percentage of Population Employed in Architecture & Engineering in New Hampshire is 3.1%.
What is the Percentage of Population Employed in Architecture & Engineering in the United States?
Percentage of Population Employed in Architecture & Engineering in the United States is 2.1%.