Zip Codes with the Highest Percentage of Population Employed in Accommodation & Food Services in Rochester, NH
RELATED REPORTS & OPTIONS
Accommodation & Food Services
Rochester
Compare Zip Codes
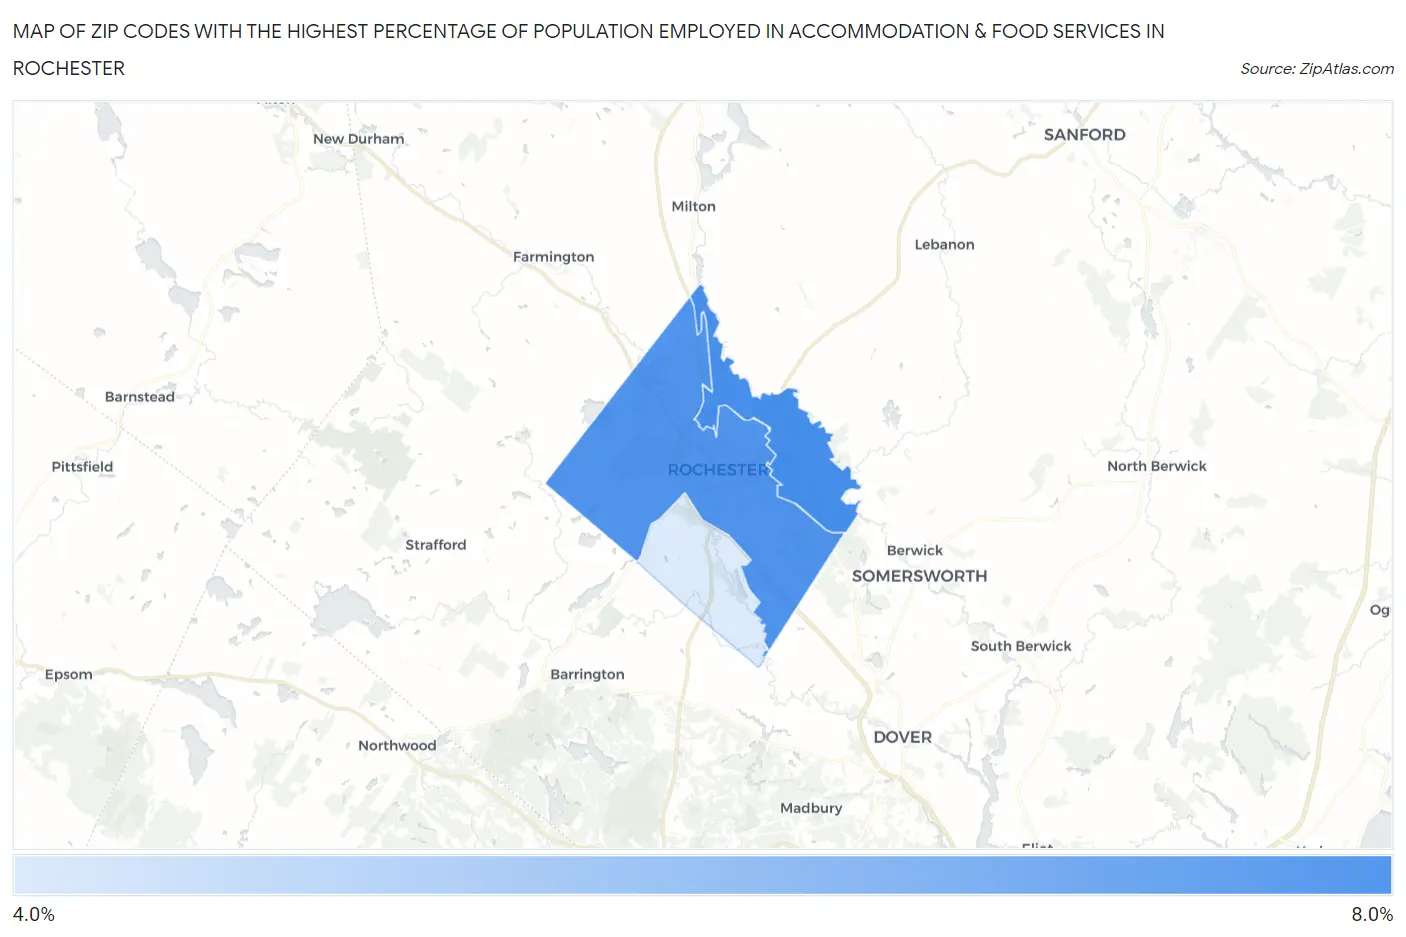
Map of Zip Codes with the Highest Percentage of Population Employed in Accommodation & Food Services in Rochester
4.9%
6.6%
Zip Codes with the Highest Percentage of Population Employed in Accommodation & Food Services in Rochester, NH
| Zip Code | % Employed | vs State | vs National | |
| 1. | 03868 | 6.6% | 6.3%(+0.286)#89 | 6.9%(-0.292)#11,558 |
| 2. | 03867 | 6.5% | 6.3%(+0.207)#95 | 6.9%(-0.371)#11,820 |
| 3. | 03839 | 4.9% | 6.3%(-1.43)#135 | 6.9%(-2.01)#17,252 |
1
Common Questions
What are the Top Zip Codes with the Highest Percentage of Population Employed in Accommodation & Food Services in Rochester, NH?
Top Zip Codes with the Highest Percentage of Population Employed in Accommodation & Food Services in Rochester, NH are:
What zip code has the Highest Percentage of Population Employed in Accommodation & Food Services in Rochester, NH?
03868 has the Highest Percentage of Population Employed in Accommodation & Food Services in Rochester, NH with 6.6%.
What is the Percentage of Population Employed in Accommodation & Food Services in Rochester, NH?
Percentage of Population Employed in Accommodation & Food Services in Rochester is 6.3%.
What is the Percentage of Population Employed in Accommodation & Food Services in New Hampshire?
Percentage of Population Employed in Accommodation & Food Services in New Hampshire is 6.3%.
What is the Percentage of Population Employed in Accommodation & Food Services in the United States?
Percentage of Population Employed in Accommodation & Food Services in the United States is 6.9%.