Zip Codes with the Highest Percentage of Households with Income Below $10,000 in Concord, NH
RELATED REPORTS & OPTIONS
Household Income | $0-10k
Concord
Compare Zip Codes
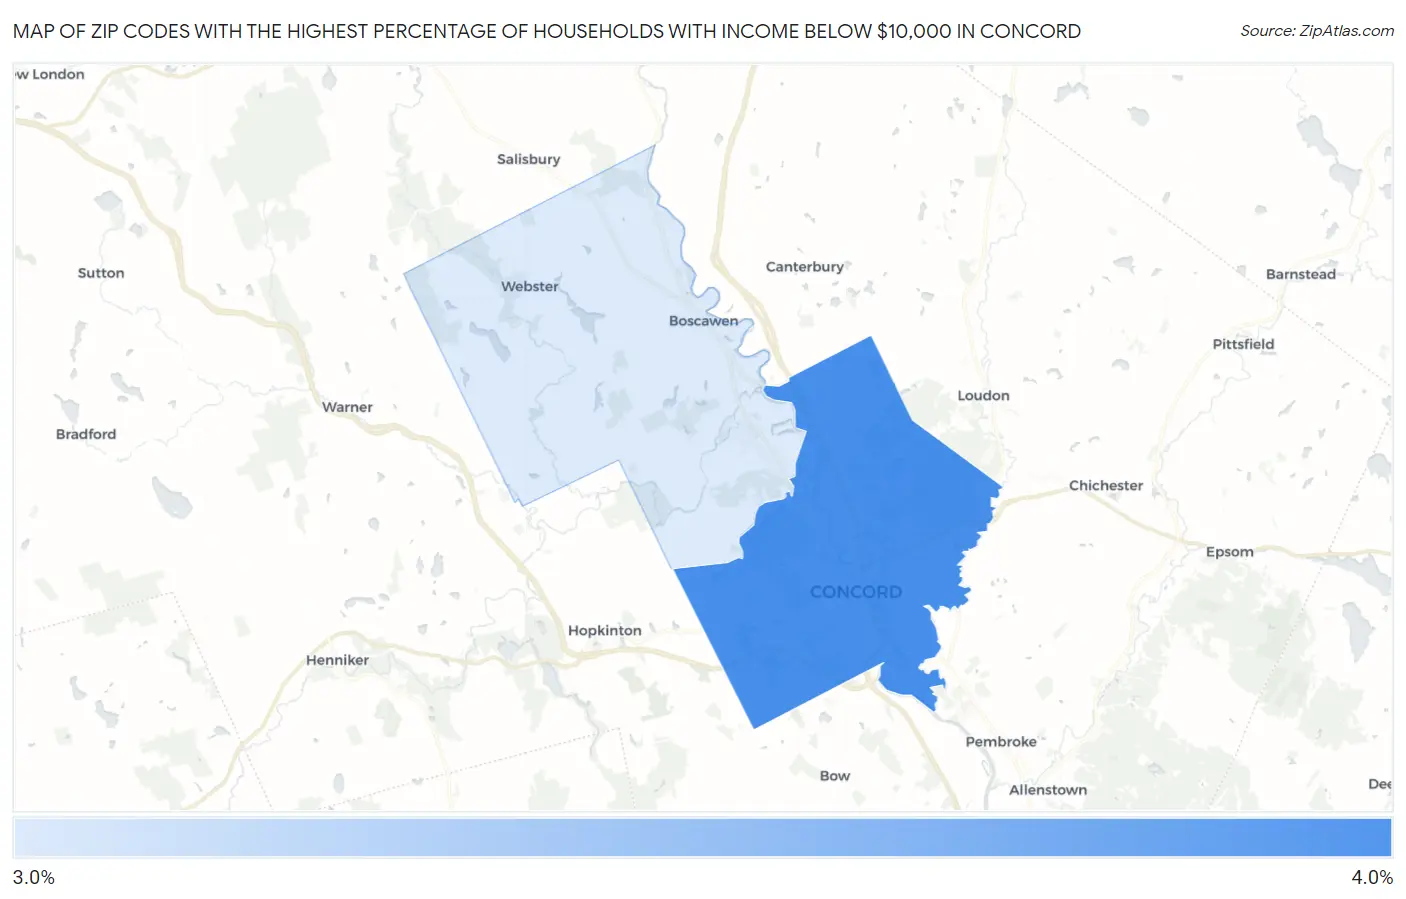
Map of Zip Codes with the Highest Percentage of Households with Income Below $10,000 in Concord
3.0%
3.5%
Zip Codes with the Highest Percentage of Households with Income Below $10,000 in Concord, NH
| Zip Code | Households with Income < $10k | vs State | vs National | |
| 1. | 03301 | 3.5% | 2.9%(+0.600)#73 | 4.9%(-1.40)#17,230 |
| 2. | 03303 | 3.0% | 2.9%(+0.100)#92 | 4.9%(-1.90)#19,432 |
1
Common Questions
What are the Top Zip Codes with the Highest Percentage of Households with Income Below $10,000 in Concord, NH?
Top Zip Codes with the Highest Percentage of Households with Income Below $10,000 in Concord, NH are:
What zip code has the Highest Percentage of Households with Income Below $10,000 in Concord, NH?
03301 has the Highest Percentage of Households with Income Below $10,000 in Concord, NH with 3.5%.
What is the Percentage of Households with Income Below $10,000 in Concord, NH?
Percentage of Households with Income Below $10,000 in Concord is 3.3%.
What is the Percentage of Households with Income Below $10,000 in New Hampshire?
Percentage of Households with Income Below $10,000 in New Hampshire is 2.9%.
What is the Percentage of Households with Income Below $10,000 in the United States?
Percentage of Households with Income Below $10,000 in the United States is 4.9%.