Zip Codes with the Highest Percentage of Population Employed in Food Preparation & Serving in Ballwin, MO
RELATED REPORTS & OPTIONS
Food Preparation & Serving
Ballwin
Compare Zip Codes
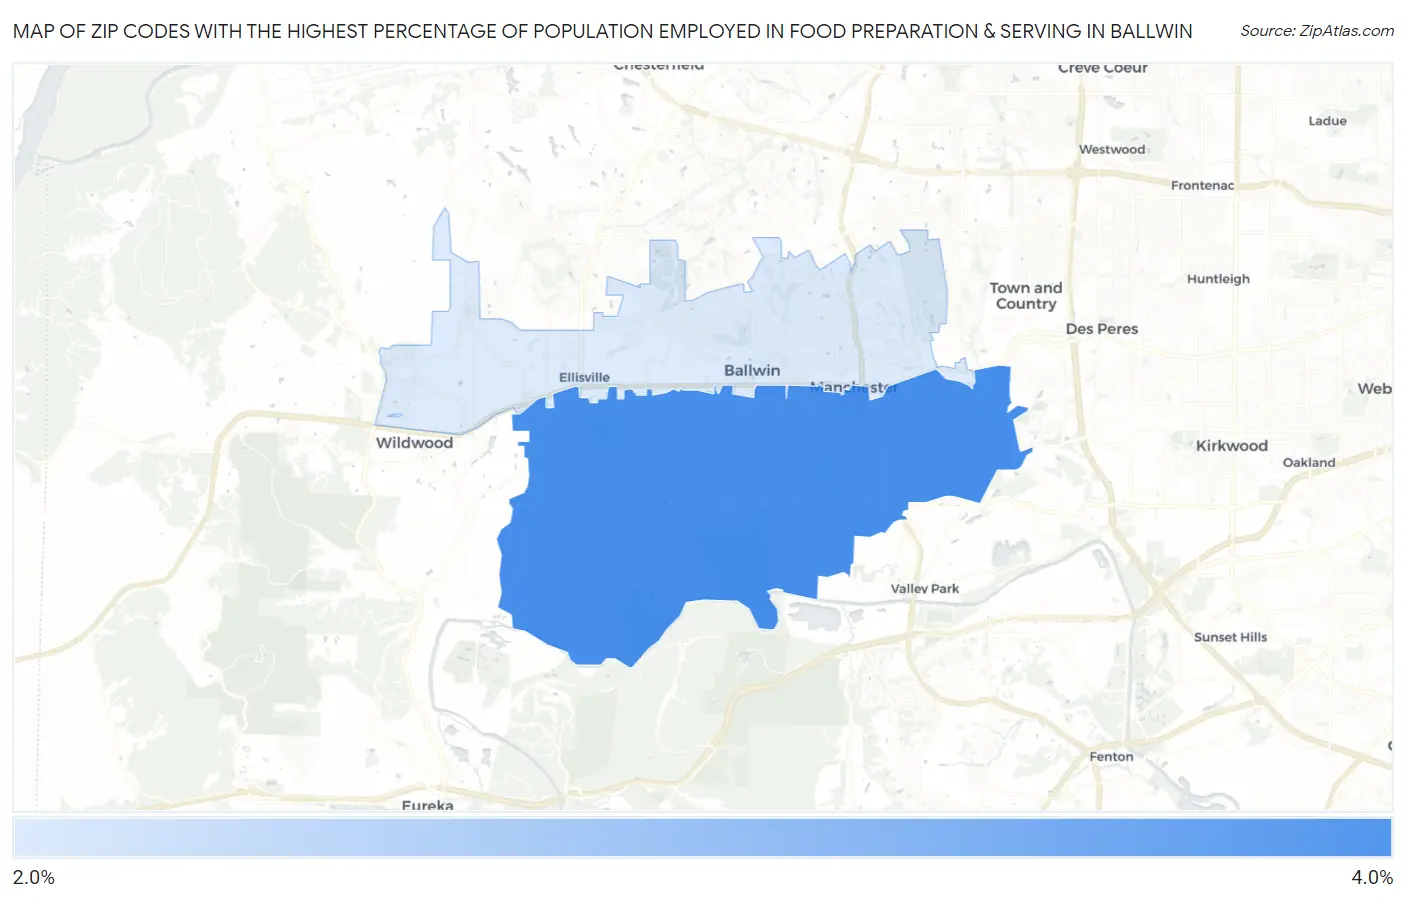
Map of Zip Codes with the Highest Percentage of Population Employed in Food Preparation & Serving in Ballwin
2.3%
3.4%
Zip Codes with the Highest Percentage of Population Employed in Food Preparation & Serving in Ballwin, MO
| Zip Code | % Employed | vs State | vs National | |
| 1. | 63021 | 3.4% | 5.2%(-1.83)#576 | 5.3%(-1.88)#19,598 |
| 2. | 63011 | 2.3% | 5.2%(-2.93)#704 | 5.3%(-2.98)#23,745 |
1
Common Questions
What are the Top Zip Codes with the Highest Percentage of Population Employed in Food Preparation & Serving in Ballwin, MO?
Top Zip Codes with the Highest Percentage of Population Employed in Food Preparation & Serving in Ballwin, MO are:
What zip code has the Highest Percentage of Population Employed in Food Preparation & Serving in Ballwin, MO?
63021 has the Highest Percentage of Population Employed in Food Preparation & Serving in Ballwin, MO with 3.4%.
What is the Percentage of Population Employed in Food Preparation & Serving in Ballwin, MO?
Percentage of Population Employed in Food Preparation & Serving in Ballwin is 3.1%.
What is the Percentage of Population Employed in Food Preparation & Serving in Missouri?
Percentage of Population Employed in Food Preparation & Serving in Missouri is 5.2%.
What is the Percentage of Population Employed in Food Preparation & Serving in the United States?
Percentage of Population Employed in Food Preparation & Serving in the United States is 5.3%.