Zip Codes with the Highest Percentage of Households Heated by Bottled Gas / Liquid Propane in Ballwin, MO
RELATED REPORTS & OPTIONS
Bottled Gas / LP Heating
Ballwin
Compare Zip Codes
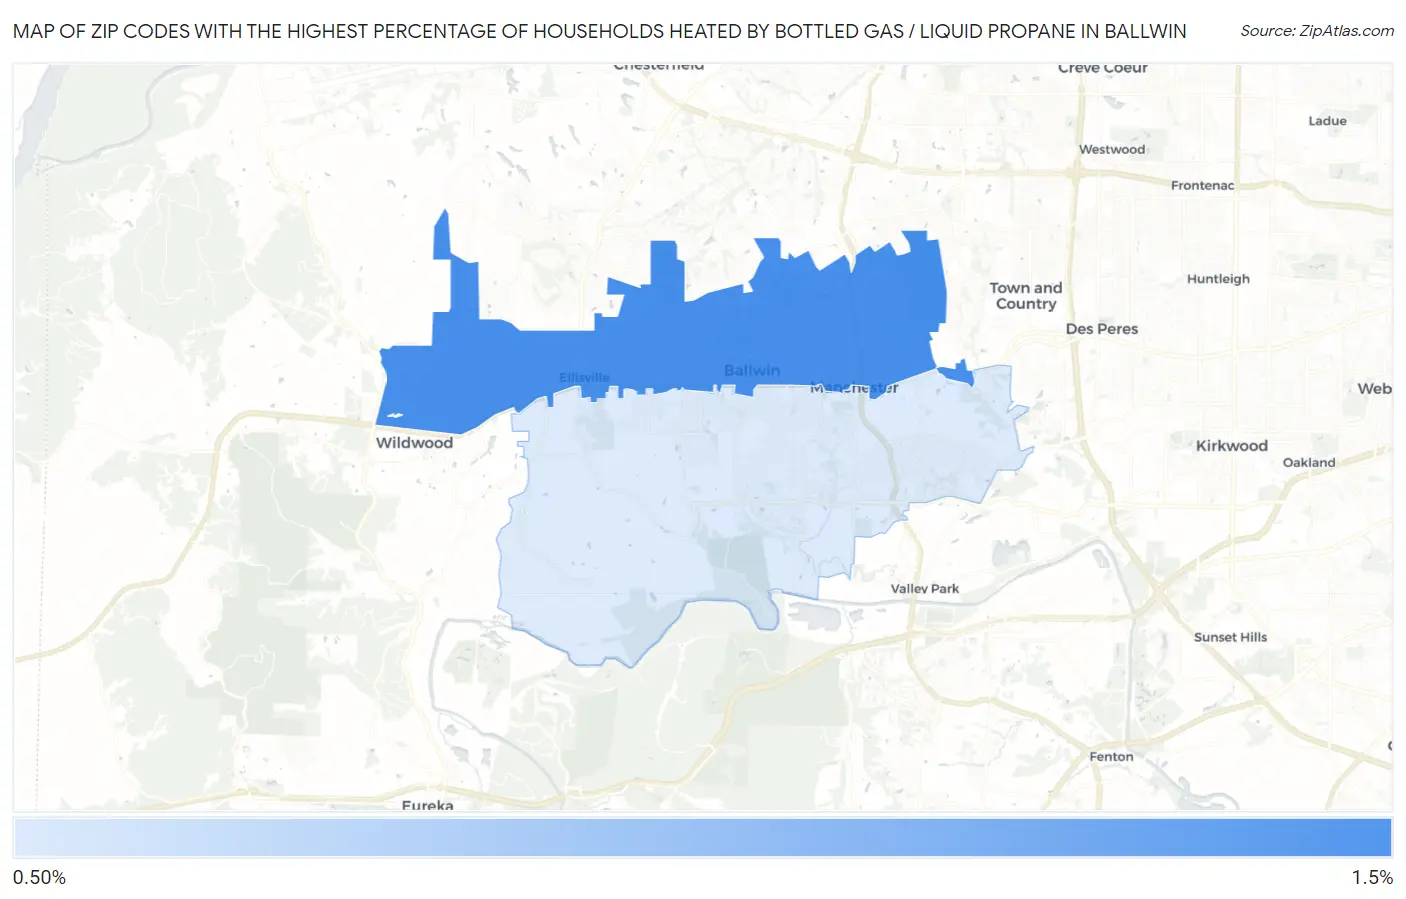
Map of Zip Codes with the Highest Percentage of Households Heated by Bottled Gas / Liquid Propane in Ballwin
0.90%
1.1%
Zip Codes with the Highest Percentage of Households Heated by Bottled Gas / Liquid Propane in Ballwin, MO
| Zip Code | Bottled Gas / LP Heating | vs State | vs National | |
| 1. | 63011 | 1.1% | 8.5%(-7.40)#927 | 4.9%(-3.80)#26,207 |
| 2. | 63021 | 0.90% | 8.5%(-7.60)#940 | 4.9%(-4.00)#26,950 |
1
Common Questions
What are the Top Zip Codes with the Highest Percentage of Households Heated by Bottled Gas / Liquid Propane in Ballwin, MO?
Top Zip Codes with the Highest Percentage of Households Heated by Bottled Gas / Liquid Propane in Ballwin, MO are:
What zip code has the Highest Percentage of Households Heated by Bottled Gas / Liquid Propane in Ballwin, MO?
63011 has the Highest Percentage of Households Heated by Bottled Gas / Liquid Propane in Ballwin, MO with 1.1%.
What is the Percentage of Households Heated by Bottled Gas / Liquid Propane in Ballwin, MO?
Percentage of Households Heated by Bottled Gas / Liquid Propane in Ballwin is 0.60%.
What is the Percentage of Households Heated by Bottled Gas / Liquid Propane in Missouri?
Percentage of Households Heated by Bottled Gas / Liquid Propane in Missouri is 8.5%.
What is the Percentage of Households Heated by Bottled Gas / Liquid Propane in the United States?
Percentage of Households Heated by Bottled Gas / Liquid Propane in the United States is 4.9%.