Zip Codes with the Highest Percentage of Population with a Degree in Visual and Performing Arts in Ballwin, MO
RELATED REPORTS & OPTIONS
Visual and Performing Arts
Ballwin
Compare Zip Codes
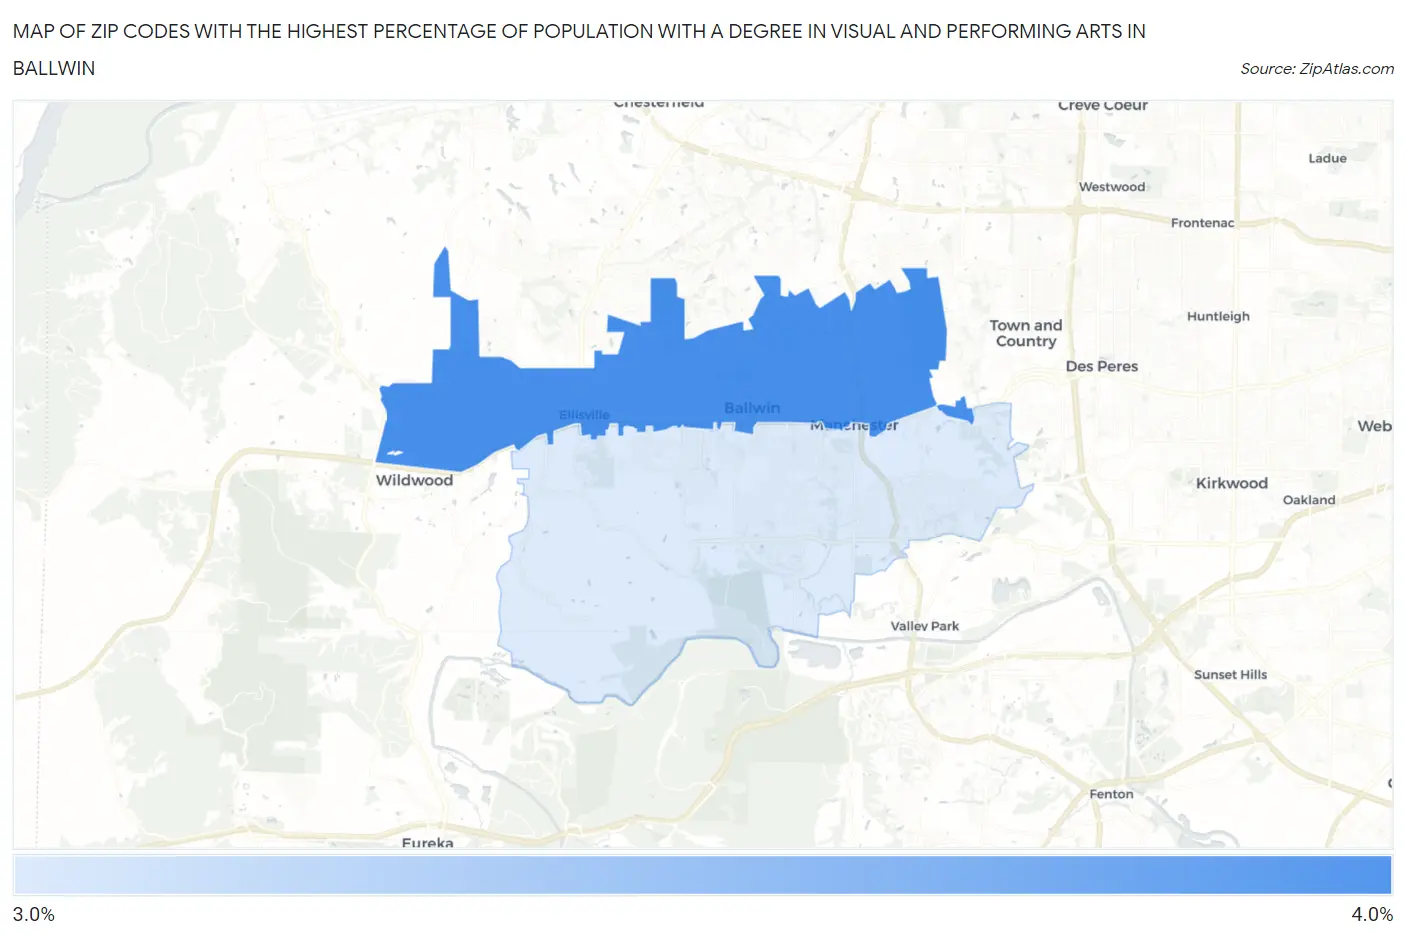
Map of Zip Codes with the Highest Percentage of Population with a Degree in Visual and Performing Arts in Ballwin
3.1%
3.6%
Zip Codes with the Highest Percentage of Population with a Degree in Visual and Performing Arts in Ballwin, MO
| Zip Code | % Graduates | vs State | vs National | |
| 1. | 63011 | 3.6% | 3.8%(-0.208)#262 | 4.3%(-0.689)#10,651 |
| 2. | 63021 | 3.1% | 3.8%(-0.705)#305 | 4.3%(-1.19)#12,473 |
1
Common Questions
What are the Top Zip Codes with the Highest Percentage of Population with a Degree in Visual and Performing Arts in Ballwin, MO?
Top Zip Codes with the Highest Percentage of Population with a Degree in Visual and Performing Arts in Ballwin, MO are:
What zip code has the Highest Percentage of Population with a Degree in Visual and Performing Arts in Ballwin, MO?
63011 has the Highest Percentage of Population with a Degree in Visual and Performing Arts in Ballwin, MO with 3.6%.
What is the Percentage of Population with a Degree in Visual and Performing Arts in Ballwin, MO?
Percentage of Population with a Degree in Visual and Performing Arts in Ballwin is 4.8%.
What is the Percentage of Population with a Degree in Visual and Performing Arts in Missouri?
Percentage of Population with a Degree in Visual and Performing Arts in Missouri is 3.8%.
What is the Percentage of Population with a Degree in Visual and Performing Arts in the United States?
Percentage of Population with a Degree in Visual and Performing Arts in the United States is 4.3%.