Zip Codes with the Highest Percentage of Population with a Degree in Engineering in Ballwin, MO
RELATED REPORTS & OPTIONS
Engineering
Ballwin
Compare Zip Codes
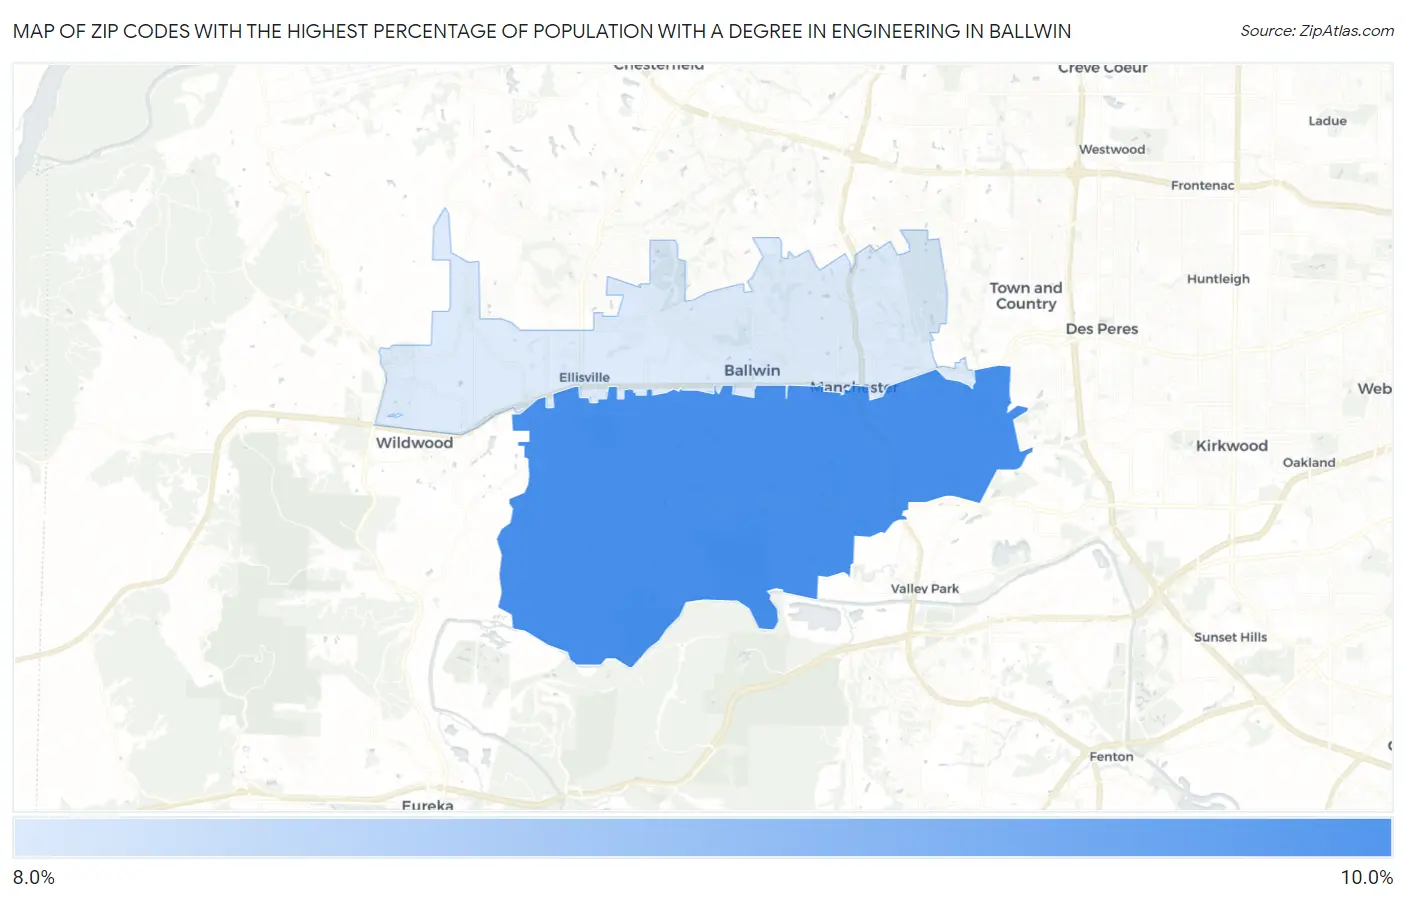
Map of Zip Codes with the Highest Percentage of Population with a Degree in Engineering in Ballwin
8.2%
8.5%
Zip Codes with the Highest Percentage of Population with a Degree in Engineering in Ballwin, MO
| Zip Code | % Graduates | vs State | vs National | |
| 1. | 63021 | 8.5% | 5.6%(+2.91)#104 | 7.6%(+0.836)#6,297 |
| 2. | 63011 | 8.2% | 5.6%(+2.63)#111 | 7.6%(+0.551)#6,746 |
1
Common Questions
What are the Top Zip Codes with the Highest Percentage of Population with a Degree in Engineering in Ballwin, MO?
Top Zip Codes with the Highest Percentage of Population with a Degree in Engineering in Ballwin, MO are:
What zip code has the Highest Percentage of Population with a Degree in Engineering in Ballwin, MO?
63021 has the Highest Percentage of Population with a Degree in Engineering in Ballwin, MO with 8.5%.
What is the Percentage of Population with a Degree in Engineering in Ballwin, MO?
Percentage of Population with a Degree in Engineering in Ballwin is 9.5%.
What is the Percentage of Population with a Degree in Engineering in Missouri?
Percentage of Population with a Degree in Engineering in Missouri is 5.6%.
What is the Percentage of Population with a Degree in Engineering in the United States?
Percentage of Population with a Degree in Engineering in the United States is 7.6%.