Zip Codes with the Highest Percentage of Population Employed in Accommodation & Food Services in Ballwin, MO
RELATED REPORTS & OPTIONS
Accommodation & Food Services
Ballwin
Compare Zip Codes
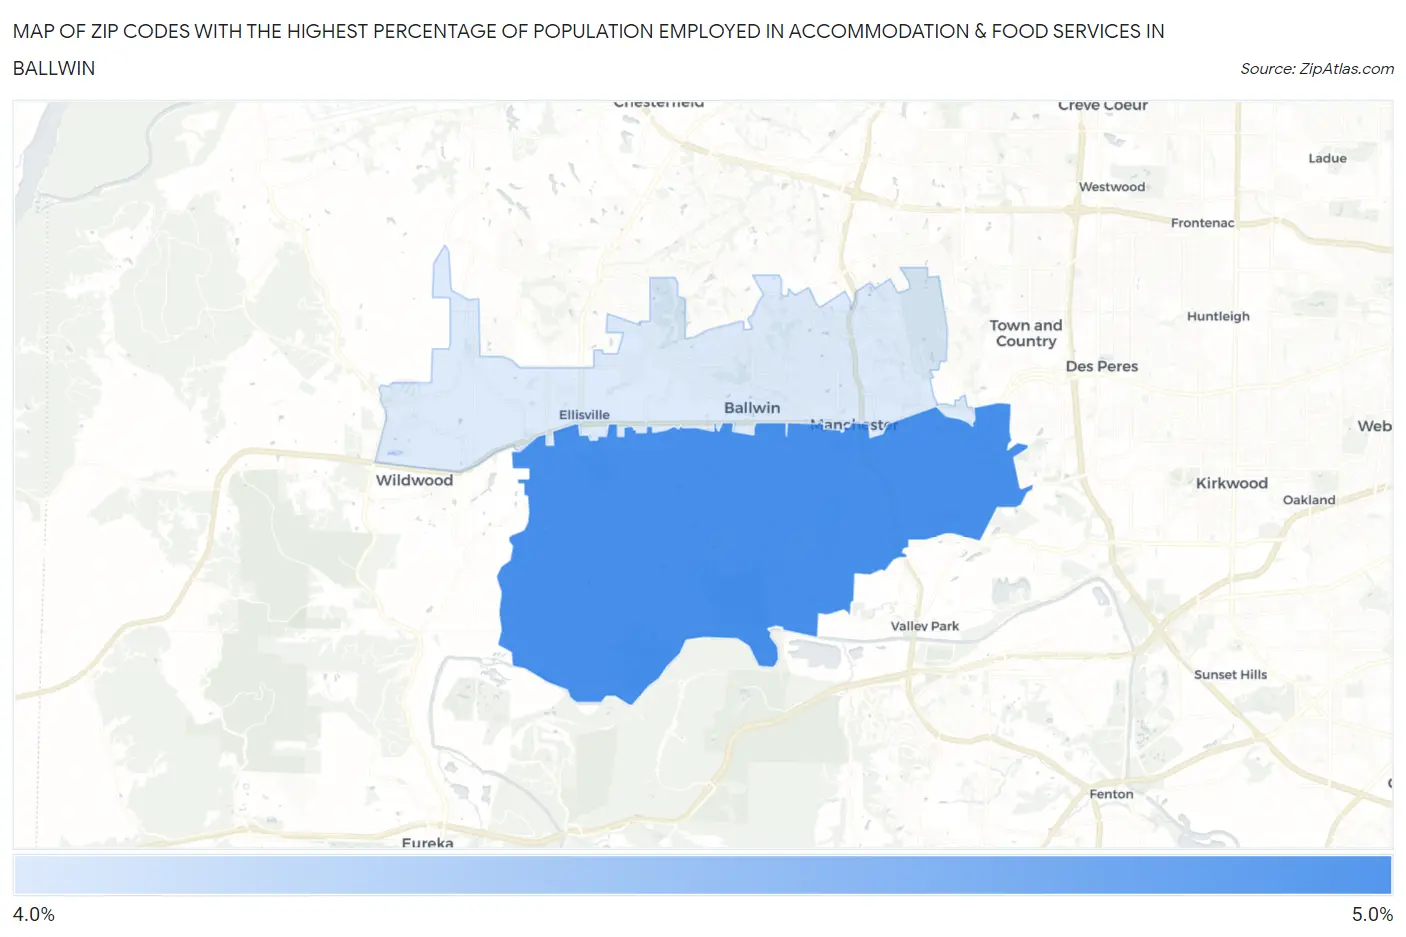
Map of Zip Codes with the Highest Percentage of Population Employed in Accommodation & Food Services in Ballwin
4.2%
4.6%
Zip Codes with the Highest Percentage of Population Employed in Accommodation & Food Services in Ballwin, MO
| Zip Code | % Employed | vs State | vs National | |
| 1. | 63021 | 4.6% | 6.6%(-2.00)#494 | 6.9%(-2.30)#18,236 |
| 2. | 63011 | 4.2% | 6.6%(-2.37)#537 | 6.9%(-2.67)#19,474 |
1
Common Questions
What are the Top Zip Codes with the Highest Percentage of Population Employed in Accommodation & Food Services in Ballwin, MO?
Top Zip Codes with the Highest Percentage of Population Employed in Accommodation & Food Services in Ballwin, MO are:
What zip code has the Highest Percentage of Population Employed in Accommodation & Food Services in Ballwin, MO?
63021 has the Highest Percentage of Population Employed in Accommodation & Food Services in Ballwin, MO with 4.6%.
What is the Percentage of Population Employed in Accommodation & Food Services in Ballwin, MO?
Percentage of Population Employed in Accommodation & Food Services in Ballwin is 4.6%.
What is the Percentage of Population Employed in Accommodation & Food Services in Missouri?
Percentage of Population Employed in Accommodation & Food Services in Missouri is 6.6%.
What is the Percentage of Population Employed in Accommodation & Food Services in the United States?
Percentage of Population Employed in Accommodation & Food Services in the United States is 6.9%.