Zip Codes with the Highest Percentage of Households with Income Above $200,000 in Chicopee, MA
RELATED REPORTS & OPTIONS
Household Income | $200k+
Chicopee
Compare Zip Codes
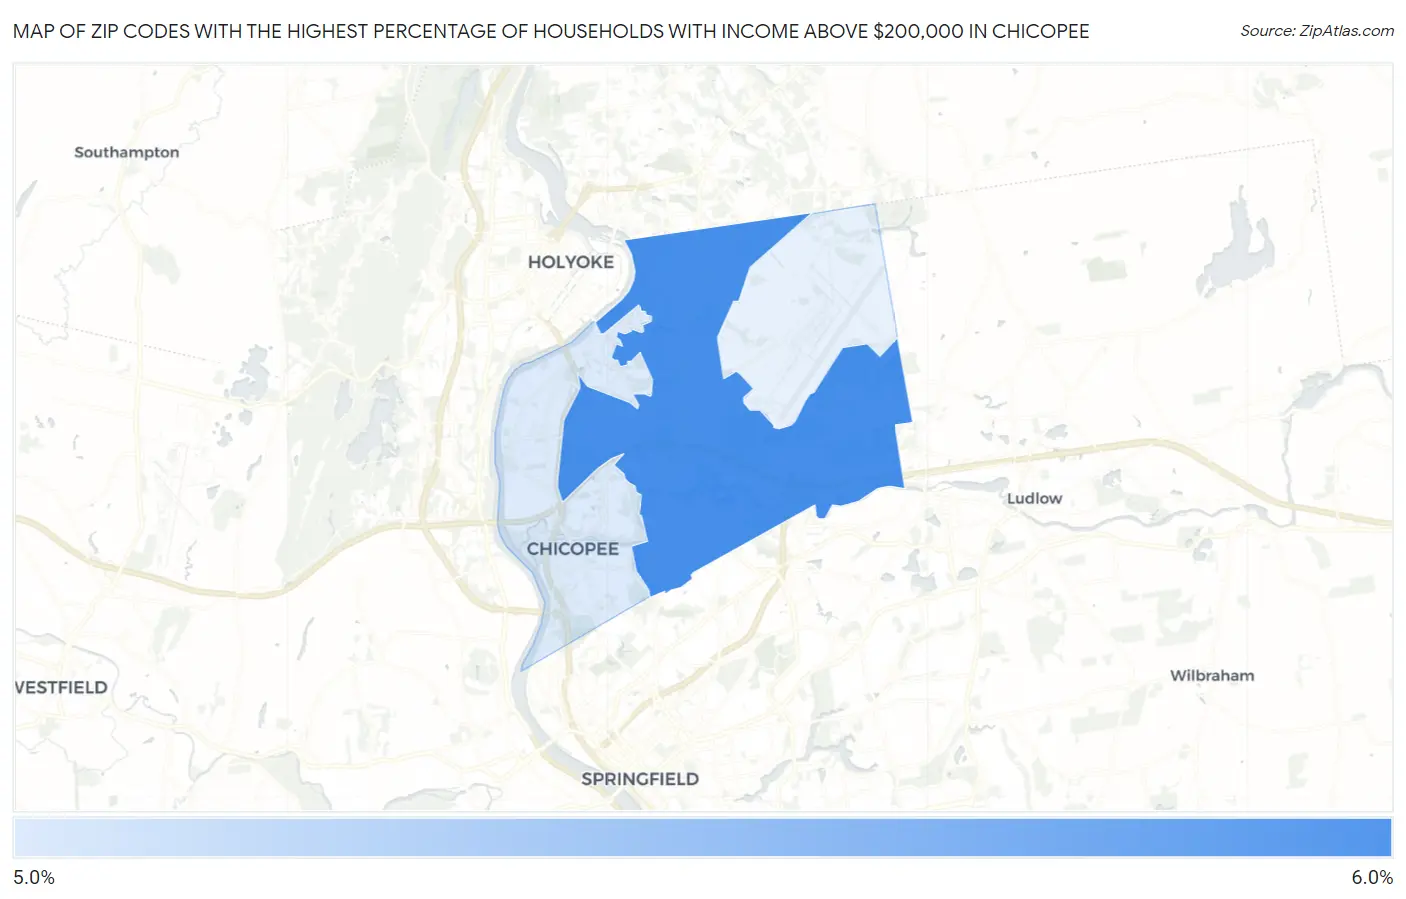
Map of Zip Codes with the Highest Percentage of Households with Income Above $200,000 in Chicopee
5.2%
5.7%
Zip Codes with the Highest Percentage of Households with Income Above $200,000 in Chicopee, MA
| Zip Code | Households with Income > $200k | vs State | vs National | |
| 1. | 01020 | 5.7% | 19.3%(-13.6)#452 | 11.4%(-5.70)#14,069 |
| 2. | 01013 | 5.2% | 19.3%(-14.1)#464 | 11.4%(-6.20)#15,108 |
1
Common Questions
What are the Top Zip Codes with the Highest Percentage of Households with Income Above $200,000 in Chicopee, MA?
Top Zip Codes with the Highest Percentage of Households with Income Above $200,000 in Chicopee, MA are:
What zip code has the Highest Percentage of Households with Income Above $200,000 in Chicopee, MA?
01020 has the Highest Percentage of Households with Income Above $200,000 in Chicopee, MA with 5.7%.
What is the Percentage of Households with Income Above $200,000 in Chicopee, MA?
Percentage of Households with Income Above $200,000 in Chicopee is 5.2%.
What is the Percentage of Households with Income Above $200,000 in Massachusetts?
Percentage of Households with Income Above $200,000 in Massachusetts is 19.3%.
What is the Percentage of Households with Income Above $200,000 in the United States?
Percentage of Households with Income Above $200,000 in the United States is 11.4%.