Zip Codes with the Highest Percentage of Population Employed in Accommodation & Food Services in Chicopee, MA
RELATED REPORTS & OPTIONS
Accommodation & Food Services
Chicopee
Compare Zip Codes
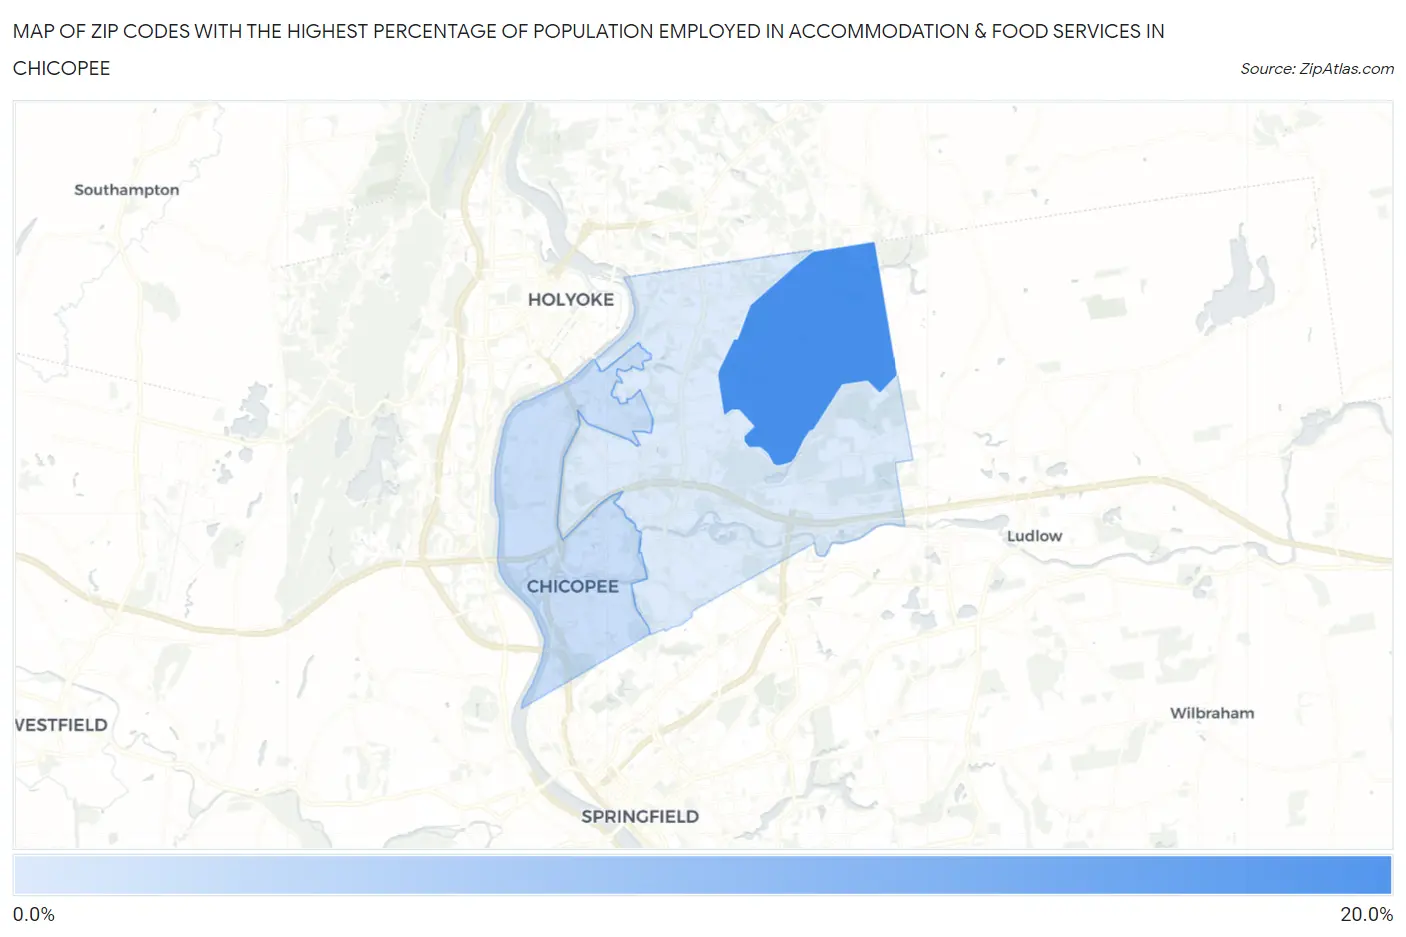
Map of Zip Codes with the Highest Percentage of Population Employed in Accommodation & Food Services in Chicopee
4.5%
19.6%
Zip Codes with the Highest Percentage of Population Employed in Accommodation & Food Services in Chicopee, MA
| Zip Code | % Employed | vs State | vs National | |
| 1. | 01022 | 19.6% | 5.8%(+13.8)#7 | 6.9%(+12.7)#876 |
| 2. | 01013 | 6.6% | 5.8%(+0.826)#159 | 6.9%(-0.292)#11,557 |
| 3. | 01020 | 4.5% | 5.8%(-1.22)#284 | 6.9%(-2.34)#18,364 |
1
Common Questions
What are the Top Zip Codes with the Highest Percentage of Population Employed in Accommodation & Food Services in Chicopee, MA?
Top Zip Codes with the Highest Percentage of Population Employed in Accommodation & Food Services in Chicopee, MA are:
What zip code has the Highest Percentage of Population Employed in Accommodation & Food Services in Chicopee, MA?
01022 has the Highest Percentage of Population Employed in Accommodation & Food Services in Chicopee, MA with 19.6%.
What is the Percentage of Population Employed in Accommodation & Food Services in Chicopee, MA?
Percentage of Population Employed in Accommodation & Food Services in Chicopee is 5.8%.
What is the Percentage of Population Employed in Accommodation & Food Services in Massachusetts?
Percentage of Population Employed in Accommodation & Food Services in Massachusetts is 5.8%.
What is the Percentage of Population Employed in Accommodation & Food Services in the United States?
Percentage of Population Employed in Accommodation & Food Services in the United States is 6.9%.