Zip Codes with the Highest Percentage of Households with Income Above $100,000 in Chicopee, MA
RELATED REPORTS & OPTIONS
Household Income | $100k+
Chicopee
Compare Zip Codes
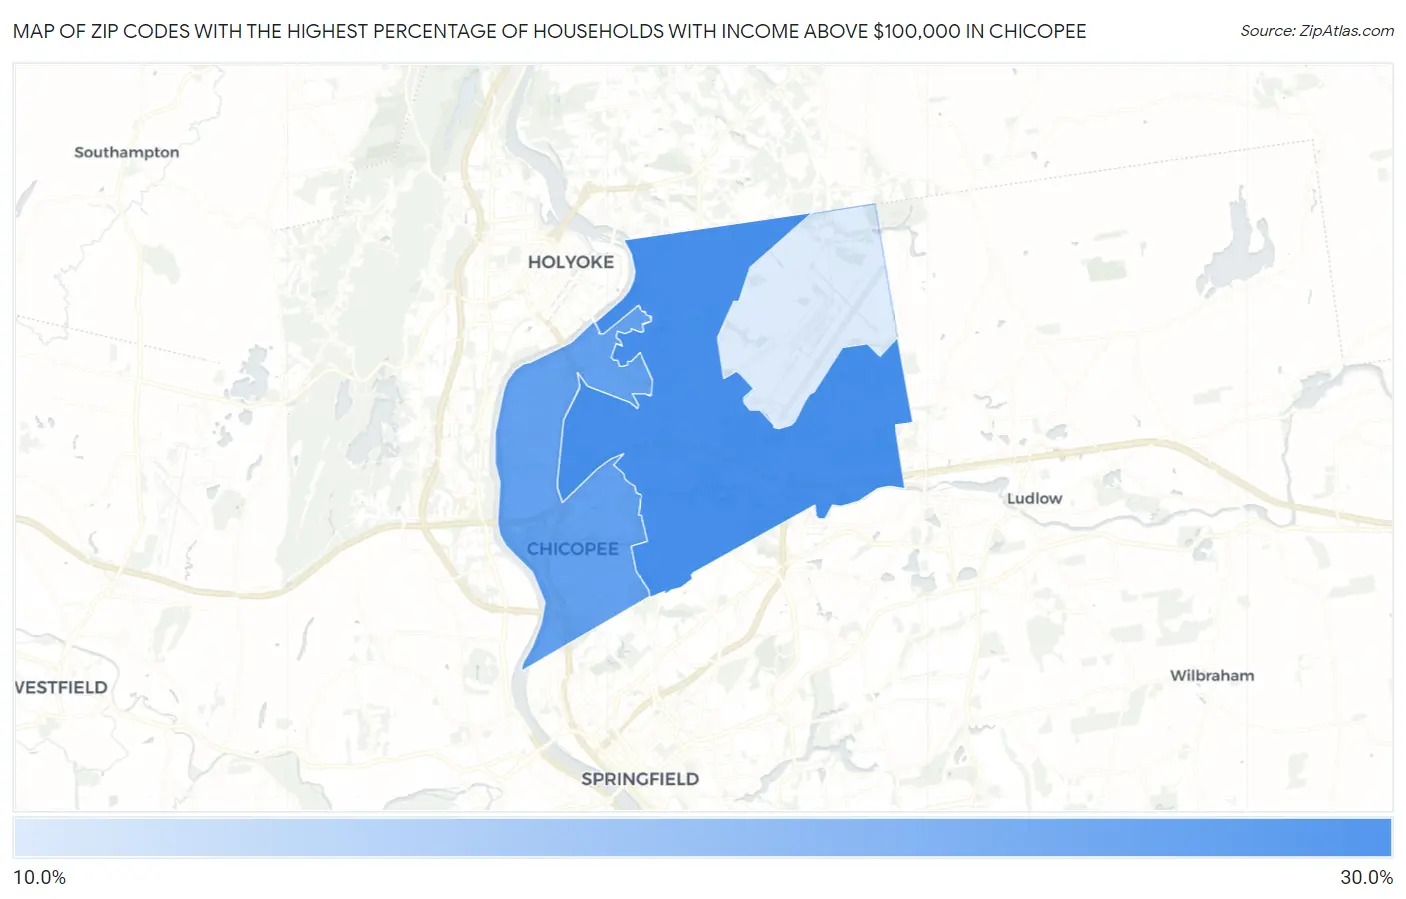
Map of Zip Codes with the Highest Percentage of Households with Income Above $100,000 in Chicopee
14.9%
29.8%
Zip Codes with the Highest Percentage of Households with Income Above $100,000 in Chicopee, MA
| Zip Code | Households with Income > $100k | vs State | vs National | |
| 1. | 01020 | 29.8% | 48.6%(-18.8)#460 | 37.3%(-7.50)#15,574 |
| 2. | 01013 | 27.0% | 48.6%(-21.6)#473 | 37.3%(-10.3)#17,989 |
| 3. | 01022 | 14.9% | 48.6%(-33.7)#518 | 37.3%(-22.4)#27,624 |
1
Common Questions
What are the Top Zip Codes with the Highest Percentage of Households with Income Above $100,000 in Chicopee, MA?
Top Zip Codes with the Highest Percentage of Households with Income Above $100,000 in Chicopee, MA are:
What zip code has the Highest Percentage of Households with Income Above $100,000 in Chicopee, MA?
01020 has the Highest Percentage of Households with Income Above $100,000 in Chicopee, MA with 29.8%.
What is the Percentage of Households with Income Above $100,000 in Chicopee, MA?
Percentage of Households with Income Above $100,000 in Chicopee is 28.0%.
What is the Percentage of Households with Income Above $100,000 in Massachusetts?
Percentage of Households with Income Above $100,000 in Massachusetts is 48.6%.
What is the Percentage of Households with Income Above $100,000 in the United States?
Percentage of Households with Income Above $100,000 in the United States is 37.3%.