Zip Codes with the Highest Percentage of Population Employed in Architecture & Engineering in Chicopee, MA
RELATED REPORTS & OPTIONS
Architecture & Engineering
Chicopee
Compare Zip Codes
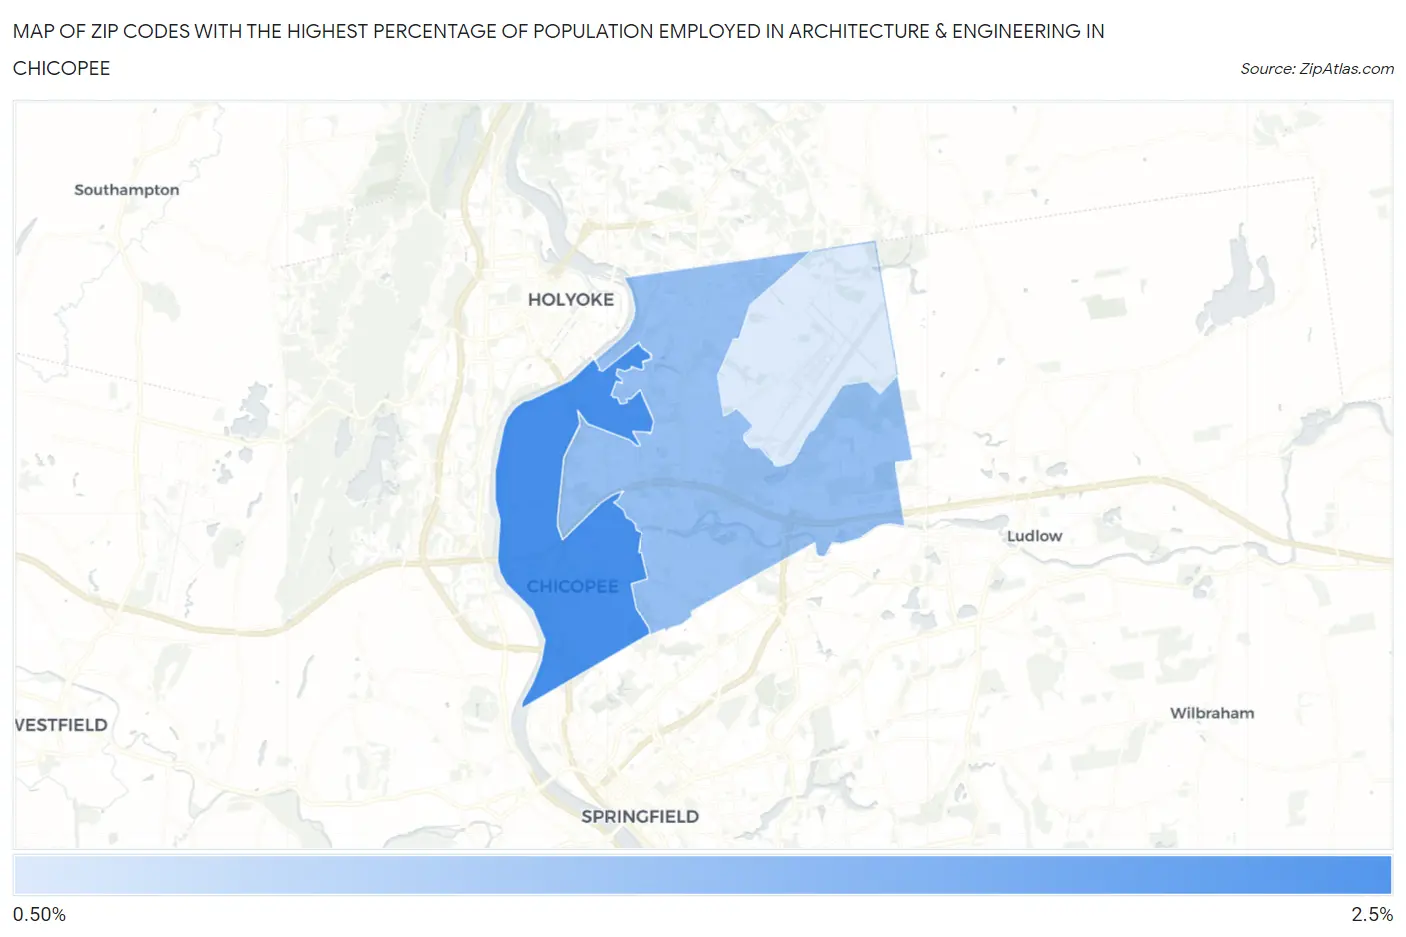
Map of Zip Codes with the Highest Percentage of Population Employed in Architecture & Engineering in Chicopee
1.5%
2.3%
Zip Codes with the Highest Percentage of Population Employed in Architecture & Engineering in Chicopee, MA
| Zip Code | % Employed | vs State | vs National | |
| 1. | 01013 | 2.3% | 2.7%(-0.360)#250 | 2.1%(+0.164)#7,876 |
| 2. | 01020 | 1.9% | 2.7%(-0.818)#313 | 2.1%(-0.293)#10,509 |
| 3. | 01022 | 1.5% | 2.7%(-1.22)#369 | 2.1%(-0.696)#13,215 |
1
Common Questions
What are the Top Zip Codes with the Highest Percentage of Population Employed in Architecture & Engineering in Chicopee, MA?
Top Zip Codes with the Highest Percentage of Population Employed in Architecture & Engineering in Chicopee, MA are:
What zip code has the Highest Percentage of Population Employed in Architecture & Engineering in Chicopee, MA?
01013 has the Highest Percentage of Population Employed in Architecture & Engineering in Chicopee, MA with 2.3%.
What is the Percentage of Population Employed in Architecture & Engineering in Chicopee, MA?
Percentage of Population Employed in Architecture & Engineering in Chicopee is 2.0%.
What is the Percentage of Population Employed in Architecture & Engineering in Massachusetts?
Percentage of Population Employed in Architecture & Engineering in Massachusetts is 2.7%.
What is the Percentage of Population Employed in Architecture & Engineering in the United States?
Percentage of Population Employed in Architecture & Engineering in the United States is 2.1%.