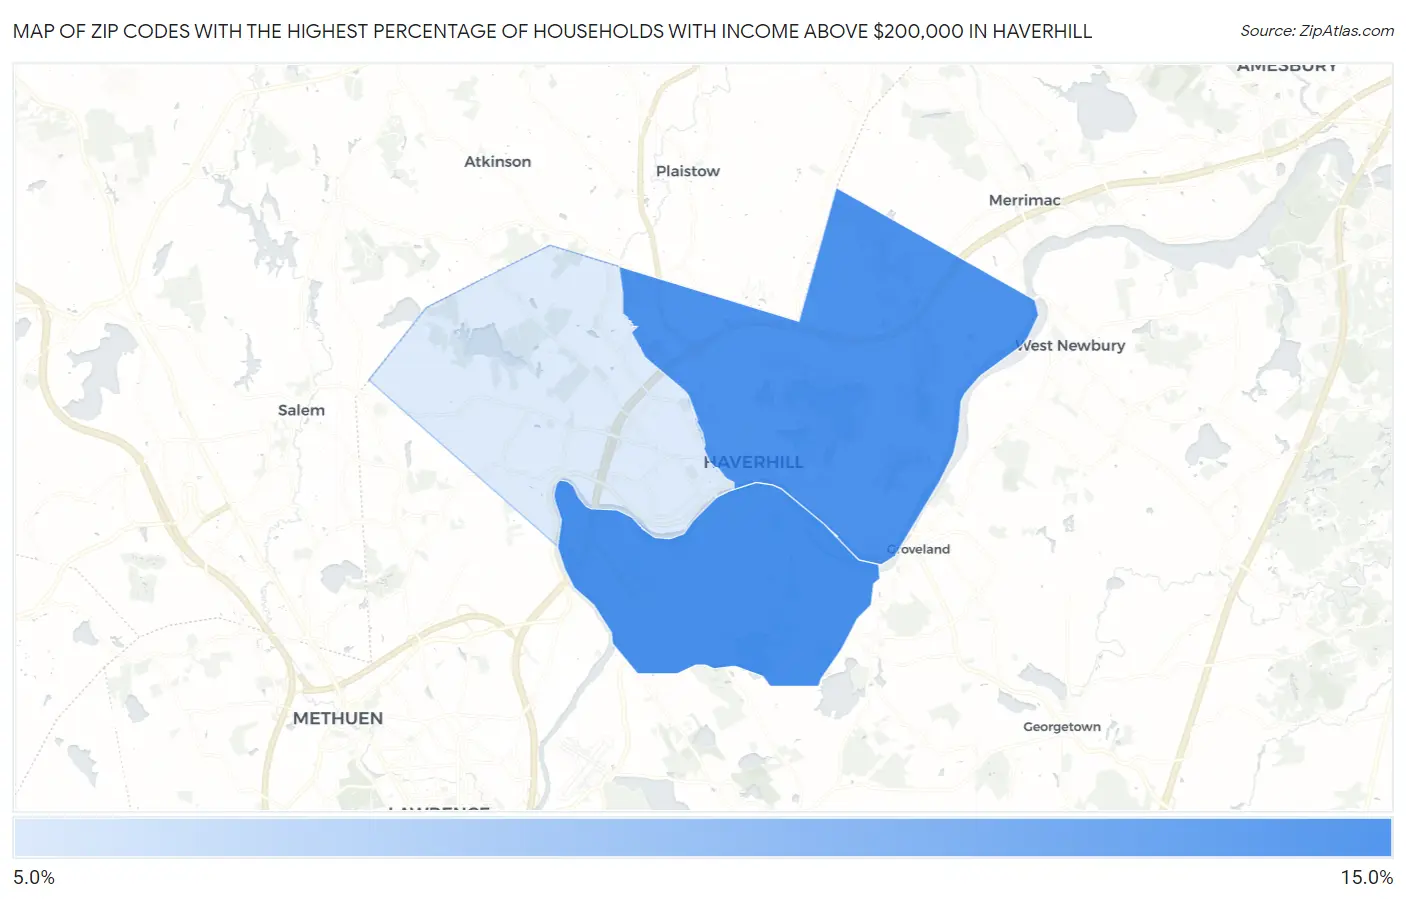
Zip Codes with the Highest Percentage of Households with Income Above $200,000 in Haverhill, MA
RELATED REPORTS & OPTIONS
Household Income | $200k+
Haverhill
Compare Zip Codes
Map of Zip Codes with the Highest Percentage of Households with Income Above $200,000 in Haverhill
7.4%
11.4%
Zip Codes with the Highest Percentage of Households with Income Above $200,000 in Haverhill, MA
| Zip Code | Households with Income > $200k | vs State | vs National | |
| 1. | 01835 | 11.4% | 19.3%(-7.90)#355 | 11.4%(=0.000)#7,092 |
| 2. | 01830 | 11.3% | 19.3%(-8.00)#358 | 11.4%(-0.100)#7,153 |
| 3. | 01832 | 7.4% | 19.3%(-11.9)#425 | 11.4%(-4.00)#11,197 |
1
Common Questions
What are the Top Zip Codes with the Highest Percentage of Households with Income Above $200,000 in Haverhill, MA?
Top Zip Codes with the Highest Percentage of Households with Income Above $200,000 in Haverhill, MA are:
What zip code has the Highest Percentage of Households with Income Above $200,000 in Haverhill, MA?
01835 has the Highest Percentage of Households with Income Above $200,000 in Haverhill, MA with 11.4%.
What is the Percentage of Households with Income Above $200,000 in Haverhill, MA?
Percentage of Households with Income Above $200,000 in Haverhill is 9.8%.
What is the Percentage of Households with Income Above $200,000 in Massachusetts?
Percentage of Households with Income Above $200,000 in Massachusetts is 19.3%.
What is the Percentage of Households with Income Above $200,000 in the United States?
Percentage of Households with Income Above $200,000 in the United States is 11.4%.