Zip Codes with the Highest Percentage of Population Taking Taxi / Cab to Work in Chicopee, MA
RELATED REPORTS & OPTIONS
Taxi / Cab
Chicopee
Compare Zip Codes
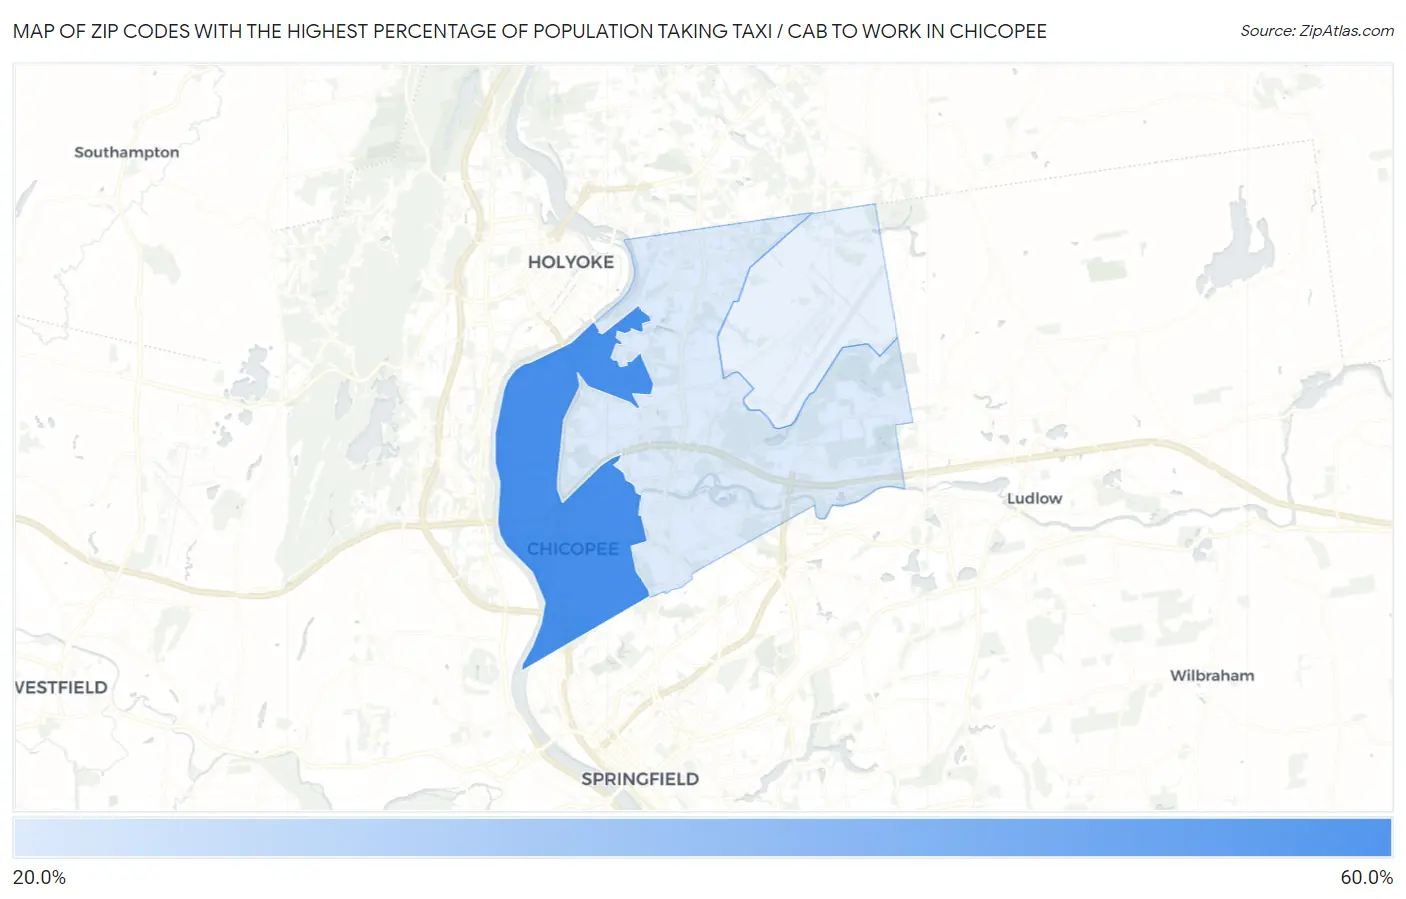
Map of Zip Codes with the Highest Percentage of Population Taking Taxi / Cab to Work in Chicopee
23.7%
55.2%
Zip Codes with the Highest Percentage of Population Taking Taxi / Cab to Work in Chicopee, MA
| Zip Code | % Take Taxi / Cab | vs State | vs National | |
| 1. | 01013 | 55.2% | 35.1%(+20.1)#30 | 38.2%(+17.0)#1,547 |
| 2. | 01020 | 23.7% | 35.1%(-11.4)#272 | 38.2%(-14.5)#12,513 |
1
Common Questions
What are the Top Zip Codes with the Highest Percentage of Population Taking Taxi / Cab to Work in Chicopee, MA?
Top Zip Codes with the Highest Percentage of Population Taking Taxi / Cab to Work in Chicopee, MA are:
What zip code has the Highest Percentage of Population Taking Taxi / Cab to Work in Chicopee, MA?
01013 has the Highest Percentage of Population Taking Taxi / Cab to Work in Chicopee, MA with 55.2%.
What is the Percentage of Population Taking Taxi / Cab to Work in Chicopee, MA?
Percentage of Population Taking Taxi / Cab to Work in Chicopee is 51.6%.
What is the Percentage of Population Taking Taxi / Cab to Work in Massachusetts?
Percentage of Population Taking Taxi / Cab to Work in Massachusetts is 35.1%.
What is the Percentage of Population Taking Taxi / Cab to Work in the United States?
Percentage of Population Taking Taxi / Cab to Work in the United States is 38.2%.