Zip Codes with the Highest Percentage of Households with Income Above $200,000 in Springfield, MA
RELATED REPORTS & OPTIONS
Household Income | $200k+
Springfield
Compare Zip Codes
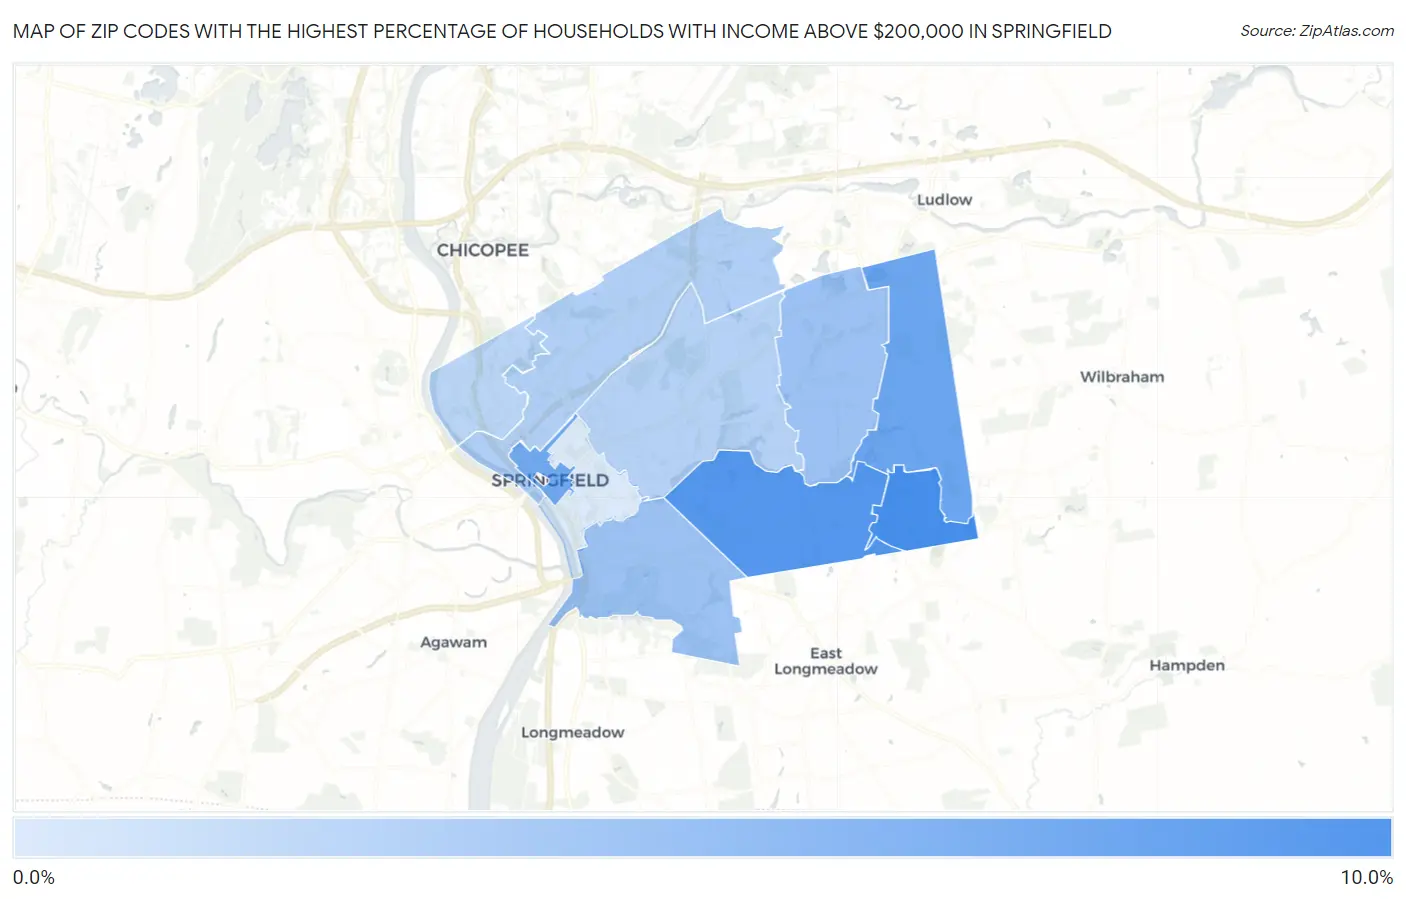
Map of Zip Codes with the Highest Percentage of Households with Income Above $200,000 in Springfield
0.80%
9.5%
Zip Codes with the Highest Percentage of Households with Income Above $200,000 in Springfield, MA
| Zip Code | Households with Income > $200k | vs State | vs National | |
| 1. | 01128 | 9.5% | 19.3%(-9.80)#396 | 11.4%(-1.90)#8,778 |
| 2. | 01118 | 8.7% | 19.3%(-10.6)#405 | 11.4%(-2.70)#9,547 |
| 3. | 01129 | 7.3% | 19.3%(-12.0)#427 | 11.4%(-4.10)#11,385 |
| 4. | 01103 | 7.0% | 19.3%(-12.3)#432 | 11.4%(-4.40)#11,835 |
| 5. | 01108 | 4.6% | 19.3%(-14.7)#470 | 11.4%(-6.80)#16,535 |
| 6. | 01119 | 4.4% | 19.3%(-14.9)#475 | 11.4%(-7.00)#17,062 |
| 7. | 01104 | 3.3% | 19.3%(-16.0)#489 | 11.4%(-8.10)#20,036 |
| 8. | 01109 | 3.0% | 19.3%(-16.3)#492 | 11.4%(-8.40)#20,885 |
| 9. | 01107 | 2.8% | 19.3%(-16.5)#498 | 11.4%(-8.60)#21,475 |
| 10. | 01105 | 0.80% | 19.3%(-18.5)#507 | 11.4%(-10.6)#26,553 |
1
Common Questions
What are the Top 5 Zip Codes with the Highest Percentage of Households with Income Above $200,000 in Springfield, MA?
Top 5 Zip Codes with the Highest Percentage of Households with Income Above $200,000 in Springfield, MA are:
What zip code has the Highest Percentage of Households with Income Above $200,000 in Springfield, MA?
01128 has the Highest Percentage of Households with Income Above $200,000 in Springfield, MA with 9.5%.
What is the Percentage of Households with Income Above $200,000 in Springfield, MA?
Percentage of Households with Income Above $200,000 in Springfield is 4.1%.
What is the Percentage of Households with Income Above $200,000 in Massachusetts?
Percentage of Households with Income Above $200,000 in Massachusetts is 19.3%.
What is the Percentage of Households with Income Above $200,000 in the United States?
Percentage of Households with Income Above $200,000 in the United States is 11.4%.