Zip Codes with the Highest Percentage of Households with Income Above $200,000 in New Bedford, MA
RELATED REPORTS & OPTIONS
Household Income | $200k+
New Bedford
Compare Zip Codes
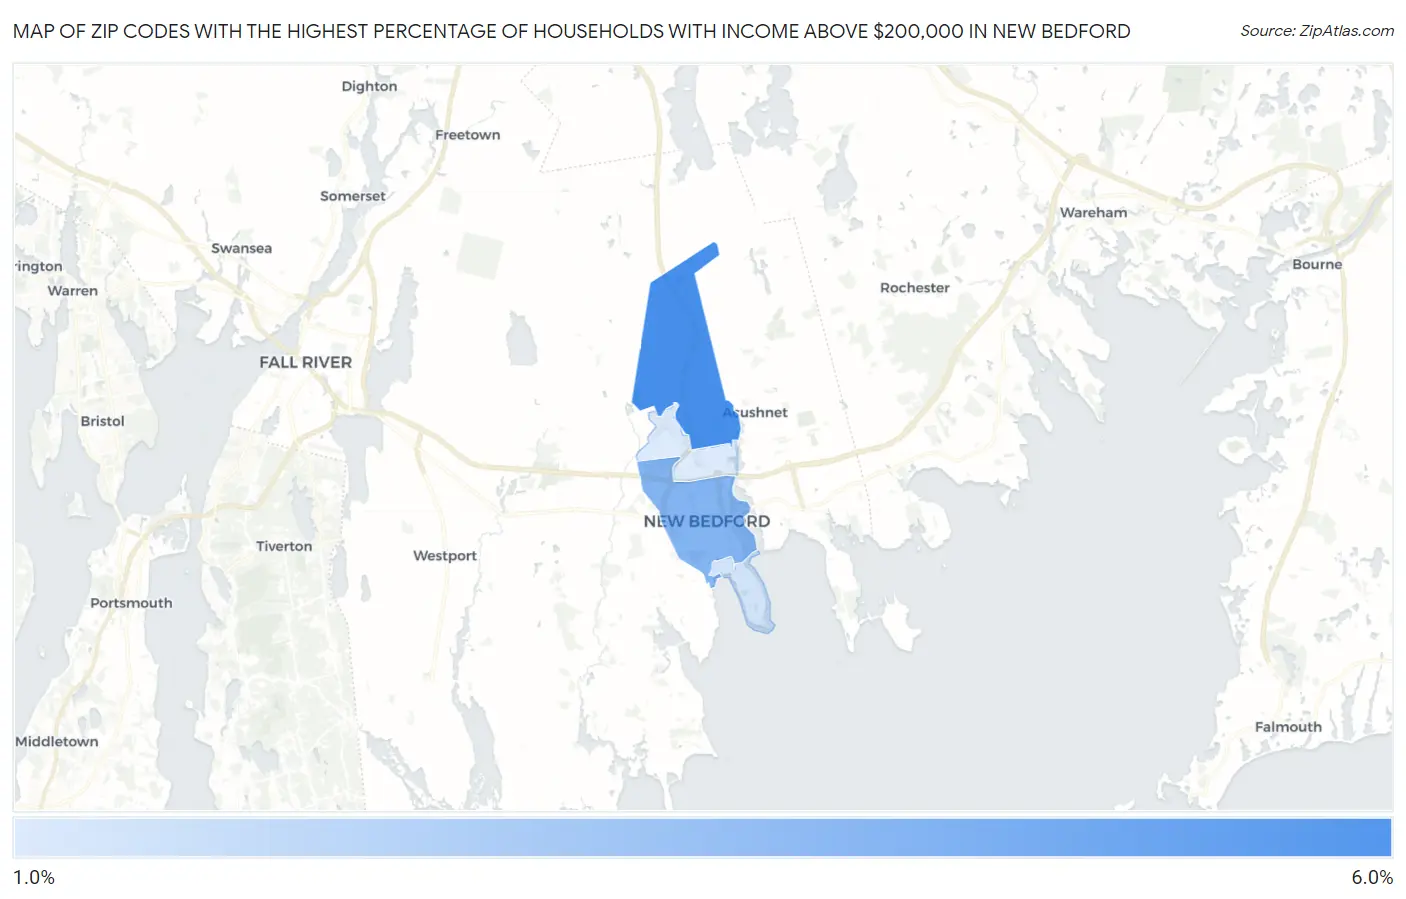
Map of Zip Codes with the Highest Percentage of Households with Income Above $200,000 in New Bedford
1.9%
5.6%
Zip Codes with the Highest Percentage of Households with Income Above $200,000 in New Bedford, MA
| Zip Code | Households with Income > $200k | vs State | vs National | |
| 1. | 02745 | 5.6% | 19.3%(-13.7)#455 | 11.4%(-5.80)#14,283 |
| 2. | 02740 | 4.1% | 19.3%(-15.2)#480 | 11.4%(-7.30)#17,798 |
| 3. | 02744 | 2.2% | 19.3%(-17.1)#501 | 11.4%(-9.20)#23,223 |
| 4. | 02746 | 1.9% | 19.3%(-17.4)#503 | 11.4%(-9.50)#24,066 |
1
Common Questions
What are the Top 3 Zip Codes with the Highest Percentage of Households with Income Above $200,000 in New Bedford, MA?
Top 3 Zip Codes with the Highest Percentage of Households with Income Above $200,000 in New Bedford, MA are:
What zip code has the Highest Percentage of Households with Income Above $200,000 in New Bedford, MA?
02745 has the Highest Percentage of Households with Income Above $200,000 in New Bedford, MA with 5.6%.
What is the Percentage of Households with Income Above $200,000 in New Bedford, MA?
Percentage of Households with Income Above $200,000 in New Bedford is 3.9%.
What is the Percentage of Households with Income Above $200,000 in Massachusetts?
Percentage of Households with Income Above $200,000 in Massachusetts is 19.3%.
What is the Percentage of Households with Income Above $200,000 in the United States?
Percentage of Households with Income Above $200,000 in the United States is 11.4%.