Zip Codes with the Highest Percentage of Population Employed in Health Diagnosing & Treating in Chicopee, MA
RELATED REPORTS & OPTIONS
Health Diagnosing & Treating
Chicopee
Compare Zip Codes
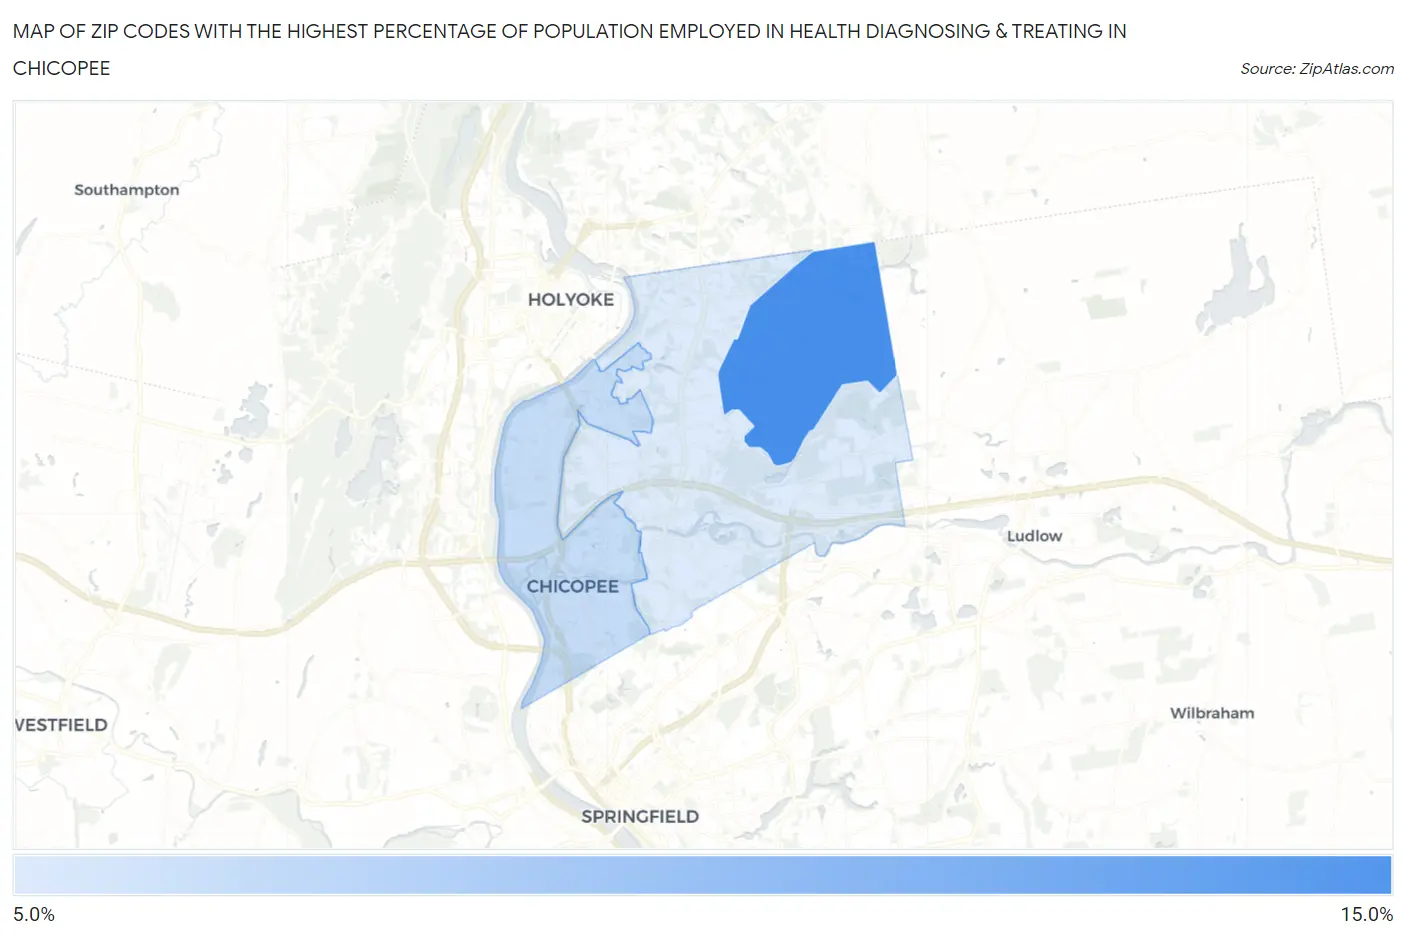
Map of Zip Codes with the Highest Percentage of Population Employed in Health Diagnosing & Treating in Chicopee
5.9%
10.4%
Zip Codes with the Highest Percentage of Population Employed in Health Diagnosing & Treating in Chicopee, MA
| Zip Code | % Employed | vs State | vs National | |
| 1. | 01022 | 10.4% | 6.9%(+3.53)#72 | 6.2%(+4.19)#3,375 |
| 2. | 01013 | 6.6% | 6.9%(-0.324)#273 | 6.2%(+0.335)#11,745 |
| 3. | 01020 | 5.9% | 6.9%(-1.01)#340 | 6.2%(-0.352)#14,247 |
1
Common Questions
What are the Top Zip Codes with the Highest Percentage of Population Employed in Health Diagnosing & Treating in Chicopee, MA?
Top Zip Codes with the Highest Percentage of Population Employed in Health Diagnosing & Treating in Chicopee, MA are:
What zip code has the Highest Percentage of Population Employed in Health Diagnosing & Treating in Chicopee, MA?
01022 has the Highest Percentage of Population Employed in Health Diagnosing & Treating in Chicopee, MA with 10.4%.
What is the Percentage of Population Employed in Health Diagnosing & Treating in Chicopee, MA?
Percentage of Population Employed in Health Diagnosing & Treating in Chicopee is 6.3%.
What is the Percentage of Population Employed in Health Diagnosing & Treating in Massachusetts?
Percentage of Population Employed in Health Diagnosing & Treating in Massachusetts is 6.9%.
What is the Percentage of Population Employed in Health Diagnosing & Treating in the United States?
Percentage of Population Employed in Health Diagnosing & Treating in the United States is 6.2%.