Zip Codes with the Highest Percentage of Mexican Population in Kansas City, KS

RELATED REPORTS & OPTIONS

Mexican
Population
Families and Households
Female Fertility
Female Fertility (Unmarried)
Race (Community Size)
Race (Percentage)
Ancestry (Community Size)
AfricanAmericanApacheArabArmenianAustralianAustrianBangladeshiBelgianBhutaneseBlackfeetBrazilianBritishBurmeseCajunCanadianCentral AmericanCentral American IndianCherokeeChickasawChoctawColombianCreekCroatianCubanCzechCzechoslovakianDanishDominicanDutchEastern EuropeanEcuadorianEnglishEuropeanFrenchFrench CanadianGermanGerman RussianGreekGuatemalanHaitianHonduranHungarianIndian (Asian)IndonesianIranianIrishIroquoisItalianJamaicanKoreanLithuanianMalaysianMexicanMexican American IndianNative HawaiianNicaraguanNigerianNorthern EuropeanNorwegianOsagePakistaniPeruvianPolishPortuguesePotawatomiPuerto RicanRomanianRussianSalvadoranScandinavianScotch-IrishScottishSerbianSiouxSlavicSlovakSloveneSomaliSouth AmericanSpaniardSpanishSri LankanSubsaharan AfricanSwedishSwissThaiUkrainianWelshWest IndianYugoslavian
Ancestry (Percentage)
AfricanAmericanApacheArabArmenianAustralianAustrianBangladeshiBelgianBhutaneseBlackfeetBrazilianBritishBurmeseCajunCanadianCentral AmericanCentral American IndianCherokeeChickasawChoctawColombianCreekCroatianCubanCzechCzechoslovakianDanishDominicanDutchEastern EuropeanEcuadorianEnglishEuropeanFrenchFrench CanadianGermanGerman RussianGreekGuatemalanHaitianHonduranHungarianIndian (Asian)IndonesianIranianIrishIroquoisItalianJamaicanKoreanLithuanianMalaysianMexicanMexican American IndianNative HawaiianNicaraguanNigerianNorthern EuropeanNorwegianOsagePakistaniPeruvianPolishPortuguesePotawatomiPuerto RicanRomanianRussianSalvadoranScandinavianScotch-IrishScottishSerbianSiouxSlavicSlovakSloveneSomaliSouth AmericanSpaniardSpanishSri LankanSubsaharan AfricanSwedishSwissThaiUkrainianWelshWest IndianYugoslavian
Immigrant Origin (Total)
Immigrant Origin (Percentage)
Income
Income (Families)
Income (Households)
Poverty
Poverty (Families)
Unemployment
Employment Occupations
Employment Industries
Employer Class
Commute Time
Commute Means
School Enrollment
Education by Degree Field
Occupancy
Finances
Physical Characteristics
Kansas City
Compare Zip Codes
Comparison Subject

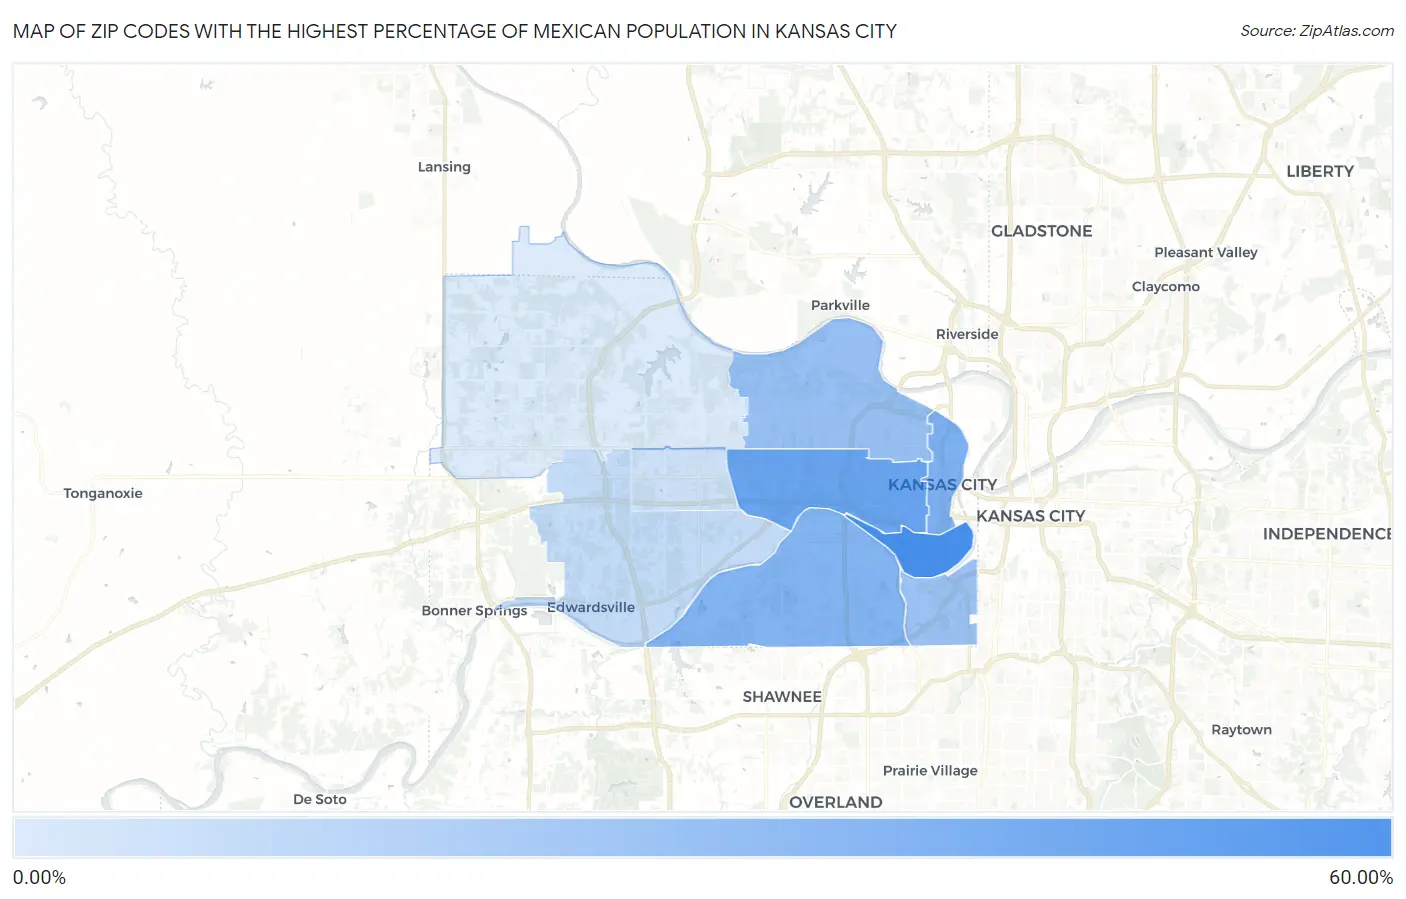
Map of Zip Codes with the Highest Percentage of Mexican Population in Kansas City

0.00%
60.00%
Zip Codes with the Highest Percentage of Mexican Population in Kansas City Map

Zip Codes with the Highest Percentage of Mexican Population in Kansas City, KS

Zip Code Mexican vs State vs National
1.6610552.31%9.97%(+42.3)#511.22%(+41.1)#783
2.6610240.57%9.97%(+30.6)#1211.22%(+29.4)#1,216
3.6610133.94%9.97%(+24.0)#2111.22%(+22.7)#1,583
4.6610632.52%9.97%(+22.6)#2411.22%(+21.3)#1,691
5.6610426.44%9.97%(+16.5)#3211.22%(+15.2)#2,152
6.6610326.10%9.97%(+16.1)#3311.22%(+14.9)#2,182
7.6611114.25%9.97%(+4.27)#6911.22%(+3.03)#3,931
8.6611211.53%9.97%(+1.56)#9511.22%(+0.315)#4,694
9.661098.08%9.97%(-1.89)#14311.22%(-3.14)#6,198

Common Questions

What are the Top 5 Zip Codes with the Highest Percentage of Mexican Population in Kansas City, KS?
Top 5 Zip Codes with the Highest Percentage of Mexican Population in Kansas City, KS are:
#1
52.31%
#2
40.57%
#3
33.94%
#4
32.52%
#5
26.44%
What zip code has the Highest Percentage of Mexican Population in Kansas City, KS?
66105 has the Highest Percentage of Mexican Population in Kansas City, KS with 52.31%.
What is the Percentage of Mexican Population in Kansas City, KS?
Percentage of Mexican Population in Kansas City is 26.05%.
What is the Percentage of Mexican Population in Kansas?
Percentage of Mexican Population in Kansas is 9.97%.
What is the Percentage of Mexican Population in the United States?
Percentage of Mexican Population in the United States is 11.22%.