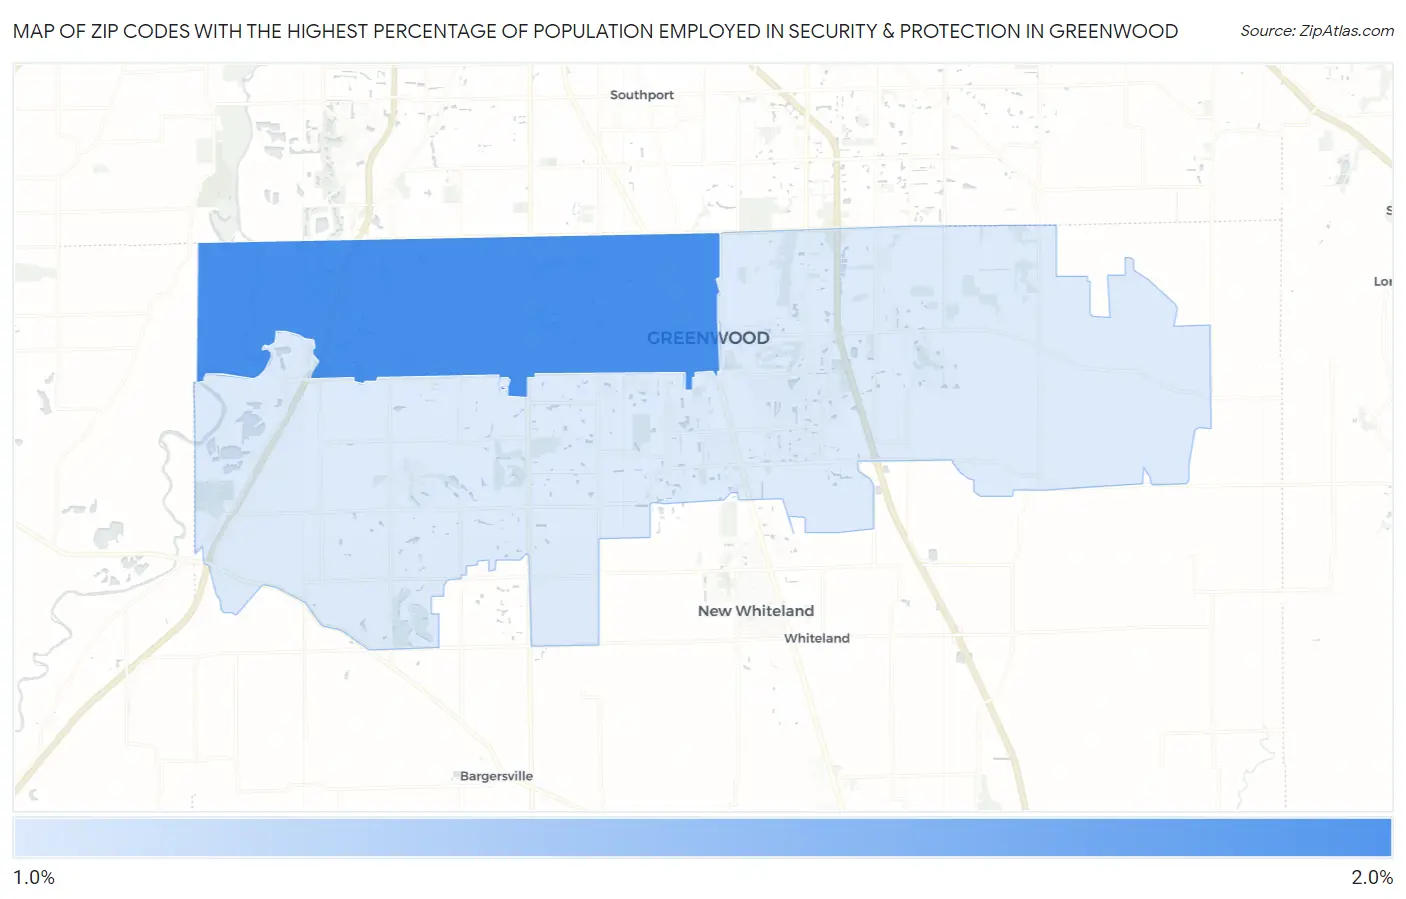
Zip Codes with the Highest Percentage of Population Employed in Security & Protection in Greenwood, IN
RELATED REPORTS & OPTIONS
Security & Protection
Greenwood
Compare Zip Codes
Map of Zip Codes with the Highest Percentage of Population Employed in Security & Protection in Greenwood
1.6%
1.7%
Zip Codes with the Highest Percentage of Population Employed in Security & Protection in Greenwood, IN
| Zip Code | % Employed | vs State | vs National | |
| 1. | 46142 | 1.7% | 1.8%(-0.108)#321 | 2.1%(-0.482)#14,935 |
| 2. | 46143 | 1.6% | 1.8%(-0.173)#333 | 2.1%(-0.546)#15,401 |
1
Common Questions
What are the Top Zip Codes with the Highest Percentage of Population Employed in Security & Protection in Greenwood, IN?
Top Zip Codes with the Highest Percentage of Population Employed in Security & Protection in Greenwood, IN are:
What zip code has the Highest Percentage of Population Employed in Security & Protection in Greenwood, IN?
46142 has the Highest Percentage of Population Employed in Security & Protection in Greenwood, IN with 1.7%.
What is the Percentage of Population Employed in Security & Protection in Greenwood, IN?
Percentage of Population Employed in Security & Protection in Greenwood is 1.2%.
What is the Percentage of Population Employed in Security & Protection in Indiana?
Percentage of Population Employed in Security & Protection in Indiana is 1.8%.
What is the Percentage of Population Employed in Security & Protection in the United States?
Percentage of Population Employed in Security & Protection in the United States is 2.1%.