Zip Codes with the Highest Percentage of Population Employed in Education Instruction & Library in Greenwood, IN
RELATED REPORTS & OPTIONS
Education Instruction & Library
Greenwood
Compare Zip Codes
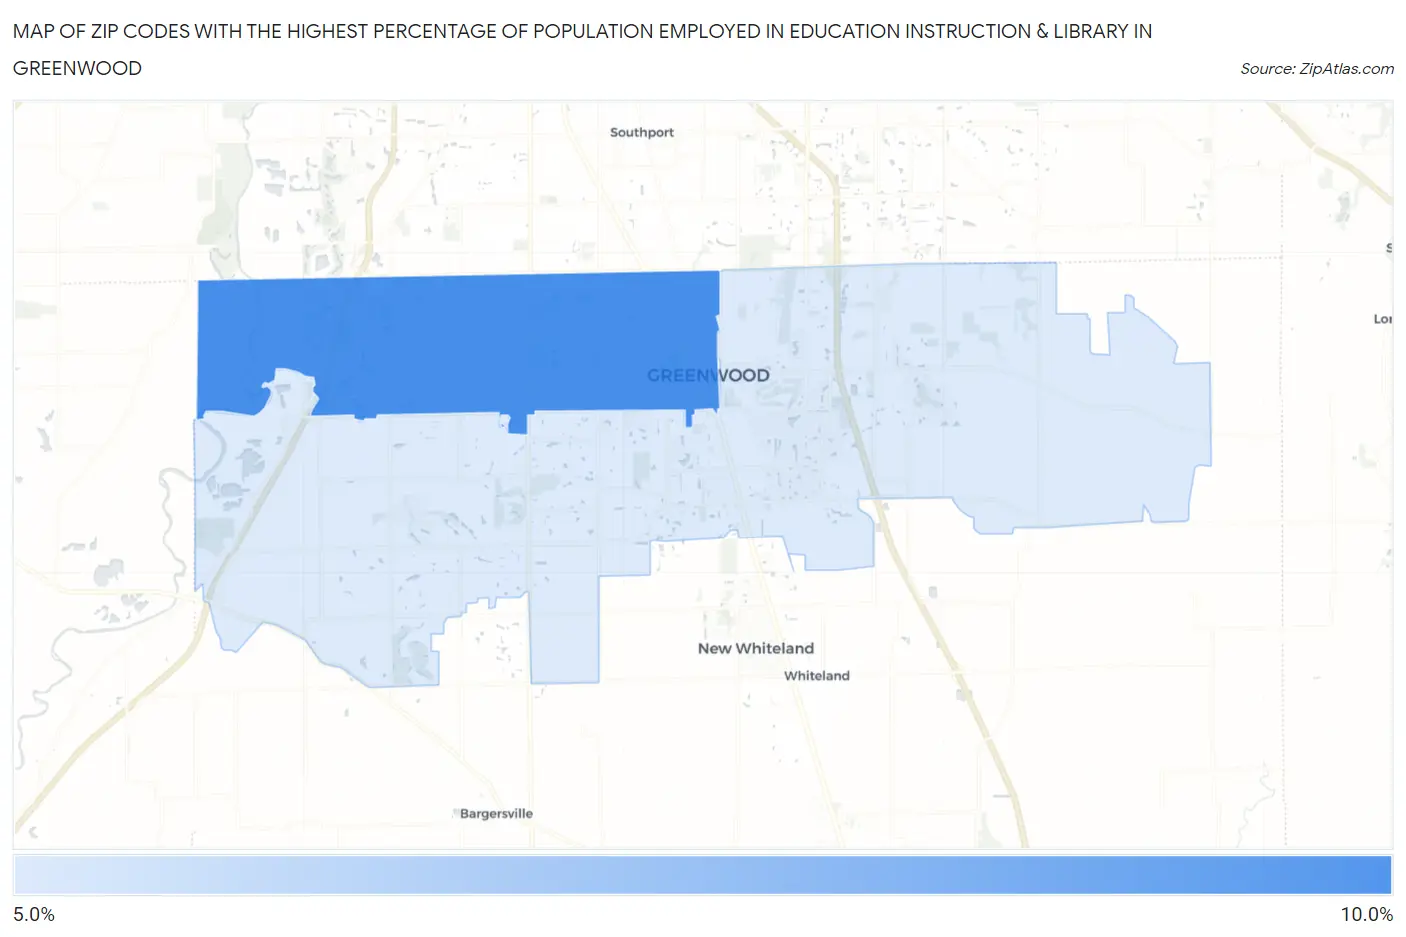
Map of Zip Codes with the Highest Percentage of Population Employed in Education Instruction & Library in Greenwood
5.3%
8.3%
Zip Codes with the Highest Percentage of Population Employed in Education Instruction & Library in Greenwood, IN
| Zip Code | % Employed | vs State | vs National | |
| 1. | 46142 | 8.3% | 5.8%(+2.53)#86 | 6.2%(+2.10)#6,552 |
| 2. | 46143 | 5.3% | 5.8%(-0.466)#291 | 6.2%(-0.891)#16,408 |
1
Common Questions
What are the Top Zip Codes with the Highest Percentage of Population Employed in Education Instruction & Library in Greenwood, IN?
Top Zip Codes with the Highest Percentage of Population Employed in Education Instruction & Library in Greenwood, IN are:
What zip code has the Highest Percentage of Population Employed in Education Instruction & Library in Greenwood, IN?
46142 has the Highest Percentage of Population Employed in Education Instruction & Library in Greenwood, IN with 8.3%.
What is the Percentage of Population Employed in Education Instruction & Library in Greenwood, IN?
Percentage of Population Employed in Education Instruction & Library in Greenwood is 5.4%.
What is the Percentage of Population Employed in Education Instruction & Library in Indiana?
Percentage of Population Employed in Education Instruction & Library in Indiana is 5.8%.
What is the Percentage of Population Employed in Education Instruction & Library in the United States?
Percentage of Population Employed in Education Instruction & Library in the United States is 6.2%.