Zip Codes with the Highest Percentage of Population with a Degree in Arts and Humanities in Greenwood, IN
RELATED REPORTS & OPTIONS
Arts and Humanities
Greenwood
Compare Zip Codes
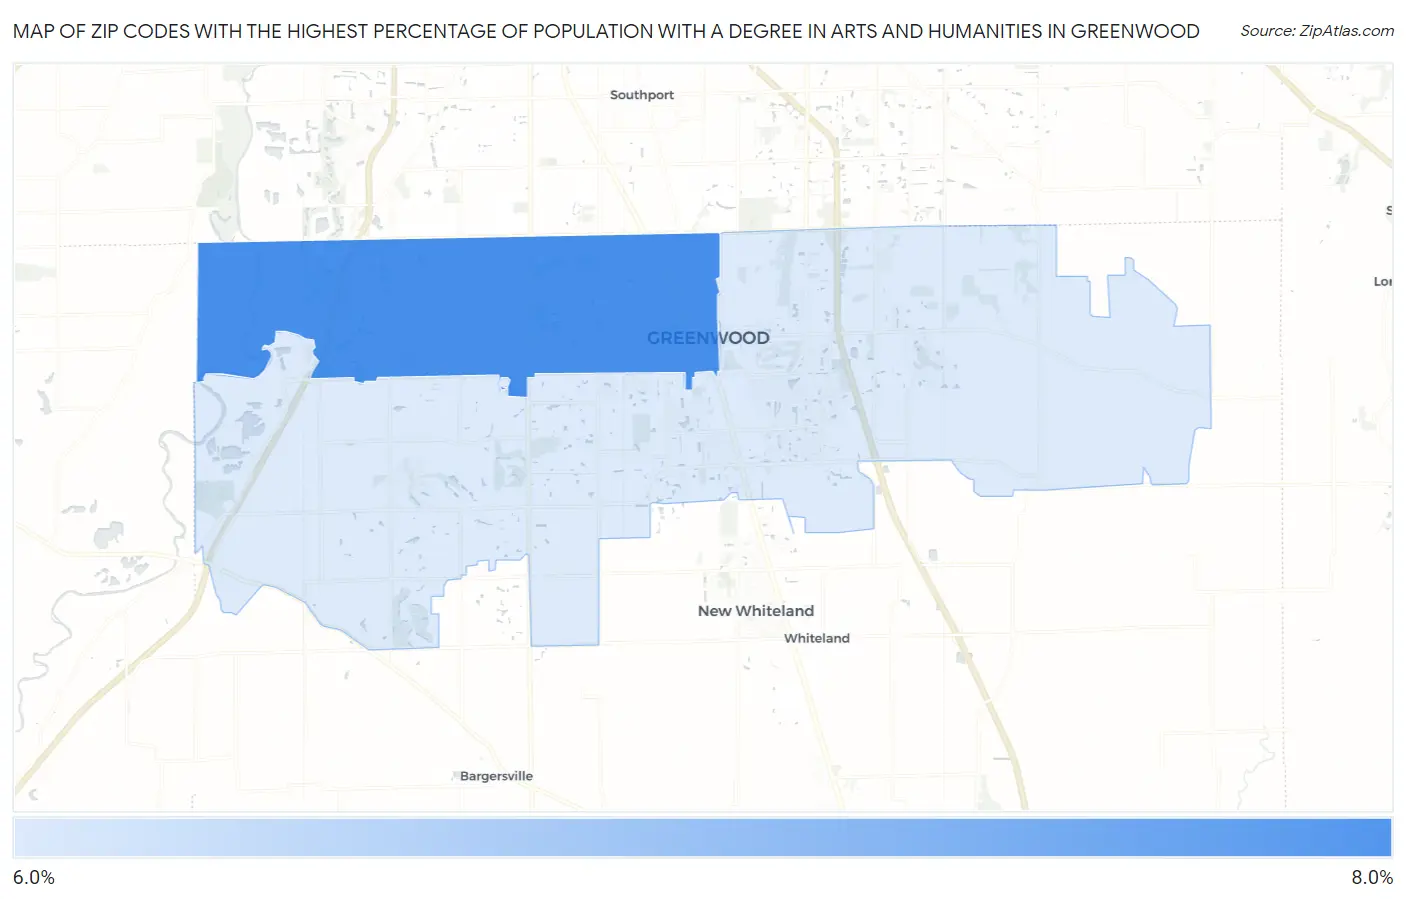
Map of Zip Codes with the Highest Percentage of Population with a Degree in Arts and Humanities in Greenwood
6.9%
7.3%
Zip Codes with the Highest Percentage of Population with a Degree in Arts and Humanities in Greenwood, IN
| Zip Code | % Graduates | vs State | vs National | |
| 1. | 46142 | 7.3% | 6.3%(+0.996)#255 | 6.0%(+1.31)#11,211 |
| 2. | 46143 | 6.9% | 6.3%(+0.636)#272 | 6.0%(+0.946)#12,115 |
1
Common Questions
What are the Top Zip Codes with the Highest Percentage of Population with a Degree in Arts and Humanities in Greenwood, IN?
Top Zip Codes with the Highest Percentage of Population with a Degree in Arts and Humanities in Greenwood, IN are:
What zip code has the Highest Percentage of Population with a Degree in Arts and Humanities in Greenwood, IN?
46142 has the Highest Percentage of Population with a Degree in Arts and Humanities in Greenwood, IN with 7.3%.
What is the Percentage of Population with a Degree in Arts and Humanities in Greenwood, IN?
Percentage of Population with a Degree in Arts and Humanities in Greenwood is 6.3%.
What is the Percentage of Population with a Degree in Arts and Humanities in Indiana?
Percentage of Population with a Degree in Arts and Humanities in Indiana is 6.3%.
What is the Percentage of Population with a Degree in Arts and Humanities in the United States?
Percentage of Population with a Degree in Arts and Humanities in the United States is 6.0%.