Zip Codes with the Highest Percentage of Self-Employed / Not Incorporated in Greenwood, IN
RELATED REPORTS & OPTIONS
Self-Employed / Not Incorporated
Greenwood
Compare Zip Codes
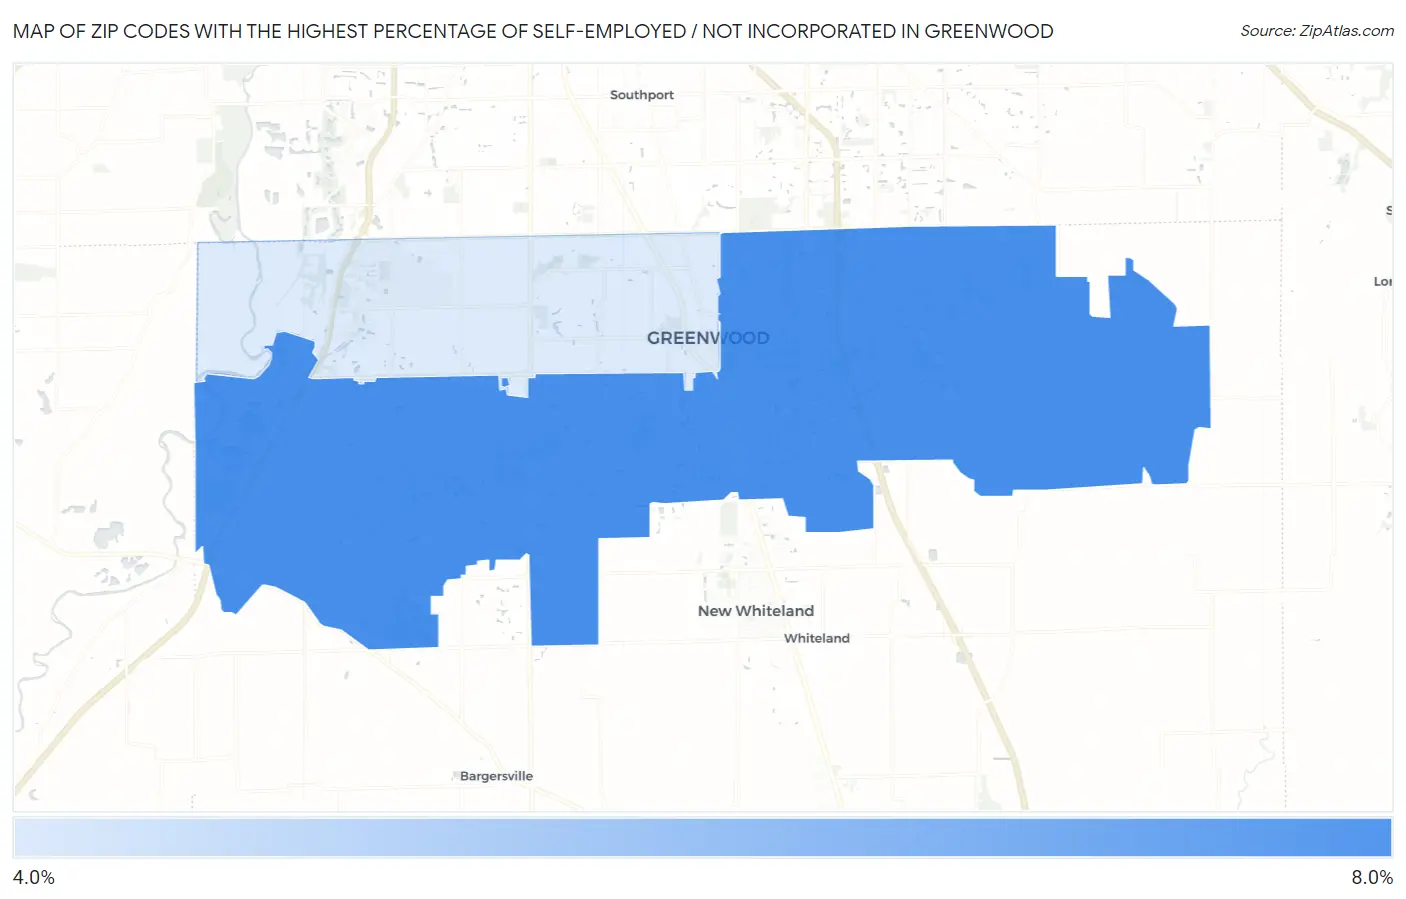
Map of Zip Codes with the Highest Percentage of Self-Employed / Not Incorporated in Greenwood
0.0%
8.0%
Zip Codes with the Highest Percentage of Self-Employed / Not Incorporated in Greenwood, IN
| Zip Code | % Self-Employed / Not Incorporated | vs State | vs National | |
| 1. | 46143 | 6.0% | 4.5%(+1.52)#242 | 5.8%(+0.198)#16,036 |
| 2. | 46142 | 4.2% | 4.5%(-0.301)#425 | 5.8%(-1.62)#22,696 |
1
Common Questions
What are the Top Zip Codes with the Highest Percentage of Self-Employed / Not Incorporated in Greenwood, IN?
Top Zip Codes with the Highest Percentage of Self-Employed / Not Incorporated in Greenwood, IN are:
What zip code has the Highest Percentage of Self-Employed / Not Incorporated in Greenwood, IN?
46143 has the Highest Percentage of Self-Employed / Not Incorporated in Greenwood, IN with 6.0%.
What is the Percentage of Self-Employed / Not Incorporated in Greenwood, IN?
Percentage of Self-Employed / Not Incorporated in Greenwood is 6.0%.
What is the Percentage of Self-Employed / Not Incorporated in Indiana?
Percentage of Self-Employed / Not Incorporated in Indiana is 4.5%.
What is the Percentage of Self-Employed / Not Incorporated in the United States?
Percentage of Self-Employed / Not Incorporated in the United States is 5.8%.