Zip Codes with the Highest Percentage of Population Employed in Health Diagnosing & Treating in Greenwood, IN
RELATED REPORTS & OPTIONS
Health Diagnosing & Treating
Greenwood
Compare Zip Codes
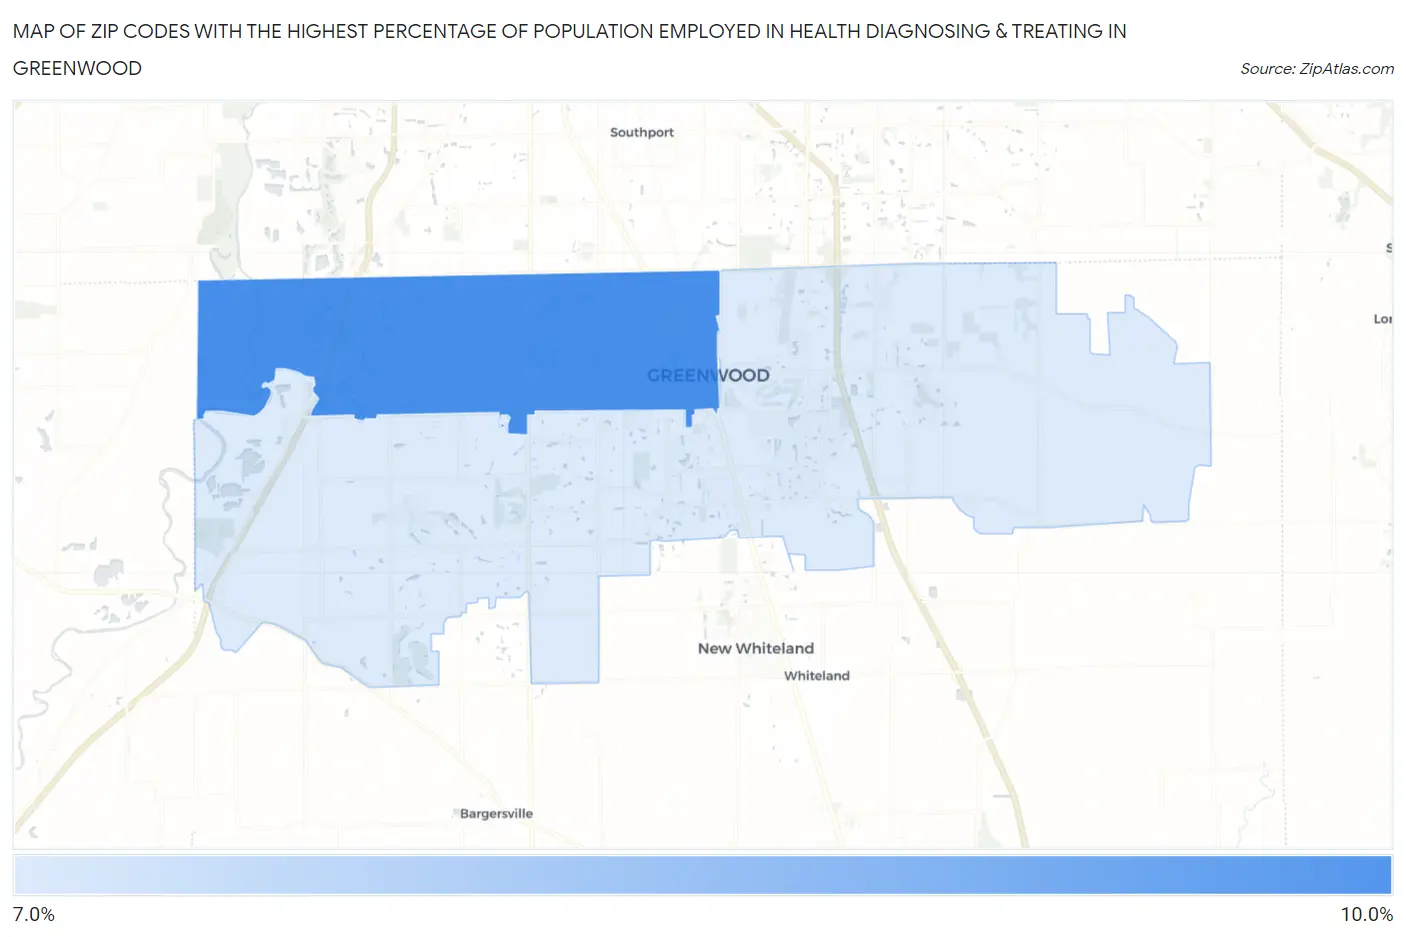
Map of Zip Codes with the Highest Percentage of Population Employed in Health Diagnosing & Treating in Greenwood
7.5%
8.2%
Zip Codes with the Highest Percentage of Population Employed in Health Diagnosing & Treating in Greenwood, IN
| Zip Code | % Employed | vs State | vs National | |
| 1. | 46142 | 8.2% | 6.6%(+1.67)#163 | 6.2%(+1.98)#6,963 |
| 2. | 46143 | 7.5% | 6.6%(+0.984)#207 | 6.2%(+1.29)#8,701 |
1
Common Questions
What are the Top Zip Codes with the Highest Percentage of Population Employed in Health Diagnosing & Treating in Greenwood, IN?
Top Zip Codes with the Highest Percentage of Population Employed in Health Diagnosing & Treating in Greenwood, IN are:
What zip code has the Highest Percentage of Population Employed in Health Diagnosing & Treating in Greenwood, IN?
46142 has the Highest Percentage of Population Employed in Health Diagnosing & Treating in Greenwood, IN with 8.2%.
What is the Percentage of Population Employed in Health Diagnosing & Treating in Greenwood, IN?
Percentage of Population Employed in Health Diagnosing & Treating in Greenwood is 6.8%.
What is the Percentage of Population Employed in Health Diagnosing & Treating in Indiana?
Percentage of Population Employed in Health Diagnosing & Treating in Indiana is 6.6%.
What is the Percentage of Population Employed in Health Diagnosing & Treating in the United States?
Percentage of Population Employed in Health Diagnosing & Treating in the United States is 6.2%.