Zip Codes with the Highest Percentage of Population with a Degree in Liberal Arts and History in Greenwood, IN
RELATED REPORTS & OPTIONS
Liberal Arts and History
Greenwood
Compare Zip Codes
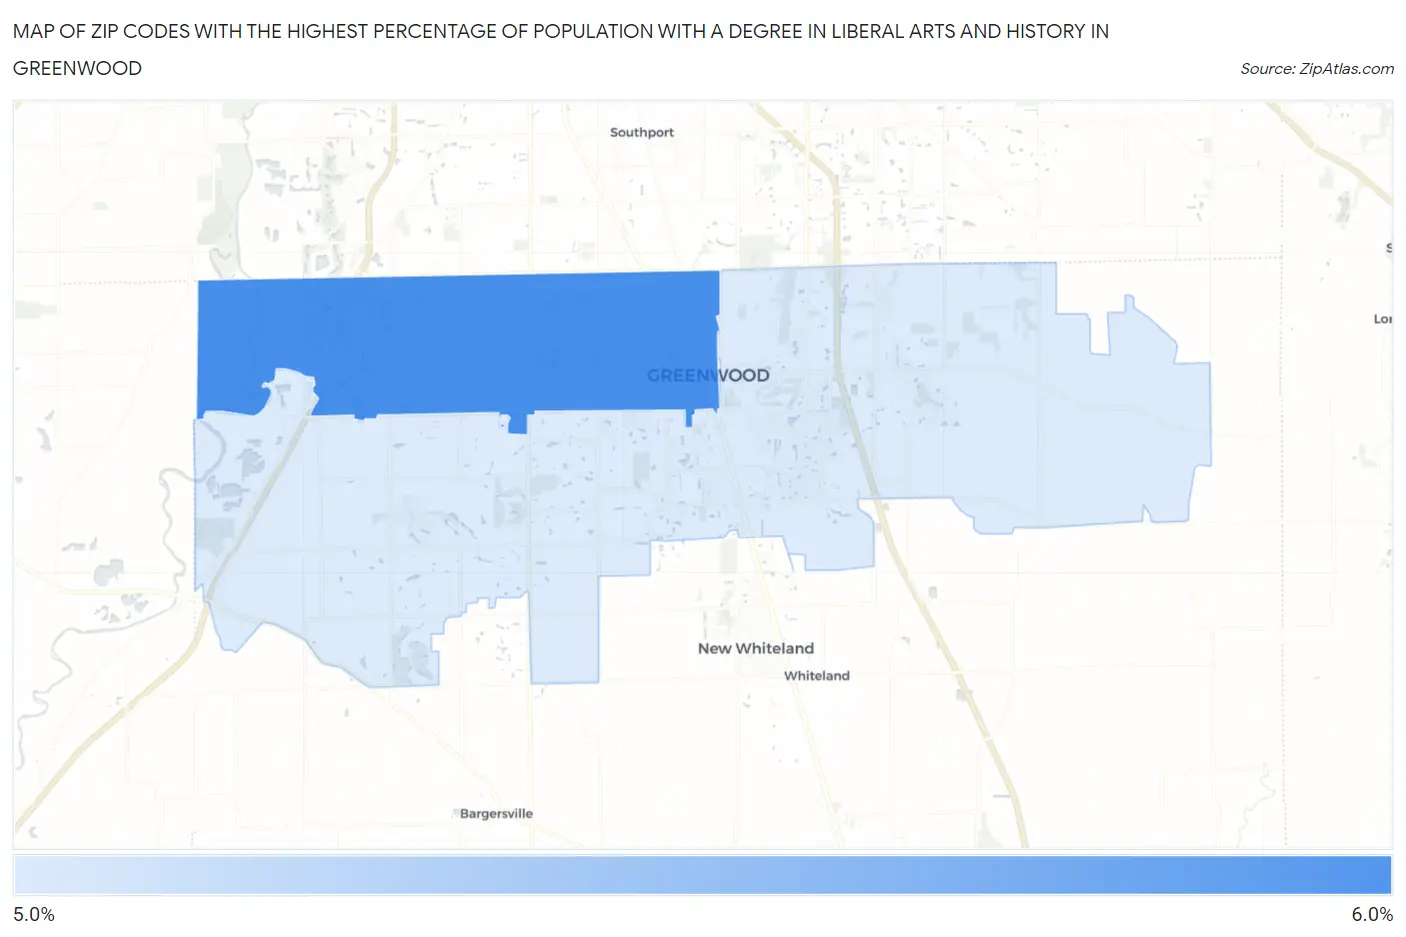
Map of Zip Codes with the Highest Percentage of Population with a Degree in Liberal Arts and History in Greenwood
5.7%
5.9%
Zip Codes with the Highest Percentage of Population with a Degree in Liberal Arts and History in Greenwood, IN
| Zip Code | % Graduates | vs State | vs National | |
| 1. | 46142 | 5.9% | 5.8%(+0.045)#299 | 4.9%(+0.997)#8,872 |
| 2. | 46143 | 5.7% | 5.8%(-0.131)#310 | 4.9%(+0.821)#9,318 |
1
Common Questions
What are the Top Zip Codes with the Highest Percentage of Population with a Degree in Liberal Arts and History in Greenwood, IN?
Top Zip Codes with the Highest Percentage of Population with a Degree in Liberal Arts and History in Greenwood, IN are:
What zip code has the Highest Percentage of Population with a Degree in Liberal Arts and History in Greenwood, IN?
46142 has the Highest Percentage of Population with a Degree in Liberal Arts and History in Greenwood, IN with 5.9%.
What is the Percentage of Population with a Degree in Liberal Arts and History in Greenwood, IN?
Percentage of Population with a Degree in Liberal Arts and History in Greenwood is 6.9%.
What is the Percentage of Population with a Degree in Liberal Arts and History in Indiana?
Percentage of Population with a Degree in Liberal Arts and History in Indiana is 5.8%.
What is the Percentage of Population with a Degree in Liberal Arts and History in the United States?
Percentage of Population with a Degree in Liberal Arts and History in the United States is 4.9%.