Zip Codes with the Highest Percentage of Polish Population in Iowa
RELATED REPORTS & OPTIONS
Polish
Iowa
Compare Zip Codes
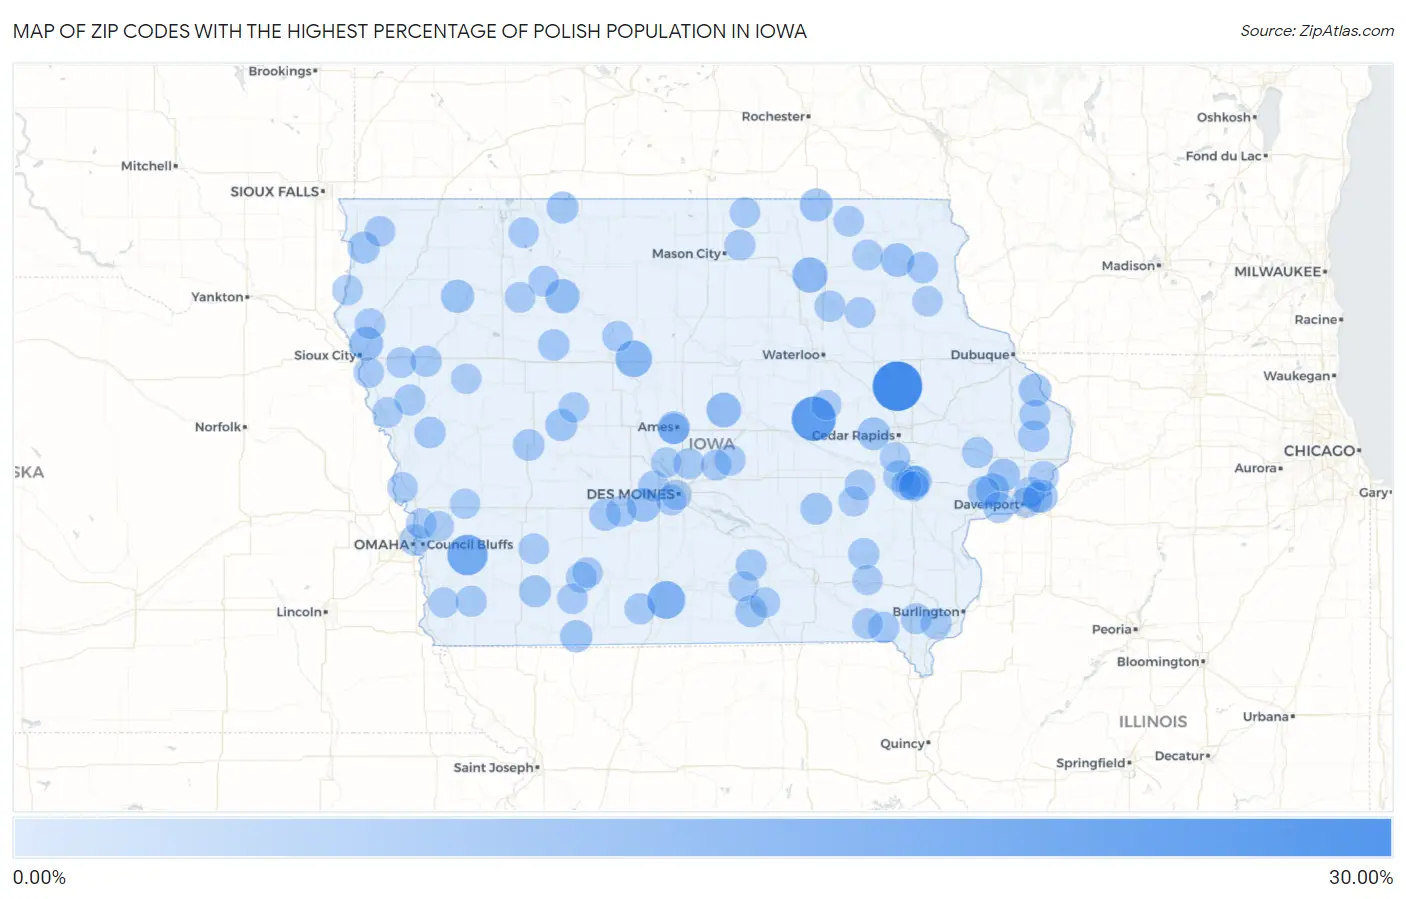
Map of Zip Codes with the Highest Percentage of Polish Population in Iowa
0.00%
30.00%
Zip Codes with the Highest Percentage of Polish Population in Iowa
| Zip Code | Polish | vs State | vs National | |
| 1. | 52344 | 28.00% | 1.19%(+26.8)#1 | 2.61%(+25.4)#139 |
| 2. | 52217 | 20.68% | 1.19%(+19.5)#2 | 2.61%(+18.1)#272 |
| 3. | 51549 | 15.48% | 1.19%(+14.3)#3 | 2.61%(+12.9)#587 |
| 4. | 50264 | 11.97% | 1.19%(+10.8)#4 | 2.61%(+9.36)#1,104 |
| 5. | 50532 | 10.49% | 1.19%(+9.30)#5 | 2.61%(+7.88)#1,455 |
| 6. | 50645 | 8.70% | 1.19%(+7.51)#6 | 2.61%(+6.09)#2,124 |
| 7. | 50239 | 7.91% | 1.19%(+6.73)#7 | 2.61%(+5.30)#2,524 |
| 8. | 50573 | 7.35% | 1.19%(+6.16)#8 | 2.61%(+4.74)#2,824 |
| 9. | 51108 | 6.91% | 1.19%(+5.72)#9 | 2.61%(+4.30)#3,142 |
| 10. | 52242 | 6.86% | 1.19%(+5.67)#10 | 2.61%(+4.25)#3,181 |
| 11. | 52133 | 6.54% | 1.19%(+5.35)#11 | 2.61%(+3.93)#3,452 |
| 12. | 50038 | 6.48% | 1.19%(+5.29)#12 | 2.61%(+3.87)#3,497 |
| 13. | 51029 | 6.07% | 1.19%(+4.88)#13 | 2.61%(+3.46)#3,861 |
| 14. | 52134 | 5.90% | 1.19%(+4.71)#14 | 2.61%(+3.29)#4,032 |
| 15. | 52769 | 5.75% | 1.19%(+4.56)#15 | 2.61%(+3.14)#4,196 |
| 16. | 52767 | 5.58% | 1.19%(+4.40)#16 | 2.61%(+2.97)#4,366 |
| 17. | 52031 | 5.46% | 1.19%(+4.27)#17 | 2.61%(+2.85)#4,506 |
| 18. | 52206 | 5.36% | 1.19%(+4.17)#18 | 2.61%(+2.75)#4,620 |
| 19. | 52745 | 5.21% | 1.19%(+4.02)#19 | 2.61%(+2.59)#4,807 |
| 20. | 50012 | 4.95% | 1.19%(+3.76)#20 | 2.61%(+2.34)#5,103 |
| 21. | 50836 | 4.87% | 1.19%(+3.68)#21 | 2.61%(+2.26)#5,209 |
| 22. | 52747 | 4.77% | 1.19%(+3.58)#22 | 2.61%(+2.16)#5,347 |
| 23. | 51247 | 4.62% | 1.19%(+3.44)#23 | 2.61%(+2.01)#5,541 |
| 24. | 51459 | 4.62% | 1.19%(+3.43)#24 | 2.61%(+2.00)#5,556 |
| 25. | 50857 | 4.35% | 1.19%(+3.16)#25 | 2.61%(+1.74)#5,982 |
| 26. | 52574 | 4.34% | 1.19%(+3.15)#26 | 2.61%(+1.73)#5,994 |
| 27. | 50531 | 4.31% | 1.19%(+3.12)#27 | 2.61%(+1.70)#6,035 |
| 28. | 50104 | 4.30% | 1.19%(+3.11)#28 | 2.61%(+1.69)#6,058 |
| 29. | 50070 | 4.00% | 1.19%(+2.81)#29 | 2.61%(+1.39)#6,567 |
| 30. | 51463 | 3.93% | 1.19%(+2.74)#30 | 2.61%(+1.31)#6,717 |
| 31. | 52731 | 3.73% | 1.19%(+2.54)#31 | 2.61%(+1.12)#7,079 |
| 32. | 50575 | 3.70% | 1.19%(+2.51)#32 | 2.61%(+1.09)#7,130 |
| 33. | 52156 | 3.67% | 1.19%(+2.48)#33 | 2.61%(+1.06)#7,182 |
| 34. | 51572 | 3.66% | 1.19%(+2.48)#34 | 2.61%(+1.05)#7,201 |
| 35. | 52620 | 3.64% | 1.19%(+2.46)#35 | 2.61%(+1.03)#7,244 |
| 36. | 52585 | 3.52% | 1.19%(+2.33)#36 | 2.61%(+0.911)#7,498 |
| 37. | 51510 | 3.52% | 1.19%(+2.33)#37 | 2.61%(+0.907)#7,505 |
| 38. | 50072 | 3.49% | 1.19%(+2.30)#38 | 2.61%(+0.881)#7,543 |
| 39. | 52340 | 3.39% | 1.19%(+2.20)#39 | 2.61%(+0.779)#7,773 |
| 40. | 50028 | 3.38% | 1.19%(+2.19)#40 | 2.61%(+0.767)#7,795 |
| 41. | 52245 | 3.36% | 1.19%(+2.18)#41 | 2.61%(+0.753)#7,835 |
| 42. | 52726 | 3.32% | 1.19%(+2.14)#42 | 2.61%(+0.714)#7,922 |
| 43. | 50150 | 3.28% | 1.19%(+2.09)#43 | 2.61%(+0.666)#8,037 |
| 44. | 52624 | 3.27% | 1.19%(+2.08)#44 | 2.61%(+0.659)#8,058 |
| 45. | 52255 | 3.26% | 1.19%(+2.07)#45 | 2.61%(+0.648)#8,088 |
| 46. | 50676 | 3.25% | 1.19%(+2.06)#46 | 2.61%(+0.635)#8,117 |
| 47. | 50323 | 3.24% | 1.19%(+2.05)#47 | 2.61%(+0.629)#8,133 |
| 48. | 51645 | 3.24% | 1.19%(+2.05)#48 | 2.61%(+0.628)#8,137 |
| 49. | 51051 | 3.23% | 1.19%(+2.04)#49 | 2.61%(+0.615)#8,174 |
| 50. | 51016 | 3.22% | 1.19%(+2.03)#50 | 2.61%(+0.609)#8,189 |
| 51. | 50108 | 3.20% | 1.19%(+2.01)#51 | 2.61%(+0.585)#8,265 |
| 52. | 50073 | 3.13% | 1.19%(+1.94)#52 | 2.61%(+0.517)#8,444 |
| 53. | 52074 | 3.11% | 1.19%(+1.92)#53 | 2.61%(+0.494)#8,494 |
| 54. | 52657 | 3.08% | 1.19%(+1.89)#54 | 2.61%(+0.466)#8,573 |
| 55. | 52807 | 3.02% | 1.19%(+1.83)#55 | 2.61%(+0.411)#8,720 |
| 56. | 50168 | 3.01% | 1.19%(+1.82)#56 | 2.61%(+0.397)#8,764 |
| 57. | 50013 | 2.92% | 1.19%(+1.73)#57 | 2.61%(+0.309)#8,967 |
| 58. | 50467 | 2.91% | 1.19%(+1.72)#58 | 2.61%(+0.301)#8,996 |
| 59. | 50527 | 2.83% | 1.19%(+1.64)#59 | 2.61%(+0.219)#9,221 |
| 60. | 52144 | 2.81% | 1.19%(+1.62)#60 | 2.61%(+0.202)#9,271 |
| 61. | 51556 | 2.79% | 1.19%(+1.60)#61 | 2.61%(+0.174)#9,344 |
| 62. | 51038 | 2.78% | 1.19%(+1.59)#62 | 2.61%(+0.168)#9,368 |
| 63. | 52136 | 2.75% | 1.19%(+1.57)#63 | 2.61%(+0.143)#9,429 |
| 64. | 50842 | 2.74% | 1.19%(+1.55)#64 | 2.61%(+0.128)#9,468 |
| 65. | 52565 | 2.71% | 1.19%(+1.52)#65 | 2.61%(+0.097)#9,565 |
| 66. | 50321 | 2.71% | 1.19%(+1.52)#66 | 2.61%(+0.096)#9,571 |
| 67. | 52361 | 2.70% | 1.19%(+1.51)#67 | 2.61%(+0.085)#9,599 |
| 68. | 50681 | 2.68% | 1.19%(+1.50)#68 | 2.61%(+0.073)#9,641 |
| 69. | 50516 | 2.68% | 1.19%(+1.50)#69 | 2.61%(+0.072)#9,644 |
| 70. | 50851 | 2.68% | 1.19%(+1.49)#70 | 2.61%(+0.070)#9,652 |
| 71. | 50843 | 2.67% | 1.19%(+1.48)#71 | 2.61%(+0.058)#9,684 |
| 72. | 51235 | 2.67% | 1.19%(+1.48)#72 | 2.61%(+0.057)#9,690 |
| 73. | 50565 | 2.62% | 1.19%(+1.44)#73 | 2.61%(+0.013)#9,805 |
| 74. | 51039 | 2.61% | 1.19%(+1.42)#74 | 2.61%(-0.006)#9,860 |
| 75. | 51011 | 2.60% | 1.19%(+1.41)#75 | 2.61%(-0.014)#9,887 |
| 76. | 51054 | 2.58% | 1.19%(+1.40)#76 | 2.61%(-0.026)#9,922 |
| 77. | 51364 | 2.54% | 1.19%(+1.35)#77 | 2.61%(-0.069)#10,049 |
| 78. | 52246 | 2.54% | 1.19%(+1.35)#78 | 2.61%(-0.073)#10,059 |
| 79. | 52803 | 2.54% | 1.19%(+1.35)#79 | 2.61%(-0.074)#10,060 |
| 80. | 50801 | 2.53% | 1.19%(+1.35)#80 | 2.61%(-0.077)#10,072 |
| 81. | 50426 | 2.53% | 1.19%(+1.34)#81 | 2.61%(-0.080)#10,084 |
| 82. | 50309 | 2.45% | 1.19%(+1.26)#82 | 2.61%(-0.162)#10,335 |
| 83. | 52722 | 2.45% | 1.19%(+1.26)#83 | 2.61%(-0.163)#10,338 |
| 84. | 51526 | 2.44% | 1.19%(+1.25)#84 | 2.61%(-0.175)#10,386 |
| 85. | 50050 | 2.42% | 1.19%(+1.23)#85 | 2.61%(-0.189)#10,437 |
| 86. | 52043 | 2.42% | 1.19%(+1.23)#86 | 2.61%(-0.192)#10,447 |
| 87. | 52768 | 2.41% | 1.19%(+1.22)#87 | 2.61%(-0.204)#10,488 |
| 88. | 51653 | 2.40% | 1.19%(+1.21)#88 | 2.61%(-0.213)#10,521 |
| 89. | 51576 | 2.40% | 1.19%(+1.21)#89 | 2.61%(-0.213)#10,523 |
| 90. | 52569 | 2.38% | 1.19%(+1.19)#90 | 2.61%(-0.230)#10,577 |
| 91. | 52316 | 2.31% | 1.19%(+1.12)#91 | 2.61%(-0.300)#10,809 |
| 92. | 50226 | 2.31% | 1.19%(+1.12)#92 | 2.61%(-0.302)#10,817 |
| 93. | 52556 | 2.31% | 1.19%(+1.12)#93 | 2.61%(-0.302)#10,818 |
| 94. | 52571 | 2.31% | 1.19%(+1.12)#94 | 2.61%(-0.304)#10,831 |
| 95. | 51445 | 2.30% | 1.19%(+1.11)#95 | 2.61%(-0.315)#10,879 |
| 96. | 52338 | 2.29% | 1.19%(+1.10)#96 | 2.61%(-0.321)#10,898 |
| 97. | 52224 | 2.28% | 1.19%(+1.09)#97 | 2.61%(-0.330)#10,925 |
| 98. | 51063 | 2.27% | 1.19%(+1.08)#98 | 2.61%(-0.339)#10,959 |
| 99. | 52240 | 2.26% | 1.19%(+1.08)#99 | 2.61%(-0.347)#10,990 |
| 100. | 51570 | 2.26% | 1.19%(+1.07)#100 | 2.61%(-0.353)#11,010 |
Common Questions
What are the Top 10 Zip Codes with the Highest Percentage of Polish Population in Iowa?
Top 10 Zip Codes with the Highest Percentage of Polish Population in Iowa are:
What zip code has the Highest Percentage of Polish Population in Iowa?
52344 has the Highest Percentage of Polish Population in Iowa with 28.00%.
What is the Percentage of Polish Population in the State of Iowa?
Percentage of Polish Population in Iowa is 1.19%.
What is the Percentage of Polish Population in the United States?
Percentage of Polish Population in the United States is 2.61%.