Zip Codes with the Highest Poverty Level Among Single Fathers in Iowa
RELATED REPORTS & OPTIONS
Highest Poverty | Single Father
Iowa
Compare Zip Codes
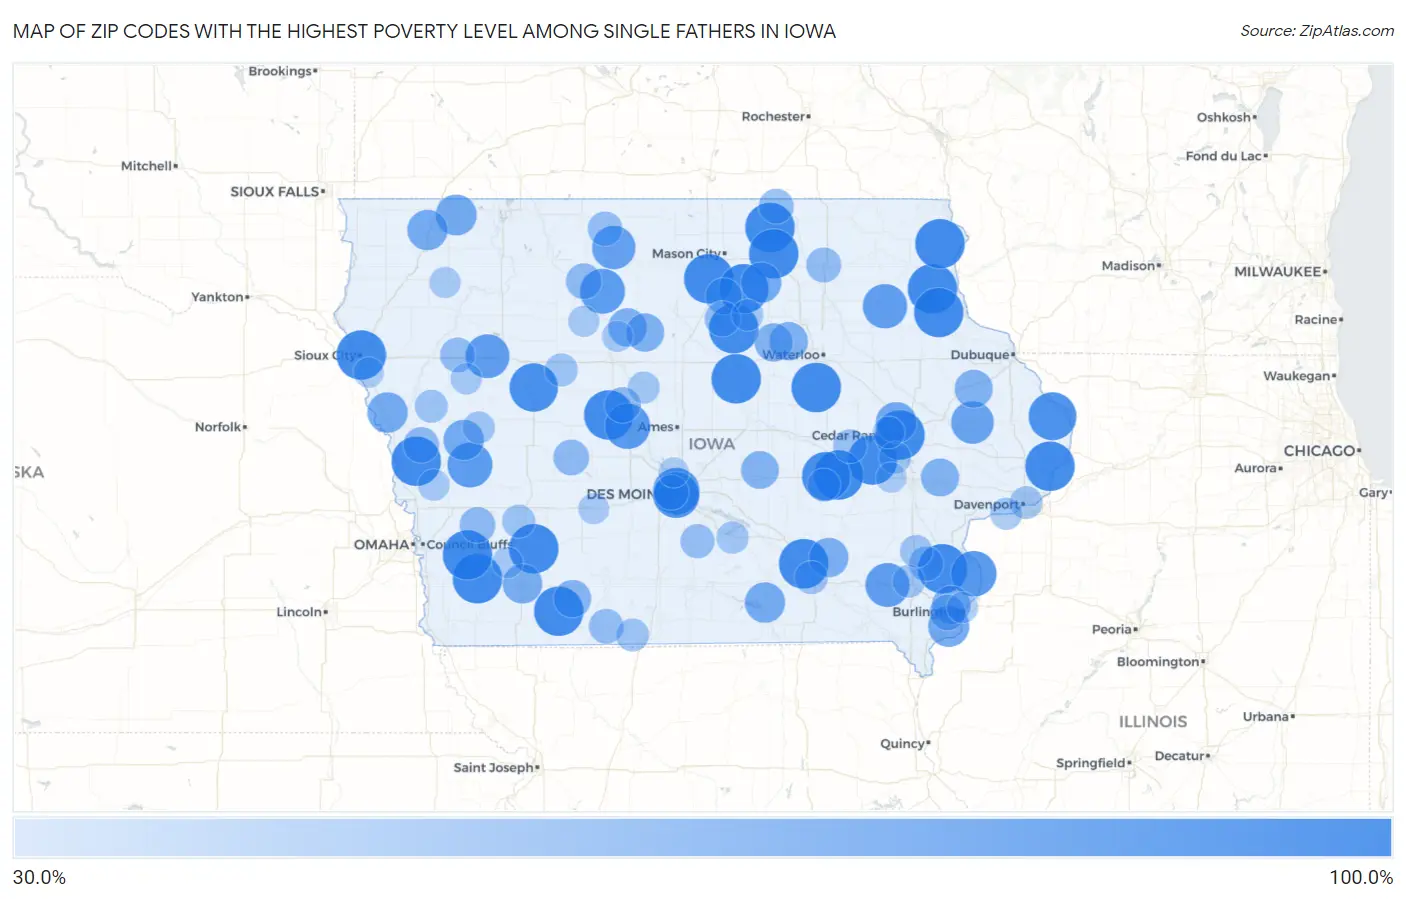
Map of Zip Codes with the Highest Poverty Level Among Single Fathers in Iowa
30.0%
100.0%
Zip Codes with the Highest Poverty Level Among Single Fathers in Iowa
| Zip Code | Single Father Poverty | vs State | vs National | |
| 1. | 50461 | 100.0% | 12.2%(+87.8)#1 | 13.7%(+86.3)#86 |
| 2. | 52730 | 100.0% | 12.2%(+87.8)#2 | 13.7%(+86.3)#88 |
| 3. | 50627 | 100.0% | 12.2%(+87.8)#3 | 13.7%(+86.3)#162 |
| 4. | 52203 | 100.0% | 12.2%(+87.8)#4 | 13.7%(+86.3)#238 |
| 5. | 52401 | 100.0% | 12.2%(+87.8)#5 | 13.7%(+86.3)#252 |
| 6. | 52640 | 100.0% | 12.2%(+87.8)#6 | 13.7%(+86.3)#370 |
| 7. | 51101 | 100.0% | 12.2%(+87.8)#7 | 13.7%(+86.3)#451 |
| 8. | 51533 | 100.0% | 12.2%(+87.8)#8 | 13.7%(+86.3)#529 |
| 9. | 52072 | 100.0% | 12.2%(+87.8)#9 | 13.7%(+86.3)#548 |
| 10. | 50435 | 100.0% | 12.2%(+87.8)#10 | 13.7%(+86.3)#589 |
| 11. | 52251 | 100.0% | 12.2%(+87.8)#11 | 13.7%(+86.3)#640 |
| 12. | 52170 | 100.0% | 12.2%(+87.8)#12 | 13.7%(+86.3)#650 |
| 13. | 50843 | 100.0% | 12.2%(+87.8)#13 | 13.7%(+86.3)#657 |
| 14. | 51564 | 100.0% | 12.2%(+87.8)#14 | 13.7%(+86.3)#661 |
| 15. | 51549 | 100.0% | 12.2%(+87.8)#15 | 13.7%(+86.3)#701 |
| 16. | 50612 | 100.0% | 12.2%(+87.8)#16 | 13.7%(+86.3)#717 |
| 17. | 50633 | 100.0% | 12.2%(+87.8)#17 | 13.7%(+86.3)#730 |
| 18. | 52044 | 100.0% | 12.2%(+87.8)#18 | 13.7%(+86.3)#761 |
| 19. | 52566 | 100.0% | 12.2%(+87.8)#19 | 13.7%(+86.3)#790 |
| 20. | 50477 | 100.0% | 12.2%(+87.8)#20 | 13.7%(+86.3)#819 |
| 21. | 50433 | 100.0% | 12.2%(+87.8)#21 | 13.7%(+86.3)#842 |
| 22. | 50064 | 100.0% | 12.2%(+87.8)#22 | 13.7%(+86.3)#869 |
| 23. | 50862 | 100.0% | 12.2%(+87.8)#23 | 13.7%(+86.3)#877 |
| 24. | 52347 | 96.6% | 12.2%(+84.4)#24 | 13.7%(+82.8)#909 |
| 25. | 51433 | 96.2% | 12.2%(+84.0)#25 | 13.7%(+82.4)#911 |
| 26. | 52064 | 93.8% | 12.2%(+81.6)#26 | 13.7%(+80.0)#931 |
| 27. | 50314 | 89.9% | 12.2%(+77.7)#27 | 13.7%(+76.2)#967 |
| 28. | 50309 | 87.5% | 12.2%(+75.3)#28 | 13.7%(+73.8)#983 |
| 29. | 52646 | 85.7% | 12.2%(+73.6)#29 | 13.7%(+72.0)#1,013 |
| 30. | 50212 | 85.0% | 12.2%(+72.8)#30 | 13.7%(+71.3)#1,020 |
| 31. | 50519 | 83.3% | 12.2%(+71.2)#31 | 13.7%(+69.6)#1,057 |
| 32. | 51530 | 83.3% | 12.2%(+71.2)#32 | 13.7%(+69.6)#1,059 |
| 33. | 52142 | 81.2% | 12.2%(+69.1)#33 | 13.7%(+67.5)#1,088 |
| 34. | 51053 | 80.0% | 12.2%(+67.8)#34 | 13.7%(+66.3)#1,122 |
| 35. | 52635 | 80.0% | 12.2%(+67.8)#35 | 13.7%(+66.3)#1,127 |
| 36. | 50522 | 77.8% | 12.2%(+65.6)#36 | 13.7%(+64.1)#1,185 |
| 37. | 52362 | 75.0% | 12.2%(+62.8)#37 | 13.7%(+61.3)#1,244 |
| 38. | 52658 | 70.0% | 12.2%(+57.8)#38 | 13.7%(+56.3)#1,372 |
| 39. | 51354 | 68.8% | 12.2%(+56.6)#39 | 13.7%(+55.0)#1,406 |
| 40. | 52233 | 68.6% | 12.2%(+56.5)#40 | 13.7%(+54.9)#1,407 |
| 41. | 52571 | 66.7% | 12.2%(+54.5)#41 | 13.7%(+53.0)#1,481 |
| 42. | 51063 | 66.7% | 12.2%(+54.5)#42 | 13.7%(+53.0)#1,483 |
| 43. | 51232 | 66.7% | 12.2%(+54.5)#43 | 13.7%(+53.0)#1,491 |
| 44. | 51528 | 66.7% | 12.2%(+54.5)#44 | 13.7%(+53.0)#1,497 |
| 45. | 50653 | 66.7% | 12.2%(+54.5)#45 | 13.7%(+53.0)#1,502 |
| 46. | 50864 | 63.6% | 12.2%(+51.5)#46 | 13.7%(+49.9)#1,600 |
| 47. | 52563 | 63.2% | 12.2%(+51.0)#47 | 13.7%(+49.4)#1,616 |
| 48. | 52655 | 60.0% | 12.2%(+47.8)#48 | 13.7%(+46.3)#1,749 |
| 49. | 50660 | 60.0% | 12.2%(+47.8)#49 | 13.7%(+46.3)#1,770 |
| 50. | 50591 | 60.0% | 12.2%(+47.8)#50 | 13.7%(+46.3)#1,787 |
| 51. | 50533 | 59.8% | 12.2%(+47.6)#51 | 13.7%(+46.0)#1,796 |
| 52. | 50665 | 59.2% | 12.2%(+47.1)#52 | 13.7%(+45.5)#1,816 |
| 53. | 52358 | 58.3% | 12.2%(+46.2)#53 | 13.7%(+44.6)#1,853 |
| 54. | 52033 | 58.3% | 12.2%(+46.2)#54 | 13.7%(+44.6)#1,854 |
| 55. | 50135 | 57.1% | 12.2%(+45.0)#55 | 13.7%(+43.4)#1,929 |
| 56. | 50851 | 56.4% | 12.2%(+44.3)#56 | 13.7%(+42.7)#1,964 |
| 57. | 50475 | 52.2% | 12.2%(+40.0)#57 | 13.7%(+38.5)#2,187 |
| 58. | 50597 | 50.0% | 12.2%(+37.8)#58 | 13.7%(+36.3)#2,364 |
| 59. | 51558 | 50.0% | 12.2%(+37.8)#59 | 13.7%(+36.3)#2,390 |
| 60. | 50029 | 50.0% | 12.2%(+37.8)#60 | 13.7%(+36.3)#2,403 |
| 61. | 52638 | 50.0% | 12.2%(+37.8)#61 | 13.7%(+36.3)#2,407 |
| 62. | 51536 | 50.0% | 12.2%(+37.8)#62 | 13.7%(+36.3)#2,422 |
| 63. | 50040 | 50.0% | 12.2%(+37.8)#63 | 13.7%(+36.3)#2,444 |
| 64. | 50441 | 49.0% | 12.2%(+36.9)#64 | 13.7%(+35.3)#2,478 |
| 65. | 51025 | 47.1% | 12.2%(+34.9)#65 | 13.7%(+33.3)#2,568 |
| 66. | 50476 | 47.1% | 12.2%(+34.9)#66 | 13.7%(+33.3)#2,570 |
| 67. | 50659 | 46.9% | 12.2%(+34.7)#67 | 13.7%(+33.2)#2,578 |
| 68. | 50311 | 46.8% | 12.2%(+34.6)#68 | 13.7%(+33.1)#2,588 |
| 69. | 50854 | 46.7% | 12.2%(+34.5)#69 | 13.7%(+33.0)#2,603 |
| 70. | 52659 | 45.5% | 12.2%(+33.3)#70 | 13.7%(+31.7)#2,685 |
| 71. | 50517 | 45.5% | 12.2%(+33.3)#71 | 13.7%(+31.7)#2,692 |
| 72. | 50166 | 44.4% | 12.2%(+32.3)#72 | 13.7%(+30.7)#2,755 |
| 73. | 52209 | 42.9% | 12.2%(+30.7)#73 | 13.7%(+29.1)#2,875 |
| 74. | 52501 | 41.1% | 12.2%(+29.0)#74 | 13.7%(+27.4)#3,023 |
| 75. | 50022 | 41.0% | 12.2%(+28.9)#75 | 13.7%(+27.3)#3,030 |
| 76. | 50579 | 40.0% | 12.2%(+27.8)#76 | 13.7%(+26.3)#3,110 |
| 77. | 50140 | 40.0% | 12.2%(+27.8)#77 | 13.7%(+26.3)#3,112 |
| 78. | 51034 | 40.0% | 12.2%(+27.8)#78 | 13.7%(+26.3)#3,126 |
| 79. | 52221 | 40.0% | 12.2%(+27.8)#79 | 13.7%(+26.3)#3,157 |
| 80. | 52641 | 39.4% | 12.2%(+27.3)#80 | 13.7%(+25.7)#3,208 |
| 81. | 52803 | 39.3% | 12.2%(+27.2)#81 | 13.7%(+25.6)#3,219 |
| 82. | 52621 | 38.9% | 12.2%(+26.7)#82 | 13.7%(+25.2)#3,259 |
| 83. | 50138 | 37.8% | 12.2%(+25.7)#83 | 13.7%(+24.1)#3,349 |
| 84. | 51442 | 37.7% | 12.2%(+25.5)#84 | 13.7%(+24.0)#3,366 |
| 85. | 52338 | 36.8% | 12.2%(+24.7)#85 | 13.7%(+23.1)#3,446 |
| 86. | 52728 | 36.8% | 12.2%(+24.7)#86 | 13.7%(+23.1)#3,453 |
| 87. | 52405 | 36.4% | 12.2%(+24.3)#87 | 13.7%(+22.7)#3,491 |
| 88. | 50249 | 36.4% | 12.2%(+24.2)#88 | 13.7%(+22.7)#3,514 |
| 89. | 50625 | 35.7% | 12.2%(+23.6)#89 | 13.7%(+22.0)#3,582 |
| 90. | 51546 | 35.1% | 12.2%(+22.9)#90 | 13.7%(+21.4)#3,651 |
| 91. | 51445 | 34.5% | 12.2%(+22.3)#91 | 13.7%(+20.8)#3,710 |
| 92. | 52601 | 33.7% | 12.2%(+21.5)#92 | 13.7%(+20.0)#3,786 |
| 93. | 51046 | 33.3% | 12.2%(+21.2)#93 | 13.7%(+19.6)#3,854 |
| 94. | 50541 | 33.3% | 12.2%(+21.2)#94 | 13.7%(+19.6)#3,877 |
| 95. | 50516 | 33.3% | 12.2%(+21.2)#95 | 13.7%(+19.6)#3,886 |
| 96. | 51532 | 33.3% | 12.2%(+21.2)#96 | 13.7%(+19.6)#3,888 |
| 97. | 50250 | 32.7% | 12.2%(+20.5)#97 | 13.7%(+18.9)#3,974 |
| 98. | 52322 | 31.2% | 12.2%(+19.1)#98 | 13.7%(+17.5)#4,147 |
| 99. | 51054 | 31.0% | 12.2%(+18.9)#99 | 13.7%(+17.3)#4,171 |
| 100. | 50023 | 30.9% | 12.2%(+18.7)#100 | 13.7%(+17.2)#4,191 |
Common Questions
What are the Top 10 Zip Codes with the Highest Poverty Level Among Single Fathers in Iowa?
Top 10 Zip Codes with the Highest Poverty Level Among Single Fathers in Iowa are:
What zip code has the Highest Poverty Level Among Single Fathers in Iowa?
50461 has the Highest Poverty Level Among Single Fathers in Iowa with 100.0%.
What is the Poverty Level Among Single Fathers in the State of Iowa?
Poverty Level Among Single Fathers in Iowa is 12.2%.
What is the Poverty Level Among Single Fathers in the United States?
Poverty Level Among Single Fathers in the United States is 13.7%.